© 2016, IRJET | Impact Factor value: 4.45 | ISO 9001:2008 Certified Journal | Page 2203
Analytical Study of Performance of Students using Data Mining
Techniques
Harneet Kaur Bhatia
1, Shaziya Islam
21
Harneet Kaur Bhatia Mtech(CSE) & Dongargarh
2Shaziya Islam Professor,Dept.CSE,RCET Engineering & Bhilai
Chhattisgarh, India
---***---Abstract:
This paper presents a data miningmethodology to investigate the performance of students. We analyze unique approaches standing on cluster analysis and regression trees so as to identify methods for enhancing the performance of high school kids. We also figure out ways to create a prediction model and find out factors responsible for the performance of students in final exams. The approach thus used gives a clear idea of current evaluation as well, as the results were based on actual records.
Key Words
: Data mining, Clustering, Frequent Pattern Analysis,Regression tree.1.INTRODUCTION
The large abundance of data held within the computer
systems of several organizations, each public and
personal,has given a push towards the direction of the
advent of latest technologies for knowledge
management and analysis. Data processing techniques
originate in context, with the aim of discovering
hidden and non-trivial relationships among data of
varied nature. This set of techniques, employed in
completely different sectors, together with the
academic environment, comes from the normal
strategies of information analysis and have the
characteristic of having the ability to treat giant
amounts of data.
In the field of education, academic data processing
could be a recent research space that explores and
analyzes the data kept in student databases so as to
grasp and improve the performance of the coed
learning method. Knowledge square measure analyzed
by using applied math, machine learning and data
processing algorithms, with the aim of resolution issues
of academic
analysis and improves the whole academic
method. Recently there has been an increase within the
use of academic code instruments and of databases
containing students data, thus we've giant repositories
of information reflective however students learn.
Additionally, the use of net in education has created the
context of e-learning or web-based education that
unceasingly generates giant amounts of information
regarding the interactions between teaching and
learning. Academic data processing tries to use all this
information to higher perceive learners and learning,
and to develop methodologies that, desegregation the
information with the theory, enable to boost the
academic method. Data mining has gained huge
popularity in computer science lingo, due to the advent
of fast growing data sets and boom in the data
generated and collection as various horizontal as well
as
verticals
of
any
domain
expertise.
Telecommunications, Education, or Politics each area
intersects with recognition of patterns in process of
understanding behavioral patterns in mechanical as
well as human components of the system under
observation.
Student grading is an age old tradition in finding
the merit of student’s academic performance. Sadly a
whole underlying problem is left hidden, by not trying
to understand the factors which make some students
perform better than others in examination. In this
paper we try to find some major factors in academic
performance of students using the final grades and
several attributes socio-cultural, and effort, orientation
based
2. Related Work
© 2016, IRJET | Impact Factor value: 4.45 | ISO 9001:2008 Certified Journal | Page 2204
Delavari, Somnuk, and Beikzadeh (2008)[18], a model isplanned that presents the benefits of knowledge mining technology in higher educational systems; the authors provides a style of road map to help the institutions to spot the ways in which to enhance their processes. In Daimi and Miller (2009), [8] the authors illustrate a model to research the profile of scholars that possibly leave school while not ending their career. above all, they use some classification algorithms enforced within the wood hen system (Witten, Frank, & Hall) 2011).[19] Recommendations of appropriate courses for students square measure analyzed with totally different approaches in ydzovs a and Popel ns y [4] with the aim of predicting student success. In Damaševicˇius [9] a framework is planned for mining educational knowledge mistreatment association rules. a lot of recently, Romero, Zafra, Luna, and Ventura (2013) [6]proposes the applying of association rule mining to enhance quizzes and courses and (Saarela et al., 2014) applies frequent itemset mining and association rule learning to students antecedently classified by cluster techniques. In Guruler, Istanbullu, and Karahasan (2010),[18] so as to explore the factors having impact on the success of university students, a system supported the choice tree classification technique is presented. Cluster is employed in Campagni, Merlini, and Verri (2014)[18] for analyzing knowledge regarding the analysis of courses taken by students, coupled to their leads to the corresponding exams. The work conferred in Dutt, Aghabozrgi, Ismail, and Mahroeian (2015) [18] reviews totally different cluster algorithms applied to educational data processing context whereas (Peña-Ayala, 2014) is associate interesting review of recent instructional data processing development whose contents square measure successively analyzed by an information mining approach. As already discovered, data processing techniques have conjointly been applied in computer-based, e-learning and web-based instructional systems (Bouchet, Harley, & Trevors, 2013; Bogarín, Romero, Cerezo, & Sánchez-Santillán, 2014; socialist, Vellido, Nebot, & Mugica, 2007; Hämäläinen, Laine, & Sutinen, 2006; Koedinger, Cunningham,Skogsholm, & Leber, 2008; Mostow & motion, 2006; Merceron & Yacef, 2005; Romero, Romero, Luna, & Ventura, 2010; Romero, Ventura, & García, 2008; Romero, López, Luna, & Ventura, 2013).[18][19][20]The existing literature concerning the employment of knowledge mining in instructional systems is especially involved with techniques like cluster, classification and association rules Damaševicˇius, ; Tan, Steinbach, & Kumar, 2006; Witten et al., 2011; Wu dialect & Kumar, 2009).[7] An academic program sometimes defines a selected learning program that puts some styles of restrictions on however the scholars are needed to require courses. These constraints generally describe a set of courses and a collection of relationships between them. within the current apply, however, students have several degree of freedom, therefore serving to students to settle on courses, discovering patterns and key courses, coming up with future courses and refinement curricula based on the feedback of scholars square measure
vital instructional tasks, as recently recognized in Aher and Lobo (2013), Kardan, Sadeghi, Ghidary, and Sani (2013), Méndez, Ochoa, and Chiluiza (2014) and Pechenizkiy, Trcka, Bra, and Toledo (2012).[21] this work fits into this context extending and unifying the results conferred in Campagni, Merlini, and Sprugnoli (2012a, 2012b, 2012c).[18] In particular, we have a tendency to introduce the idea of ideal career, that is, the career of a graduated student World Health Organization takes each examination simply when the end of the corresponding course, immediately, and propose a data mining methodology, supported cluster and ordered pattern analysis, to review the coed behavior by examination student careers with the perfect one. Ordered pattern analysis has been used in the context of instructional data processing primarily in computer-based environments.
As an example, Soundranayagam and Yacef (2010) [9] explores the order within which students access e-learning resources as they solve set assessment tasks, like tests, assignments and exams and also the links with students learning. A method to mechanically sight cooperative patterns of student and tutor dialogue moves is illustrated in D‟Mello, Olney, and Person (2010). Paper (Martinez, Yacef, Kay, Al-Qaraghuli, & Kharrufa, 2011)[18] mines and clusters frequent patterns to check distinct behaviors between low and high accomplishment teams around associate interactive work surface. An information mining methodology for identifying and examination learning behaviors from students learning interaction traces is conferred in Kinnebrew, Loretz, and Biswas (2013);[19] above all, the paper proposes associate rule that employs a unique combination of sequence mining techniques to identify differentially frequent patterns between teams of students. Paper (Guerra, Sahebi, Brusilovsky, & Lin, 2014) [7] models and examines patterns of student behavior with parameterized exercise. A recent analysis that issue during a direction similar to ours is illustrated in Asif, Merceron, and Pathan (2014),[7] where the progression of a student is analyzed by shaping a tuple that shows however the results of a year.
2.1. PROBLEM IDENTIFICATION
© 2016, IRJET | Impact Factor value: 4.45 | ISO 9001:2008 Certified Journal | Page 2205
product which can be priced accordingly. Clusteringalgorithm such as k-means works on centralized data repository, space complexity can be a problem for huge datasets in this case. Far off data points in dataset are often considered dead i.e. of no use when clustering. Thus when solving a data mining problem with clustering needs manual intervention. The values of performance in case of score information, usually don't have a constant norm, we need to consider applicable boundaries for such attributes.
2.2.1.
Selection of mining technique
Mining large data set has to deal with trading off efficiency with accuracy, when choosing mining techniques one has to look into the data set, and fit the data set into a model. Student scores by inspection are quantified data, for understanding patterns in the data we can either partition the data set into high scorers and low scorers using Support Vector Machines (SVM), by partitioning the vector space linearly, using linear partitioning of the data set we miss hidden attributes which limit the accuracy. e.g. If the training data set comes from an year which had an easier/tougher set of examination papers, we will be facing variations in the results, due to the missing attribute which in this case is the competency level of examination.
2.1.2. Clustering
Clustering deals with finding naturally occurring groups inside the dataset. As we cluster the data, using maximization of differences (distances) in different data points and minimization in similar data points, we tend to get a natural group. By keeping the data set intact, unsupervised learning using clustering will give an accurate result. Natural classes in data are discovered by using clustering. Most common clustering algorithm k-Means was used for this study. K–Means algorithm is the simplest clustering algorithm, which classifies data into k disjoint sets, by finding the Euclidean distance between data points. The problem with k-means is that the value of k needs to be fixed by exploration, as we get a very different efficiency for different values of k. Cluster analysis itself is not one specific algorithm, but the general task to be solved. It can be achieved by various algorithms that differ significantly in their notion of what constitutes a cluster and how to efficiently find them. Each cluster is associated with a centroid and each point is assigned to the cluster with the closest centroid. To assign a point to the closest centroid, the proximity measure that quantify the notion of „„closest‟‟ can be, for example, the Euclidean distance, the Manhattan distance or the cosine similarity, according to type of data under consideration. The number of clusters, K, must be specified and the first K initial centroids are typically chosen at random among the points of the data set. This initial choice determines the resulting clusters whose goodness need to be evaluated with a quality measure. Sum of squared error is calculated using the given formula
∑
2.1.3.
Regression Trees
Classification and regression trees are intuitive ways, often represented in graphical or biological terms. A tree is typically shown growing top side down, beginning at its root. An observation passes down the tree through a series of splits, or nodes, at that a call is created on which direction to proceed based on the worth of 1 of the explanatory variables. Ultimately, a terminal node or leaf is reached and predicted response is given. Trees partition the explanatory variables into a series of boxes (the leaves) that contain the most homogeneous collection of outcomes potential. Creating splits is analogous to variable selection in regression. Trees are typically created via binary algorithmic partitioning. The term binary refers to the fact that the parent node can continually be split into exactly 2 kid nodes. The term recursive is used to point that every child node can, in turn, become a parent node, unless it is a terminal node. To start with, a single split is created using one informative variable. The variable and the location of the split are chosen to minimize the impurity of the node at that time. There are several ways in which to reduce the impurity of every node. These are famed as cacophonous rules. Each of the 2 regions that result from the initial split are then split themselves according to identical criteria, and the tree continues to grow until it is now not potential to make additional splits or the method is stopped by some user-defined criteria. The tree may then be reduced in size using a method called pruning. Assigning a foretold worth to the terminal nodes will be done in variety of how. Typically, in classification trees, values at the terminal nodes are assigned the category which represents the plurality of cases in that node. The rules of class assignment will be altered supported a value function, to adjust for the results of constructing a mistake for certain categories, or to compensate for unequal sampling of classes. In the case of regression trees, values at the terminal node are assigned victimization the mean of cases in that node[27]. This method minimizes the mean absolute deviation from the median within a node. The advantage of this over least squares is that it is not as sensitive to outliers and provides a more robust model. The disadvantage is in insensitivity when dealing with data sets containing a large proportion of zeros. The impurity of classification using regression trees can be calculated using either of three evaluations.
3. Methodology
© 2016, IRJET | Impact Factor value: 4.45 | ISO 9001:2008 Certified Journal | Page 2206
breaks taken etc. along with final examination scores. Datamining process has 5 major steps of KDD
Selection Pre-Processing Transformation Data Mining Interpretation
Normalization is a systematic way of ensuring that a database structure is suitable for general-purpose querying and free of certain undesirable characteristics that could lead to loss of data integrity. Normalization is typically a refinement process after the initial exercise of identifying the data objects that should be in the database, identifying their relationships, and defining the tables required and the columns within each table.
[image:4.595.46.533.74.731.2]Fig.1 – Brief methodology
[image:4.595.364.503.107.260.2]Fig.1 Usage of K-means clustering
Fig.2 - Continued Analysis using Regression Trees
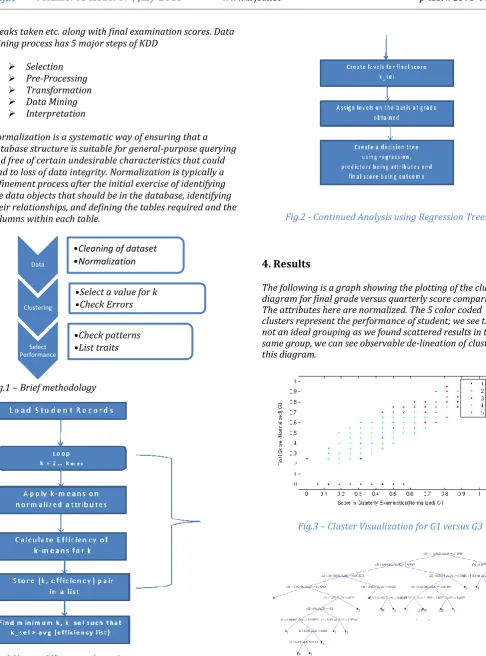
4. Results
The following is a graph showing the plotting of the cluster diagram for final grade versus quarterly score comparison. The attributes here are normalized. The 5 color coded clusters represent the performance of student; we see this is not an ideal grouping as we found scattered results in the same group, we can see observable de-lineation of clusters in this diagram.
Fig.3 – Cluster Visualization for G1 versus G3
Fig. 4 – Regression decision tree for the cluster membership Data
•Cleaning of dataset •Normalization
Clustering
•Select a value for k •Check Errors
Select Performance
[image:4.595.65.254.311.442.2] [image:4.595.324.538.448.586.2]© 2016, IRJET | Impact Factor value: 4.45 | ISO 9001:2008 Certified Journal | Page 2207
Using the above shown clusters, we calculate themembership using regression tree, the 26 attributes of the dataset are used as the predictors to evaluate final score. Using the regression tree further creates a model which is visual to show the factors responsible, and can be used to predict the grades using membership of clusters. Observation of attributes responsible in order of decision tree occurrences, were as following,
Previous Examination scores (25,26) Attendance / Absence (24)
Health (23) Study Time (8) Age (2)
Fathers Education (5) Mothers Education(6)
[image:5.595.328.557.125.311.2]The numbers represent the attributes (predictor) index in dataset.
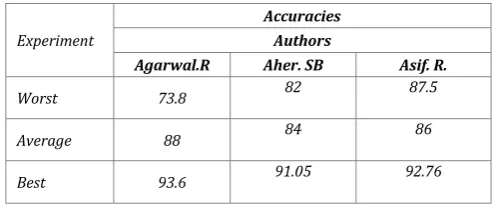
Table 1 - Classification accuracies
Experiment
Accuracies Authors
Agarwal.R Aher. SB Asif. R.
Worst 73.8 82 87.5
Average 88 84 86
Best 93.6 91.05 92.76
Table 2. Observation of efficiency
Experiment K-means Accuracy
Overall Accuracy
worst 75.05 81
average 83.41 89.87
best 90.27 91.3
Fig. 5 - Efficiency versus k-value
CONCLUSION
We would the results in this paper indicate that there are similar students and that performance can be predicted fairly well based on similar users. The students explored in this paper were selected due to their activity in the MATHS family, as it is the most commonly explored family in the dataset. It’s important to note that improvement in this predictor can be made as more data is collected. Since the predictor only finds similarity using the concepts both students have performed in, the more concepts students take the more the data will be filled in, allowing for more accurate similarity calculations between students.
While the k-means clustering didn’t prove to show strong groups of clusters, that doesn’t mean that those clusters don’t exist. In fact the predictor’s performance indicates that there are strong similarities between students and that student performances can be predicted based on past performance on different concepts.
[image:5.595.37.285.409.514.2]© 2016, IRJET | Impact Factor value: 4.45 | ISO 9001:2008 Certified Journal | Page 2208
ACKNOWLEDGEMENT
We would like to thank all faculties of Department of Computer Science and Engineering, Rungta College of Engineering and Technology, Bhilai for their extended guidance and support. Without facilitation of the necessary resources this study was not possible.
REFERENCES
[1] Vikram Singh, Sapna Nagpal, “A guided clustering
technique for knowledge discovery- A case study of Liver Disorder Dataset”, International Journal of Computing and Business research, Vol.1, no.1, Dec2010.[2] Jiawei Han and Micheline Kamber, “Data Mining: Concepts and Techniques”, Second Edition.
[3] D.Hand, “Principles of Data Mining, “Drug safety, vol.3 , pp.6 -622, Jul.2007.
[4] C.K. John Wang, Ni os L.D.on “Achievement goal profiles in school physical education: Differences in self-determination, sport ability beliefs, and physical activity”, ritish Journal of Educational Psychology, Volume 72, Issue 3, pages 433–445, September 2002
[5] SZ Salim, MA Ismail, “K-means-type algorithms: a generalized convergence theorem and characterization of local optimality”, IEEE 1994, Pattern Analysis and Machine Intelligence, IEEE Transactions on (Volume:PAMI-6 , Issue: 1 )
[6] Agrawal, R., & Srikant, R. (1995). Mining sequential patterns. In: Proceedings of the eleventh international conference on data engineering (pp. 3–14).
[7] Aher, S. B., & Lobo, L. (2013). Combination of machine learning algorithms for recommendation of courses in e-learning system based on historical data. Knowledge-Based Systems, 51, 1–14.
[8] Anderberg, M. R. (1973). Cluster analysis for applications. New York: Academic Press.
[9] Asif, R., Merceron, A., & Pathan,M.(2014).Investigating performances‟s progress of students Investigating performances‟s progress of students. In: Proceedings of DeLFI workshops 2014 colocated with 12th e-learning conference of the German Computer Society, Freiburg, Germany (pp. 116–123).
[10] Ayres, J., Gehrke, J., Yiu, T., & Flannick, J. (2002). Sequential pattern mining using a bitmap representation. In: Proceedings of the eighth ACM SIGKDD international conference on knowledge discovery and data mining (pp. 429–435).
[11] Baker, R. S. J. D. (2010). Data mining for education. In B. McGaw, P. Peterson, & E. Baker (Eds.). International encyclopedia of education (3rd ed.) (Vol. 7,pp. 112–118). Oxford, UK: Elsevier.
[12] Baker, R. S. J. D. (2014). Educational data mining: An advance for intelligent systems in education. IEEE Intelligent Systems, 29(3), 78–82.
[13] Baker, R. S. J. D., & Yacef, K. (2009). The state of educational data mining in 2009: A review and future visions. Journal of Educational Data Mining, 1(1), 3–17.
[14] Bian, H. (2011). A preliminary study on clustering student learning data. In: Proceedings of the 22nd midwest artificial intelligence and cognitive science conference, Cincinnati, Ohio, USA (pp. 128–132).
[15] Bogarín, A., Romero, C., Cerezo, R., & Sánchez-Santillán, M. (2014). Clustering for improving educational process mining. In: Proceedings of learning analytics and nowledge conference , LAK‟ , Indianapolis, IN, USA (pp. 11–15).
[16] Bouchet, F., Harley, J. M. ., & Trevors, G. J. (2013). Clustering and profiling students according to their interactions with an intelligent tutoring system fostering self-regulated learning. Journal of Educational Data Mining, 5(2), 104–146.
[17] ydzovs a, H., & Popel ns y , L. . Course recommendation from social data course recommendation from social data. In: Proceedings of CSEDU 2014 – the 6th international conference on computer supported education, Barcelona, Spain (Vol. 1, pp. 268–275).
[18] Campagni, R., Merlini, D., & Sprugnoli, R. (2012). Analyzing paths in a student database. In: Proceedings of EDM 2012, 5th international conference on educational data mining, Chania, Greece (pp. 208–209).
[19] Campagni, R., Merlini, D., & Sprugnoli, R. (2012). Data mining for a student database. In: Proceedings of ICTCS 2012, 13th Italian conference on theoretical computer science, Varese, Italy.
© 2016, IRJET | Impact Factor value: 4.45 | ISO 9001:2008 Certified Journal | Page 2209
ECML-PKDD workshop: Mining and exploiting interpretablelocal patterns (I-Pat 2012), Bristol.
[21] Campagni, R., Merlini, D., & Verri, M. C. (2014). Finding regularities in courses evaluation with K-means clustering. In: Proceedings of CSEDU 2014 – the 6th international conference on computer supported education (Vol. 2, pp. 26–33).
[22] Castro, F., Vellido, A., Nebot, A., & Mugica, F. (2007). Applying data mining techniques to e-learning problems. In Evolution of teaching and learning paradigms in intelligent environment (pp. 183–221). New York: Springer-Verlag.
[23] Clow, D. (2013). MOOCs and the funnel of participation. In: Proceedings of learning analytics and knowledge conference 2013, LAK‟ 3, Leuven, elgium pp. 85–189).
[24] Daimi, K., & Miller, R. (2009). Analyzing student retention with data mining. In:Proceedings of the 2009 international conference on data mining (pp. 55–60).
[25]Damaševicˇius,R.Analysis of academic results for informatics course improvement using association rule mining. In Information systems development (pp. 357–363). Springer.
[26] Delavari, N., Shirazi, M. R. A., & Beikzadeh, M. R. (2004). A new model for using data mining technology in higher educational systems. In: Proceedings of the fifth international conference on information technology based higher education and training.