Hemodialysis increases apparent diffusion
coefficient of brain water in nephrectomized
rats measured by isotropic diffusion-weighted
magnetic resonance imaging.
J P Galons, … , A F Gmitro, Y H Lien
J Clin Invest.
1996;
98(3)
:750-755.
https://doi.org/10.1172/JCI118847
.
The nature of brain edema in dialysis disequilibrium syndrome (DDS) was investigated by
diffusion-weighted magnetic resonance imaging (DWI). DWI was performed on normal or
bilaterally nephrectomized rats before, and immediately after, hemodialysis. Hemodialysis
was performed with a custom-made dialyzer (surface area 150 cm2) against a
bicarbonate-buffered bath for 90 min with or without 70 mM urea. Hemodialysis with non-urea bath
decreased plasma urea by 21 mM, and plasma osmolality by 22 mosmol/kg H2O, and
increased brain water content by 8.0% (all < 0.05), while hemodialysis with urea bath did
not affect plasma urea, osmolality, or brain water content. Three sets of axial DWI images of
the brain were obtained at different gradient weighing factors with an in-plane resolution of
0.39 mm2. The apparent diffusion coefficient (Dapp) of the brain water was not affected by
bilateral nephrectomy, or by hemodialysis in normal rats. In nephrectomized rats, brain
Dapp was significantly increased after dialysis with non-urea bath (1.15 0.08 vs 0.89
+/-0.07 x 10(-9)m2/sec, P < 0.01). No significant changes of brain water Dapp could be
observed after dialysis with urea bath. The increased Dapp associated with DDS indicates
that brain extracellular water increases and/or intracellular water decreases after
hemodialysis. Our results strongly suggest that the brain edema induced by hemodialysis in
uremic rats is due to interstitial edema rather […]
Research Article
Find the latest version:
J. Clin. Invest.
© The American Society for Clinical Investigation, Inc. 0021-9738/96/08/0750/06 $2.00
Volume 98, Number 3, August1996, 750–755
Hemodialysis Increases Apparent Diffusion Coefficient of Brain Water in
Nephrectomized Rats Measured by Isotropic Diffusion-weighted Magnetic
Resonance Imaging
Jean-Philippe Galons,* Ted Trouard,‡ Arthur F. Gmitro,‡ and Yeong-Hau H. Lien*
Departments of *Medicine and ‡Radiology, University of Arizona, Tucson, Arizona 85724
Abstract
The nature of brain edema in dialysis disequilibrium syn-drome (DDS) was investigated by diffusion-weighted mag-netic resonance imaging (DWI). DWI was performed on normal or bilaterally nephrectomized rats before, and im-mediately after, hemodialysis. Hemodialysis was performed
with a custom-made dialyzer (surface area 150 cm2) against
a bicarbonate-buffered bath for 90 min with or without 70 mM urea. Hemodialysis with non-urea bath decreased plasma urea by 21 mM, and plasma osmolality by 22
mos-mol/kg H2O, and increased brain water content by 8.0% (all
P, 0.05), while hemodialysis with urea bath did not affect
plasma urea, osmolality, or brain water content. Three sets of axial DWI images of the brain were obtained at different gradient weighing factors with an in-plane resolution of
0.39 mm2. The apparent diffusion coefficient (D
app) of the
brain water was not affected by bilateral nephrectomy, or by hemodialysis in normal rats. In nephrectomized rats, brain
Dapp was significantly increased after dialysis with non-urea
bath (1.1560.08 vs 0.8960.07 3 1029m2/sec, P, 0.01). No
significant changes of brain water Dapp could be observed
af-ter dialysis with urea bath. The increased Dapp associated
with DDS indicates that brain extracellular water increases and/or intracellular water decreases after hemodialysis. Our results strongly suggest that the brain edema induced by he-modialysis in uremic rats is due to interstitial edema rather than cytotoxic edema. Furthermore, our results support a primary role for the “reverse urea effect” in the pathogene-sis of brain edema in DDS. DWI may be a useful diagnostic
tool for DDS in patients with end-stage renal disease. (J.
Clin. Invest. 1996. 98:750–755.) Key words: nuclear
mag-netic resonance • uremia • brain edema
Introduction
Dialysis disequilibrium syndrome (DDS)1 in patients receiving hemodialysis, as first described by Kennedy et al. (1), has been observed for more than 30 yr. The syndrome may include symptoms such as headache, nausea, emesis, blurring of vision, muscular twitching, disorientation, hypertension, tremors, sei-zures, and coma (2). Up to now, there has been no diagnostic test for DDS and its diagnosis in patients with end-stage renal diseases is mainly based on the exclusion of other possible cen-tral nervous disorders (3). It is clear that most of the clinical manifestations of dialysis syndrome are mainly due to brain swelling occurring as a consequence of the dialysis procedure (2, 4). The nature of brain edema associated with DDS re-mains a controversial issue. It has been classified as a cytotoxic edema by Fishman and Chan (5) and as an osmotic edema by Milhorat (6). Cytotoxic edema results from a disturbance of cell volume regulation sufficient to produce an abnormal in-crease of fluid within the cytoplasm of cells, while an osmotic edema is characterized by an increase in the extracellular space due to an osmotic gradient (5, 6).
Moreover, there have been conflicting studies concerning the physiological mechanisms that lead to the formation the edema in DDS. Pappius et al. introduced the “reverse urea hy-pothesis” postulating that a significant urea gradient between blood and brain after dialysis was responsible for the inflow of water to the brain (4). On the other hand, Arieff concluded that the formation of idiogenic osmoles was responsible for the edema formation (2). The present work using diffusion-weighted magnetic resonance images (DWI) was undertaken to characterize the nature and the mechanisms of formation of brain edema occurring in rats with DDS.
The apparent diffusion coefficient (Dapp) measured by
DWI is sensitive to the hydrodynamic environment of tissue water (7, 8). Several DWI sequences have been developed that enable the measurement of the Dapp of the brain water.
Signifi-cant use of this technique has already been made in the imag-ing and diagnosis of stroke (9–12). Most DWI sequences are based on either a spin echo or a stimulated echo experiment to which diffusion-sensitizing gradients are added. A very useful sequence was introduced recently by Mori and van Zijl (13). This sequence weights image intensity to the trace of the diffu-sion tensor (Dxx1Dyy1Dzz) within a single data acquisition
step. As the trace of the diffusion tensor is invariant upon co-ordinate rotation, the Dapp obtained from this sequence is
in-dependent of patient orientation. This is particularly impor-tant when measuring Dapps in tissue with anisotropic structures
Portions of this work were presented at the 28th meeting of the American Society of Nephrology in San Diego, CA on 5–8 November 1995. Portions of this work have appeared in abstract form (J. Am. Soc. Nephrol. 6:530).
Address correspondence to Yeong-Hau H. Lien, Department of Medicine, Renal Section, University of Arizona Health Sciences Cen-ter, Tucson, AZ 85724. Phone: 520-626-6370; FAX: 520-626-2024; E-mail: [email protected]
Received for publication 6 February 1996 and accepted in revised form 30 May 1996.
1. Abbreviations used in this paper: Dapp, apparent diffusion
such as gray and white matter of the brain. Using this se-quence, we monitored the diffusion of brain water in nephrec-tomized rats before and after hemodialysis and in the presence or absence of urea in the dialysis bath. The results were com-pared with those observed in normal rats after hemodialysis with non-urea bath.
Methods
Animal models. All studies received approval from the University of Arizona Animal Care and Use Committee. Male Sprague-Dawley rats (Holtzmann Co., Madison, WI) weighing z 300 g were used in
the study. Animals were divided into five groups: (a) normal controls; (b) normal rats receiving hemodialysis; (c) uremic rats studied 2 d af-ter bilaaf-teral nephrectomy; (d) uremic rats receiving hemodialysis 2 d after nephrectomy with standard bicarbonate-buffered dialysate; and (e) uremic rats receiving hemodialysis with urea-containing dialysate. Animals in groups c, d, and e underwent bilateral nephrectomy under pentobarbital anesthesia (50 mg/kg i.p.), and groups d and e under-went dialysis and imaging 2 d later. Bicarbonate-buffered dialysate was used for groups b and d, while bicarbonate-buffered dialysate with an addition of urea was used for group e. The groups of normal (a) and nephrectomized (c) rats that did not undergo hemodialysis were used mainly for the measurement of predialysis brain water con-tent, which is otherwise not available in rats undergoing hemodialysis.
Hemodialysis. Rats were hemodialyzed against bicarbonate-buffered bath as described by Silver et al. (14) with minor modifica-tions. The dialysate contained (mM): sodium 142, bicarbonate 35, po-tassium 3, chloride 115, calcium 2, magnesium 0.75, and glucose 11. In the group of dialysis with a urea-containing bath, the dialysate con-tained 70 mM urea, which was approximately the average plasma urea value of uremic rats. We did not adjust urea concentration ac-cording to individual urea levels because the individual difference was not large enough to generate a significant drop of plasma urea level after dialysis (Table I). The dialysate temperature was main-tained at 378C. Hemodialysis using a custom-made cuprophane hol-low-fiber dialyzer (surface area 150 cm2) was performed via a femoral
artery and vein in rats anesthetized with pentobarbital. Catheters (PE50; Becton Dickinson, Inc., Parsippany, NJ) were placed in ves-sels and connected to a dialyzer. Blood and dialysate were circulated
in a counter-current fashion using roller pumps. The dialyzer and ex-tracorporeal circuit was primed with 3 ml blood from normal rats. Heparin was given in a 2,000-U bolus, followed by a 1,000-U/h infu-sion into the arterial line to prevent dialyzer clotting. Dialysate flow rate was 40 ml/min and blood flow 4 ml/min to achieve a rapid clear-ance of urea. During dialysis, blood pressure was monitored with a transducer that was connected to the femoral arterial line. There was no ultrafiltration and the animals were kept at a constant weight. Any significant decrease of blood pressure or body weight was treated with intravenous saline infusion. Dialysis was performed for 90 min. Rats with stable hemodynamics during the hemodialysis procedure were used for the DWI studies. At the end of hemodialysis, 0.5 ml blood was obtained from the arterial line and the rat was discon-nected from the dialysis circuit. The Dapp was then measured using
the isotropic DWI technique. Immediately after DWI, rats were killed by decapitation. The brain was rapidly removed from the skull. A cerebral hemisphere was weighed and dried at 1008C for 24 h, and then reweighed to determine water content (15). Plasma urea level was determined by the urease method (16), and plasma osmolality by freezing-point depression (Micro-osmometer; Advanced Instruments Inc., Needham Heights, MA).
Isotropic diffusion-weighted imaging. For the imaging experi-ments, the rats were anesthetized and placed in a prone position on the nuclear magnetic resonance (NMR) probe. Special care was taken to prevent motion. The head was strongly strapped to the probe or placed in a custom-made head restraint. A teeth holder was added to prevent any motion during the DWI experiment. The 90-min dialysis was performed outside the NMR machine with the rat on the probe. Typically, no more than 5 to 6 min were necessary to start the postdialysis DWI experiments. All images were acquired on a Biospec system (4.7 T/40 cm; Bruker, Karlsruhe, Germany) equipped with an ASPECT 3000 computer running the imaging software (TOMIKON; Bruker). A standard 5 cm, double tuned, single turn
1H/31P surface coil was used as a transmitter and receiver (Bruker).
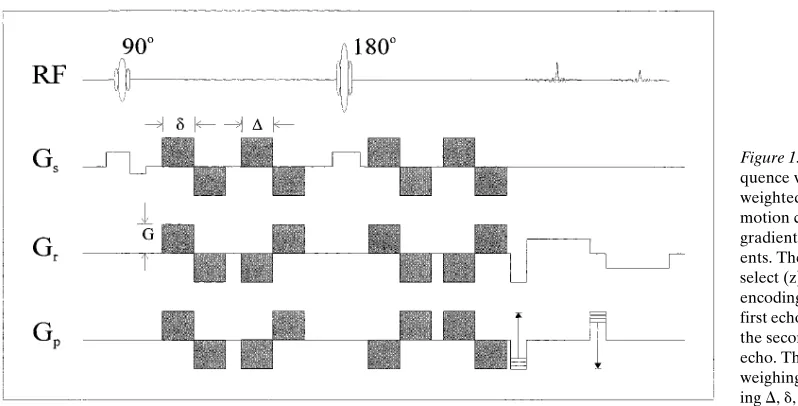
[image:3.612.55.559.505.724.2]The DWI brain images of normal and nephrectomized rats before and after dialysis were obtained with the sequence shown in Fig. 1. Because motion is always a concern in DWI, the acquisition of “navi-gator” echoes was included in the DWI sequence. Navigator echoes allow the postacquisition correction for bulk animal motion (17, 18). The four pairs of bipolar diffusion gradient pulses are shaded in gray in Fig. 1. Before the in vivo experiments, the sequence was calibrated.
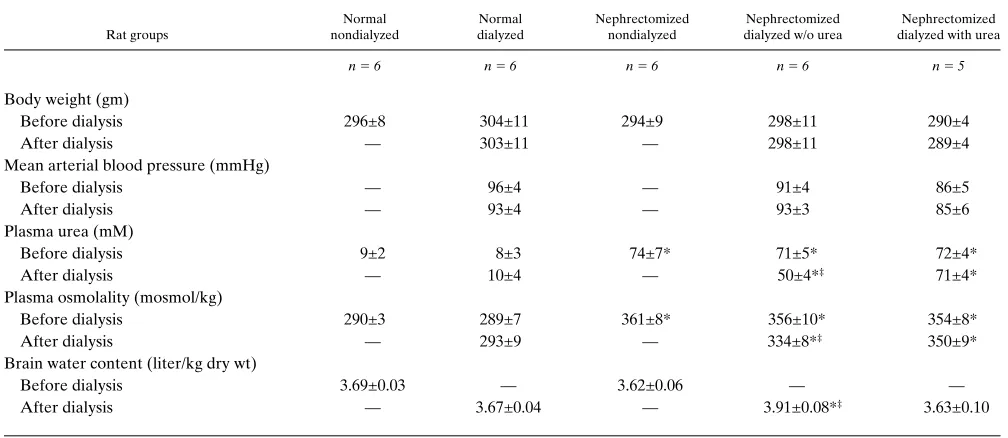
Table I. Physiological and Biochemical Parameters before and after Hemodialysis
Rat groups
Normal nondialyzed
Normal dialyzed
Nephrectomized nondialyzed
Nephrectomized dialyzed w/o urea
Nephrectomized dialyzed with urea
n 56 n 56 n 56 n 56 n 5 5
Body weight (gm)
Before dialysis 296±8 304±11 294±9 298±11 290±4
After dialysis — 303±11 — 298±11 289±4
Mean arterial blood pressure (mmHg)
Before dialysis — 96±4 — 91±4 86±5
After dialysis — 93±4 — 93±3 85±6
Plasma urea (mM)
Before dialysis 9±2 8±3 74±7* 71±5* 72±4*
After dialysis — 10±4 — 50±4*‡ 71±4*
Plasma osmolality (mosmol/kg)
Before dialysis 290±3 289±7 361±8* 356±10* 354±8*
After dialysis — 293±9 — 334±8*‡ 350±9*
Brain water content (liter/kg dry wt)
Before dialysis 3.69±0.03 — 3.62±0.06 — —
After dialysis — 3.67±0.04 — 3.91±0.08*‡ 3.63±0.10
The correct values for the diffusion coefficients of standard samples (water, acetone, and DMSO) were determined.
For each normal or nephrectomized rat, three sets of multislice images were recorded using three different diffusion gradient strengths, both before and after dialysis. The b values for these diffu-sion gradients were 0.009 3 109 s/m2, 0.231 3 109 s/m2, and 0.921 x 10⁹
s/m2, respectively. The images were acquired with an echo time of 96
ms, a repetition time of 0.640 s and four scans. Diffusion time (D) was 10 ms, and diffusion gradient pulse length was 8 ms. The matrix size was 64 3 64 corresponding to an “in plane resolution” of 0.39 mm2,
with a slice thickness of 5 mm. The total scan time was 2.45 min per image set.
Dapps were calculated at each pixel by fitting the intensity values S
to the exponential decay given by Eq. 1,
(1)
where S0 is the pixel intensity without diffusion weighing and Dapp is
the apparent diffusion coefficient. The gradient weighing factor b is defined by
(2)
where g is the gyromagnetic ratio, G is the gradient strength, d is the duration of a diffusion gradient, and D is the time separation between balanced gradient pairs. The factor of 4 in Eq. 2 arises from the four pairs of bipolar gradient pulses in the imaging sequence (Fig. 1). Fit-ting was accomplished using a standard conjugate gradient minimiza-tion routine. The calculated diffusion maps were generated using the program Khoros, (Khoral Research Inc,. Albuquerque, NM), running on a DEC Station-3100 (Digital Equipment Corp., Nashua, NH).
Selection of region of interest. Two regions of 15 to 20 pixels were selected from the left and right sides of the cerebral cortex in the middle slice for calculations of the corresponding Dapp. The first
and third slices were examined to rule out the inclusion of invagina-tion of macroscopic cerebro-spinal fluid (CSF)-containing space. No effort was made to discriminate between gray and white matters due to low resolution. The selection of regions of interest (ROIs) was al-ways performed using the image with the highest contrast (lowest b
value). To verify that no significant CSF space was included in the ROI, a smaller ROI (10 pixels) was selected within the original ROI. If there is a major CSF contamination, because the CSF space in the outer portions of the larger ROIs should be greater than the smaller, the Dappof the larger ROI should be higher than that of the smaller
ROI. We found that Dapp was not different between the larger and
smaller ROIs either before (0.8960.07 vs 0.8660.10 3 1029 m2/s) or
S S0e
2bDapp
=
b 4g2G2d2 D d
3 ---–
=
after (1.1560.08 vs 1.1360.12 3 1029 m2/s) hemodialysis. These
ob-servations confirmed that the original ROIs did not contain the CSF space surrounding the brain.
Statistics. Data are expressed as means6SD. Differences among groups for Dapp values, brain water content, and plasma analyses were
evaluated using ANOVA. The Student’s paired t test was used to as-sess differences among prenephrectomy, predialysis, and postdialysis values within a group. Significance was accepted at the P, 0.05 level.
Results
All rats survived bilateral nephrectomy up to 48 h (n5 21). Since hypoxia may affect brain water Dapp, only rats with
sta-ble blood pressure throughout the dialysis procedure were used for Dapp measurement. 11 out of 21 nephrectomized rats
and 6 out of 7 normal rats that underwent hemodialysis met this criteria and were analyzed. There were no significant changes in both body weight and mean arterial blood pressure after dialysis (Table I). Causes for hemodynamic instability were multifactorial, including anesthesia, blood leakage, and clotting.
Plasma analyses and brain water content. Plasma urea level,
osmolality, and brain water content (means6SEM) in normal and nephrectomized rats with and without hemodialysis are given in Table I. Hemodialysis did not affect plasma urea level or osmolality in normal rats dialyzed with non-urea dialysate, or in nephrectomized rats hemodialyzed with urea-containing dialysate. However, in nephrectomized rats undergoing a dial-ysis with a non-urea bath, plasma urea decreased from 7165 to 5064 mM, and osmolality decreased from 356610 to 33468 mosmol/kg (both P, 0.01). The urea clearance rate was esti-mated to be 1.6 ml/min. For analysis of brain water content, a separate group of normal and nephrectomized rats was used. The brain water content of nephrectomized rats before hemo-dialysis was not significantly different from that of normals rats, while it increased by 8.0% after dialysis in the nephrecto-mized group dialyzed without urea (P, 0.05). In normal rats undergoing hemodialysis and in nephrectomized rats dialyzed with urea, no significant changes were observed in brain water content.
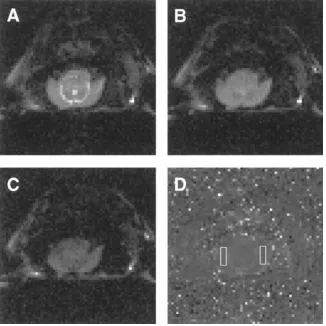
Diffusion-weighted images. Fig. 2 shows a typical set of
[image:4.612.58.457.58.261.2]diffusion-weighted images obtained from a nephrectomized rat after hemodialysis. As the diffusion-weighing increases, the
intensity of the image decreases (Fig. 2, A–C). The larger the diffusion, the more the signal will be attenuated. As an illustra-tion, one can see that the bright signal originating from the CSF within the ventricles in Fig. 2, A–C, is darkened faster than the surrounding tissues from the cerebral cortex. This is due to the higher diffusion of water in CSF, relative to cerebral cortex. The Dapp map with the ROIs indicated by white
rectan-gles is shown in Fig. 2 D. The structural details of the brain seen in Fig. 2 A can also be observed in the diffusion map re-flecting the differences in Dapp. The visual inspection of the
dif-fusion map shows a relative homogeneity of Dapp values in the
brain. In Fig. 2 D, the main contrast arises from the CSF in the horseshoe-shaped region corresponding to the space between
the midbrain and the cerebral hemispheres. The Dapp in CSF is
close to that of pure water at 378C (3.25 3 1029 m2/s, (refer-ences 19, 20). There is a relatively low contrast between gray and white matter as the Dapp for white matter is z 87% of Dapp
for gray matter (12).
The results of brain Dapp measurement before
nephrec-tomy, and before and after hemodialysis performed 2 d after nephrectomy are shown in Table II. Values represent the means and SEM of the Dapp of the selected regions for all rats
in each group. It was found that the Dapp was not affected by
bilateral nephrectomy (0.8960.07 vs 0.8560.09, and 0.8460.07 vs 0.8160.07 3 1029 m2/s, for groups d and group e, respec-tively) or by hemodialysis in normal rats (0.8060.07 vs 0.8460.09 3 1029 m2/sec). In nephrectomized rats, brain D
app
was significantly increased after dialysis with non-urea bath (1.1560.08 vs 0.8960.07 3 1029 m2/s, P, 0.01, group d), while no significant changes could be observed when rats were dia-lyzed with urea-containing dialysate (0.8760.09 vs 0.8460.07
3 1029 m2/s, group e).
Discussion
[image:5.612.58.384.61.387.2]Cerebral edema is responsible for most of the manifestation of dialysis disequilibrium syndrome. This has been confirmed both at autopsy and by computed tomography imaging of the brain in patients with renal failure who have undergone dialy-sis (21, 22). Several animal models of DDS have been devel-oped and brain swelling has been reported in hemodialyzed dogs (4, 23) and rats (14). In this study, we used a DWI ap-proach to investigate both the nature and the mechanisms of
Figure 2. (A–C) DWI of the brain of a ne-phrectomized rat after 90 min of hemodialysis obtained at gradient weighing factors b of 0.009 3 109 s/m2, 0.231 3 109 s/m2, and 0.921 3
109 s/m2, respectively. (D) Apparent diffusion
coefficient map generated by fitting the inten-sity of each pixel to the exponential decay given by Eq. 1. The ROIs are indicated by white rectangles. The rat was placed in a prone position.
Table II. Effect of Hemodialysis on Apparent Diffusion Coefficient in Normal and Nephrectomized Rats
Normal dialyzed w/o urea
n 56
Nephrectomized
Rat Groups
dialyzed w/o urea
n 56
dialyzed with urea
n 55
1029 m2/s
Before nephrectomy — 0.85±0.09 0.81±0.07 Before hemodialysis 0.84±0.09 0.89±0.07 0.84±0.07 After hemodialysis 0.80±0.07 1.15±0.08*‡ 0.87±0.09
Values are means±SEM. *P ,0.01 vs before hemodialysis and before nephrectomy; ‡P ,0.01 vs normal, dialyzed w/o urea, or
[image:5.612.55.298.599.703.2]the formation of the edema occurring in uremic rats undergo-ing hemodialysis. In terms of reduction of plasma urea level and osmolality, and increase of brain water content, our results of hemodialysis on uremic rats are essentially the same as those reported by Silver et al. (14). Recently, Arieff (2) argued that the rat model of hemodialysis could not be used as a model for DDS because the reduction rate of plasma osmolal-ity was slower than that required to induce DDS in the dog. However, our studies confirmed that hemodialysis in uremic rats causes significant brain edema, while the same procedure has no effects on normal rats. This edema could be prevented by dialyzing the nephrectomized rats with a urea-containing bath. It is possible that the different results between the rat and dog are due to species differences. Our studies demon-strate that DWI techniques can be used to measure the changes in Dapp of the brain water in rats undergoing dialysis.
As mentioned before, the nature of brain edema associated with DDS remains largely unknown. It has been classified as an intracellular/cytotoxic edema (5) as well as an extracellular/ osmotic edema (6). A primary mechanism underlying cyto-toxic swelling is an impairment of the energy-dependent Na1/
K1 pump whose normal role is to exclude Na1 and hence
wa-ter from the intracellular compartment (20, 24). A common example of cytotoxic brain swelling can be seen in patients suf-fering from ischemic stroke. The other type of edema, called osmotic edema, is defined as an abnormal increase of water content within the extracellular/interstitial compartment of the brain. It can be generated by an unfavorable osmotic gradient between the plasma and the interstitial or cerebrospinal fluids and, in the case of DDS, it could be generated by urea (6).
Our study, by measuring brain water Dapp, provides
impor-tant information about the nature of edema in DDS. Because the brain contains different compartments of intracellular, ex-tracellular, intravascular, and CSF components, the observed diffusion effect is a superposition of all the involved mobilities. By limiting our analysis to the cortical gray and white matter, it is possible to use a simple bicompartmental model of brain wa-ter where only extracellular and intracellular spaces are con-sidered (12). In this model, the measured Dapp is a
volume-weighted average of the intracellular and extracellular diffu-sion coefficients (Din and Dex, respectively).
(3)
where Vin and Vexrepresent intracellular and extracellular
vol-umes, respectively. While the exact values of intracellular and extracellular diffusion coefficients are not known, values for Din and Dex have been previously estimated (19). Intracellular
water has a low coefficient (in the 0.3–0.4 3 1029 m2/s range), while the extracellular water has a coefficient close to that of pure water (3.0–3.25 3 1029 m2/s at 378C, reference 19). Be-cause of the difference between intra- and extracellular diffu-sion coefficients, DWI is able to discriminate between the two types of edema. Qualitatively, it can be seen that an increase of the extracellular volume (osmotic edema) will correspond to an increase in the Dapp value, while an increase in the
intracel-lular volume (cytotoxic edema) will correspond to a decrease in the measured Dapp. In the case of stroke, it was shown that
the observed decrease in the Dapp of water (10, 11, 25)
corre-sponded quantitatively with the known changes in relative in-tra- and extracellular volumes (12, 26). To calculate the
rela-Dapp VinDin+VexDex Vin+Vex
---=
tive contribution of the fractional volume of extra- and intracellular space using Eq. 3, we used estimated values 0.35
3 1029 m2/s for D
in, and 3.25 3 1029 m2/s for Dex (19). With
these parameters, we found that the Dapp observed for the
nor-mal (group a) and uremic (group d) rats correspond to a frac-tional extracellular volume of about 1763% and 1963%, re-spectively. The fact that there were no differences in brain water content and Dapp between normal and uremic rats is
ex-pected as brain edema has never been observed in uremic ani-mals (14, 27) or humans (28). In the same manner, we calcu-lated that the 29% increase in the Dapp value observed in rats
dialyzed in the absence of urea (1.1560.08 vs 0.8960.07 1029 m2/s) would correspond to an increase of
z 47% of the
frac-tional extracellular volume within the selected regions (from 19 to 28%). This increase in extracellular water could be par-tially accounted for by the observed 8.0% increase of the total brain water. Because Din and Dex are only estimated values,
these calculations are speculative. However, the combination of the two results (i.e., the increase of Dapp and the increase in
the total brain water content) strongly suggest that the incom-ing water is accumulatincom-ing in the extracellular compartment. The increase of extracellular space could be driven by an in-crease in CSF volume due to an initial gradient in osmolarity between plasma and CSF after hemodialysis (1, 4). The fact that Dapp was found to increase strongly argues against a
cyto-toxic type of edema in DDS, which has been shown to be asso-ciated with a decrease in the Dapp due to an
intracellular–extra-cellular volume shift (12). Moreover, cytotoxic edemas are known to be correlated with an accumulation of lactate charac-teristic of hypoxic/ischemic conditions. Such conditions have not been reported in animals treated with rapid dialysis (23, 29).
The physiological mechanisms leading to the formation of brain edema due to DDS have been the object of conflicting reports. It was first attributed to a gradient in the urea content between plasma and brain occurring during acute hemodialy-sis due to a faster removal of plasma urea than brain urea. The “reverse urea effect” introduced by Pappius et al. (4) was sup-ported by several other laboratories reporting higher urea con-centrations in the CSF than plasma (1, 30). Moreover, DDS could be partially corrected by maintaining plasma osmolality during dialysis by adding urea (31) or mannitol (32), or by in-creasing sodium concentration of the dialysate (33). In con-trast, Arieff et al., reported a predominant role for the brain intracellular pH in the pathogenesis of DDS. Based on the ob-servation that rapid dialysis induced a fall in the pH of CSF and the gray matter in animals with renal failure (29), they sug-gested that the formation of idiogenic osmoles associated with an increased H1 activity was responsible for the edema
forma-tion (2, 29). Recently, Silver et al. (14) reported that, in uremic rats dialyzed without urea, there was a 53% decrease in plasma urea, but only a 13% decrease in brain urea. The retention of urea in the brain could account for the increased water con-tent. When uremic rats were dialyzed with urea, there were no changes in either plasma or brain urea contents, and there was no brain edema. We used the similar hemodialysis protocol and confirmed that urea bath essentially prevented brain edema from occurring and was associated with no changes in brain water Dapp. Therefore, our results support a major role
for the “reverse urea hypothesis” in the pathogenesis of cere-bral edema in DDS.
cor-tex along with an increase in the brain water content. These findings are consistent with an increase in the extracellular wa-ter that characwa-terizes an inwa-terstitial edema of the brain. These changes were not observed when the nephrectomized rats were dialyzed with urea-containing dialysate, suggesting that DDS is due to a reverse urea gradient. Up to now, DDS in end-stage renal disease patients is diagnosed by exclusion of other possible central nervous abnormalities (3). The DWI technique described here could potentially be used for clinical diagnosis of DDS and would enhance our understanding of pathogenesis of DDS in the end-stage renal disease patients.
Acknowledgments
The authors thank Ms. Bethany Skovan for her expert technical assis-tance.
This work was supported by the National Institutes of Health re-search grant DK-45666 and a grant from the Southern Arizona Foun-dation (both to Y.H. Lien).
References
1. Kennedy, A.C., A.L. Linton, and J.C. Eaton. 1962. Urea levels in cere-brospinal fluid after hemodialysis. Lancet. i:410–411.
2. Arieff, A.I. 1994. Dialysis disequilibrium syndrome: current concepts on pathogenesis and prevention. Kidney Int. 45:629–635.
3. Mahoney, C.A., and A.I. Arieff. 1982. Uremic encephalopathies: clinical, biochemical and experimental features. American Journal of Kidney Disease. 2: 324–336.
4. Pappius, H.M., J.H. Oh, and J.B. Dossetor. 1967. The effects of rapid he-modialysis on brain tissues and cerebrospinal fluid of dogs. Can. J. Physiol. Pharmacol. 45:129–147.
5. Fishman, R.A., and P.H. Chan. 1980. Metabolic basis of brain edema. In
Advances in Neurology. Vol. 28, Brain Edema. J. Cervos-Navarro and R. Ferszt, editors. Raven Press, New York. 207–215.
6. Milhorat, T.H. 1987. Classification of brain swelling and edemas. In Cere-brospinal Fluid and the Brain Edemas. T.H. Milhorat, editor. Neuroscience So-ciety of New York, NY. 75–100.
7. Le Bihan, D., R. Turner, and C.T.W. Moonen. 1991. Imaging of diffusion and microcirculation with gradient sensitization: design, strategy and signifi-cance. J. Magn. Reson. Imaging. 1:7–28.
8. Le Bihan, D., E. Breton, D. Lallemand, P. Grenier, E. Cabanis, and M. Laval-Jeantet. 1986. MR imaging of intravoxel incoherent motions: application to diffusion and perfusion in neurologic disorders. Radiology. 161:401–407.
9. Warach, S., J. Gaa, B. Siewert, P. Wielopolski, and R.R. Edelman. 1995. Acute human stroke studied by whole brain echo planar diffusion-weighted magnetic resonance imaging. Ann. Neurol. 37:231–241.
10. Moseley, M.E., J. Kucharczyk, J. Mintorovitch, Y. Cohen, J. Kur-hanewicz, N. Derugin, H. Asgari, and D. Norman. 1990. Diffusion weighted MR imaging of acute stroke: correlation with T2-weighted and magnetic sus-ceptibility-enhanced MR imaging in cats. Am. J. Neuroradiol. 11:423–429.
11. Moseley, M.E., Y. Cohen, J. Mintorovitch, L. Chileuitt, H. Shimizu, J. Kucharczyk, M.F. Wendland, and P.R. Weinstein. 1990. Early detection of re-gional cerebral ischemia in cats: comparison of diffusion- and T2-weighted MRI and spectroscopy. Magn. Reson. Med. 14:330–346.
12. Van Gelderen, P., M.H.M. de Vleeschouwer, D. Despres, J. Pekar, P.C.M. van Zijl, and C.T.W. Moonen. 1994. Water diffusion and acute stroke. Magn. Reson. Med. 31:154–163.
13. Mori, S., and P.C.M. van Zijl. 1995. Diffusion weighing by the trace of the diffusion tensor within a single scan. Magn. Reson. Med. 33:41–52.
14. Silver, S.M., J.A. DeSimone, D.A. Smith, and R.H. Sterns. 1992. Dialy-sis disequilibrium syndrome (DDS) in the rat: role of the reverse urea effect.
Kidney Int. 42:161–166.
15. Lien, Y.H., J.I. Shapiro, and L. Chan. 1990. Effects of hypernatremia on organic brain osmoles. J. Clin. Invest. 85:1427–1435.
16. Bernt, E., and H.U. Bergmeyer. 1965. Urea. In Methods in Enzymatic Analysis. H.U. Bergmeyer, editor. Academic Press, Inc., New York. 401–406.
17. Ordidge, R.J., J.A. Helpern, Z.X. Qing, R.A. Knight, and V. Nagesh. 1994. Correction of motional artifacts in diffusion-weighted MR images using navigator echoes. Magn. Reson. Imaging. 12:445–460.
18. Anderson, A.W., and J.C. Gore. 1994. Analysis and correction of mo-tion artifacts in diffusion weighted imaging. Magn. Reson. Med. 32:379–387.
19. Van Zijl, P.C.M., D. Davis, and C.T.W. Moonen. 1994. Diffusion spec-troscopy in living system. In NMR in Physiology and Biomedicine. R.J. Gillies, editor. Academic Press, Inc., San Diego, CA. 185–198.
20. Benveniste, H., L.W. Hedlund, and G.A. Johnson. 1992. Mechanism of detection of acute cerebral ischemia in rats by diffusion-weighted magnetic res-onance microscopy. Stroke. 23:746–754.
21. La Greca, G., S. Biasioli, S. Chiaramonte, P. Dettori, A. Fabris, M. Feri-ani, V. Pinna, E. PisFeri-ani, and C. Ronco. 1982. Studies on brain density in hemo-dialysis and peritoneal hemo-dialysis. Nephron. 31:146–150.
22. Peterson, H.D. 1964. Acute encephalopathy occurring during hemodial-ysis. Arch. Intern. Med. 113:887–890.
23. Arieff, A.I., S.G. Massry, A. Barrientos, and C.R. Kleeman. 1973. Brain water and electrolyte metabolism in uremia: effects of slow and rapid dialysis hemodialysis. Kidney Int. 4:177–187.
24. Djuricic, B.M., D.V. Micic, and B.B. Mrsulja. 1984. Phase recognition of edema cause by ischemia. In Recent Progress in the Study and Therapy of Brain Edema. K.G. Go and A. Baethman, editors. Plenum Publishing Corp., New York. 491–498.
25. Minematsu, K., L. Li, M. Fisher, C.H. Sotak, M.A. Davis, and M.S. Fian-daca. 1992. Diffusion-weighted magnetic resonance imaging: rapid and quanti-tative detection of focal brain ischemia. Neurology. 42:235–240.
26. Latour, L.L., K. Svoboda, P. Mitra, and C.H. Sotak. 1994. Time-depen-dent diffusion of water in a biological model system. Proc. Natl. Acad. Sci. USA.
91:1229–1233.
27. Mahoney, C.A., A.I. Arieff, W.J. Leach, and V.C. Lazarowitz. 1983. Central and peripheral nervous system effects of chronic renal failure. Kidney Int. 24:170–177.
28. Basile, C., J.D. Miller, Z.J. Koles, and M. Grace. 1987. The effects on brain water and EEG in stable chronic uremia. American Journal of Kidney Disease. 9:462–469.
29. Arieff, A.I., R. Guisado, S.G. Massry, and V.C. Lazarowitz. 1976. Cen-tral nervous system pH in uremia and the effects of hemodialysis. J. Clin. Invest.
58:306–311.
30. Rosen, S.M., K. O’Connor, and S. Shaldon. 1964. Hemodialysis disequi-librium. Br. Med. J. 2:672–675.
31. Kennedy, A.C., A.L. Linton, R.G. Luke, S. Renfrew, and A. Din-woodie. 1964. The pathogenesis and prevention of cerebral disfunction during dialysis. Lancet. i:790–793.
32. Rodrigo, F., J. Shideman, R. McHugh, T. Buselmeier, and C. Kjell-strand. 1977. Osmolality changes during hemodialysis. Natural history, clinical correlations, and influence of dialysate glucose and intravenous mannitol. Ann. Intern. Med. 86:554–561.
33. Port, F.K., W.J. Johnson. and D.W. Klass. 1973. Prevention of dialysis disequilibrium syndrome by use of high sodium concentration in the dialysate.