© 2015, IRJET.NET- All Rights Reserved Page 1402
CONSTRUCTION BUILDING SCHEDULE RISK ANALYSIS USING
MONTE-CARLO SIMULATION
Pratik Ganame
1, Pravin Chaudhari
21
MTECH student, Civil and Environmental Engineering Dept., VJTI, Maharashtra, India
2Assistant Professor, Civil and Environmental Engineering Dept., VJTI, Maharashtra, India
---***---Abstract -
Construction Industry is one of thebooming industries of today that has a great impact on the economy of any nation. Large construction projects if delayed can cause increase overall cost of the project. Hence risks and uncertainties must be considered for
overall duration of the project. To organize and
complete your projects in a timely, quality and financially responsible manner, you need to schedule projects carefully. Effective project scheduling plays a
crucial role in ensuring project success. This study
focusses on risk identification, qualitative analysis and quantitative analysis. The objectives are to identify the key risk factors that affect the project schedule, and to determine the probability of completing the project within due date. Questionnaire forms were distributed among 31 industry practitioners with varying experience from 1 year to 17 years. Qualitative analysis is done by probability impact (PI) matrix. And quantitative analysis is done by PERT and Monte Carlo simulation. @RISK by Palisade corp. is used for Monte Carlo simulation.
Key Words:
Construction project, Schedule risks,
PERT, Monte Carlo simulation, PI matrix
1. INTRODUCTION
Any construction project is expected to be completed within certain period of time. And if the project gets delayed it results in increase in cost of the project and contractor may have to face penalty for causing delay. Hence it is very important for both owner and contractor to follow project schedule.
Scheduling is an important part of the construction project management. Planning and scheduling of construction activities helps engineers to complete the project in time and within the budget. But construction activities possess uncertainties that may cause delay in performing certain activities or even increase in cost of the project. Hence it is very important to develop a risk management process
which deals with the risks in execution that affects the project schedule.
This study on risk management in construction schedule aims to identify key factors that causes delay in completion of certain activity, which if not attended may occur again and cause difficulties in completion of project and provide solution against those risk factors.
2. LITERRATURE REVIEW
Risk can be defined as an uncertain event or condition that when occurs affects one or more objectives of the project such as scope, time, cost, objective. Risk may have one or more causes and if it occurs it may have one or more impacts (PMBOK guide 6th edition). (Smith et al ,1999) defined following parameters that are associated with risk,
Higher costs.
Extension of the project.
Failure to satisfy specified quality requirements. Failure to satisfy specified information
requirements.
Failure to satisfy specified organizational requirements.
Dynamic risks are the risks where risk takers are concerned about making opportunities. Dynamic risk means that there will be potential gains as well as losses. Dynamic risk is risking the loss of something certain for gain of something uncertain.
Static risks are the risks where people are concerned with potential losses and ways to minimize the losses. The unsystematic management of risks can affect the scope and success of the project since most risks are very dynamic throughout the project lifetime. (Flanagan & Norman, 1993)
© 2015, IRJET.NET- All Rights Reserved Page 1403
Efficiency of risk management can be magnified by continuously developing RM process throughout the project. By this way risks will be identified and managed throughout project. The benefits from RM are not only reserved for the project itself, but also for the actors involved. The main incentives are clear understanding and awareness of potential risks in the project. Another benefit of risk management is increased level of control over the project and efficient problem solving. (Gajewska et al ,2011)
Although risk management is very efficient process there are limits in using RM process. The level of the risks are always bigger in bigger projects. Several other factors can stimulate risk occurrence. Even if all the potential risks are identified there may be several other risk that can occur during the project. Hence the project management team should not only focus on identified risks but also be alert for new risks that may occur. (Gajewska et al ,2011).
According to (Flanagan & Norman, 1993) Risk management process consists of following components,
Risk identification- Identify the source and type of risks.
Risk classification- Consider the type of risk and its effect on the person or an organization.
Risk analysis- Evaluate the consequences associated with the type of risk or combination of risks by using analytical techniques.
Risk attitude- Any decision about risk will be affected by the attitude of the person or organization making the decision
Risk response- Consider how the risk should be managed by either transferring it to another party or retaining it.
3.METHODOLOGY
1.Risk identification: Risk identification Level in characteristics (Flanagan & Norman, 1993) was followed for risk identification at the site. A team of experts were formed including both contractor’s and owner’s site engineers, sub-contractor. And few workers were interviewed.
2.Risk classification: After the risks were identified and listed out along with their possible effects, they were further classified on the basis of their source and effect on project.
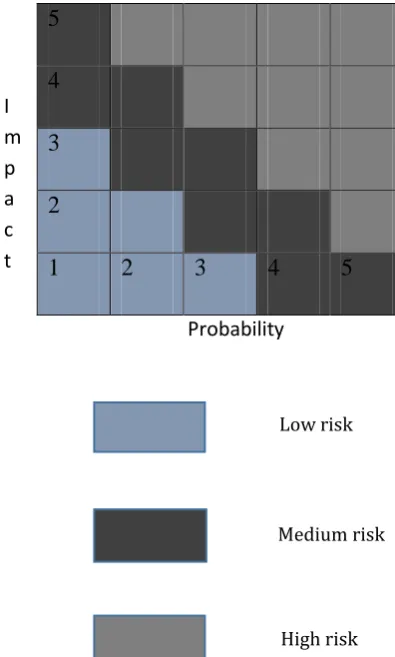
3.Qualitative Risk analysis: Here probability assessment means likelihood of occurrence of a risk and impact assessment deals with impact of the particular risk on project objective such as time, cost, scope. For performing probability-impact analysis, identified risk were listed along with its effect on project in a tabular form. Team of respondents was formed including site engineers from both owner and contractor’s side and few members of
signing authority. They were asked to grade identified risks in terms of probability and impact by grading them from 1 to 5.
Following diagram represents intensity of risk according the grading system
5
4
3
2
1
2
3
4
5
[image:2.595.349.547.170.499.2]
Figure 1. Probability-Impact matrix
4.Quantitative analysis: A network diagram for the hostel building is constructed using the estimated durations of the activities. The expected duration for each activity is estimated using three-point estimation; optimistic, most likely, and pessimistic. The estimated duration for each activity depends on the types of risks, as shown table 1,
Probability
I
m
p
a
c
t
Low risk
Medium risk
© 2015, IRJET.NET- All Rights Reserved Page 1404 Table 1 Estimation of optimistic and pessimistic duration
Risk
Type
Estimation Duration
Optimistic Pessimistic
Low risk -5% +20%
Medium risk -15% +50%
High risk -20% +100%
Next, a schedule risk analysis is performed using Monte Carlo simulation with @Risk software. Firstly all the three durations (optimistic, most likely and pessimistic) are entered in the software . Then probability distribution is assessed (uniform, triangular, normal or other). Generally triangular distribution is preferred when data submitted is judgmental in nature. Ten thousand iterations had to be performed to predict the completion time.
4. RESULT AND DISCUSSION
Qualitative analysis is used to priotarise risks according to their severity so that the risks can be further subjected to quantitative analysis. Following table shows the result of qualitative analysis. After calculation of optimistic and pessimistic time, all the three durations are inserted in software. An output is defined and beta simulation is run at 10000 iterations. Following table shows calculation of durations by Monte-Carlo simulation.
Activity
Optimis tic Time
Most likely time
Pessimis tic Time
Simulat ed time
Foundation 27 days 28 days 33 days 30
Plinth 33 days 34 days 52 days 43 Ground
Floor Work 23 days 23 days 32 days 28 1st floor 49 days 55 days 70 days 60
2nd Floor 47 days 53 days 75 days 61 3rd Floor 48 days 54 days 87 days 68
4th Floor 48 days 53 days 74 days 61
5th floor 49 days 55 days 77 days 63 6th floor 49 days 55 days 77 days 63
7th Floor 71 days 81 days 119 days 95 Above 7th
floor 84 days 99 days 124 days 104 Completion
of project 264 282 319 292
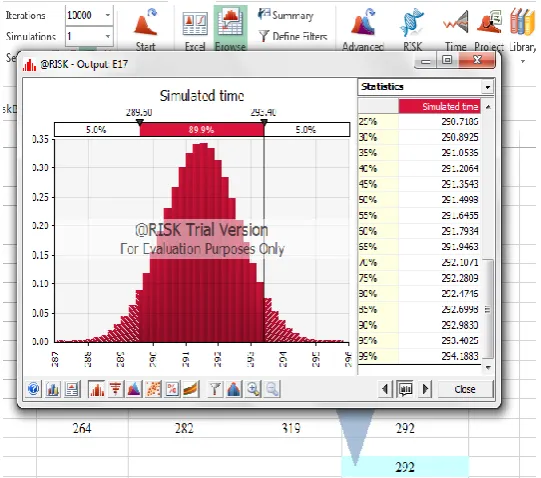
[image:3.595.307.578.219.458.2]Above table shows that the minimum completion time of project is 264 days and maximum time is 319. After Monte-Carlo simulation the completion time is 292days taking account of various identified risks.
Figure 2 shows descriptive graph and frequency statistics, the mean completion time of project is 292 days with 10000 trials. The minimum and maximum completion times are 288 days and 294 days respectively. Cumulative frequency graph is shown in Figure 3
[image:3.595.34.573.497.771.2]Figure 2 Frequency graph with descriptive statistics
© 2015, IRJET.NET- All Rights Reserved Page 1405 Table3 shows that percentage of completion of
[image:4.595.30.296.186.533.2]construction project for various durations. The results clearly show that it is extremely unlikely to complete the project within 282 days (0%). Moreover, there is 100% chance that the project will be completed in 294 days
Table 3 Percentage of completion of project
1%
288.8109
55%
291.6455
5%
289.5967
60%
291.7934
10%
290.0163
65%
291.9463
15%
290.2997
70%
292.1071
20%
290.5251
75%
292.2809
25%
290.7186
80%
292.4746
30%
290.8925
85%
292.6998
35%
291.0536
90%
292.9830
40%
291.2064
95%
293.4025
45%
291.3543
99%
294.1883
50%
291.4998
5. SUMMARY
This study develops the methodology for schedule risk analysis of a building construction. The hostel building construction project was analyzed to identify the risks that affect the project completion time, and also to determine the probability of completing the project within the due date. By qualitative and quantitative analysis with the help of tools such as PERT analysis and Monte-Carlo simulation. Risks were identified by both literature review and by interviewing site personals. Any factor which delays a certain activity is considered as a risk. Then by help of PI matrix severity of risks was decided. For PI matrix total 31 experts were interviewed. Further analysis gave the simulated completion time within which project should have been completed. i.e. project started on 01/02/2011 and it should have been completed on or before 09/03/2012.
6. CONCLUSION
For the probability of completing the Hostel building within the due date, the simulation using @RISK software had shown that there is zero probability for the project to be completed within 282 days (most likely duration). This shows that the due date based on most likely durations that had been used by the construction management team was not significant in an uncertainty environment; it is unlikely to be achieved. The uncertainties lead the project management to risks and problems. The construction schedule should be revised regularly, and the changes of due date may occur repeatedly.
REFERENCES
1 Abbasi et al, "RISK ANALYSIS FOR THE MAJOR FACTORS AFFECTING THE CONSTRUCTION INDUSTRY IN JORDAN", Emirates Journal for Engineering Research, 10 (1), 41-47 (2005)
2 "A Guide to the Project MAnAGeMent Body of KnowledGe, (PMBOK® Guide) – sixth Edition, (2006) 3 Adnan Enshassi and Jaser Abu Mosa, " Risk
Management in Building Projects: Owners’ Perspective", The Islamic University Journal (Series of Natural Studies and Engineering) Vol.16, No. 1, pp
95-123, 2008, ISSN 1726-6807,
http://www.iugaza.edu.ps/ara/resear
4 Bon and Crosthwaite, " The Future of International Construction", (2001)
5 Chapman and Ward," Project Risk Management", ISBN 0-470-85355-7 (1997)
6 construction Industry Development Council India (Cidc) , " Indian Construction Industry", 13th AsiaConstruct (2007)
7 David T. Hulett, "Practical Schedule Risk Analysis", (2005)
9 Enhassi and Mousa, "Risk Management in Construction Projects from Contractors and Owners" perspectives", The Islamic University Journal (Series of Natural Studies and Engineering) Vol.16, No. 1, pp
95-123, 2008, ISSN 1726-6807,
http://www.iugaza.edu.ps/ar
10 Firmansyah Et Al, "Risk Analysis In Feasibility Study Of Building Construction Project: Case Study - Pt. Perusahaan Gas Negara Indonesia", The Tenth East Asia-Pacific Conference on Structural Engineering
and Construction
August 3-5, 2006, Bangkok, Thailand
11 Flanagan and Norman, " Risk Management And Construction", (1999)
12 Gajewska and Ropel,"Risk Management Practices in a Construction Project – a case study", (2011)
© 2015, IRJET.NET- All Rights Reserved Page 1406 Management (IJABM) Vol1, No1, ISSN 2289-3717,
(2013)
14 Moavenzadeh et al, "THE CONSTRUCTION INDUSTRY IN DEVELOPING COUNTRIES" TECHNOLOGY
ADAPTATION PROGRAM
Massachusetts Institute of Technology Spring, (1975) 15 PricewaterhouseCoopers (pwc). " India under construction perspective on building products", Construct India 2014, (2014)
16 Slattery and Bodapati," Risk Management Of Construction- A Graduate Course", ASC proceedings of 13th annual conference, University of Denver, pp 95-100 (2001)
17 Turner and Townsend, " International Construction cost survey ", (2013)
18 WALEWSKI and GIBSON, "International Project Risk Assessment: Methods, Procedures, and Critical Factors" , CENTER CONSTRUCTION INDUSTRY STUDIES REPORT NO. 31 The University of Texas at Austin (2003)
19 Wang et al, "Risk Analysis of Construction Schedule Based on Monte Carlo Simulation", Natural Science
Foundation of Hubei