Microcalcification Detection in Mamography Images
Using 2D Wavelet Coefficients Histogram
Ebrahim Jelvehfard
1,*, Karim Faez
2, Afsane Laluie
31Department of Computer Engineering, Qazvin Branch, Islamic Azad University, Qazvin, Iran 2Electrical Engineering Department, Amirkabir University of Technology, Tehran, Iran 3Department of Gynecology, Baqiyatallah University of Medical Science, Tehran, Iran
*Corresponding Author: [email protected]
Copyright © 2013 Horizon Research Publishing All rights reserved.
Abstract
Breast Cancer is one of the most common illnesses in recent years. Diagnosing cancer at early stages can have a considerable effect on the therapy, so that many several attempts have been made for diagnosing this illness at its first stage recently. Mammography imaging is the most commonly used technique to detect breast cancer before appearing the clinical symptoms. Extracting features which facilitate cancer symptoms detection without significant decrease in sensitivity, minimizes false positives and is of great importance. Microcalcification is an important indicator of cancer. In this research a new method for detecting microcalcifications in mammography is presented. Due to the ability of wavelet transform in image decomposition and detaching details, it can be used to expose this symptom in mammograms. In this work, a two dimensional wavelet transform is performed for feature extraction; and these features are used to diagnose cancer symptoms in mammography images. After the feature extraction step, classification is done using Support Vector Machine (SVM). In the performed evaluation, Regions of Interest (ROIs) with different dimensions have been used as input data and the results show that the proposed feature extraction method can have a significant impact in improving the performance of detection systems.Keywords
Breast Cancer, Mammography,Microcalcification, Feature Extraction, Wavelet Transform, Support Vector Machine, ROI
1. Introduction
Cancer is a threat to human life for many years and it is also expected to be the main reason of mortality in the next decades. Through all known cancers, breast cancer is the most widespread one among women. According to the statistics this illness has been the main reason of early death in women for 50 years and its prevalence has been raised recently as assessments expose, one woman who is born
nowadays will get the disease in the population of 8 women [1]. There is no way to prevent breast cancer because the main reason is still unknown.
Using Computer-Aided Detection (CAD) and Computer-Aided Diagnosis (CADx) systems by radiologists can have a significant role in early detection of breast cancer and leads to reduction in mortality rate. Researchers take several insights about cancer detection and diagnosis systems into account, including high accuracy algorithms for mass and microcalcification detection and detecting architectural distortion and bilateral asymmetry [2].
There are several imaging techniques to evaluate breast cancer presence, including Magnetic Resonance Imaging (MRI), Ultrasound Imaging, and X-ray Imaging. Mammography is a special kind of imaging in where weak X-ray system is used and is the most effective way to detect this illness before its clinical obviousness [3]. One of difficulties to use mammography is low contrast of these images and it leads to difficult assessment for radiologists. Studies show that mammography has high rate of false prognoses [4]. As a result women without cancer will suffer from more clinical assessments or biopsy, and cancerous ones will lose the precious time for treatment. CAD is defined as the second eye of radiologists and assists them to interpret mammography images. CAD systems can increase the detection rate at early stages.
related pixels and grouping them as separate MCs. (2) Extracting some features from these objects for identifying MCs [8,9]. In comparison to ROI-based methods, object-based methods use adaptive-sized ROIs which depend on MC size.
One of the most important parts in designing a CAD system that should be seriously taken into account is selecting appropriate features. These features must be able to describe the difference between normal and abnormal tissues. Among all feature extraction methods for microcalcification detection like statistical, model-based, and signal processing methods, ones using wavelet transform have been taken into consideration recently. Wavelet transform creates an effective representation from the image. In recent years several methods have been proposed for analyzing mammography images using wavelet [10]. Among different feature extraction methods including contourlet, Principle Component Analysis (PCA) and wavelet, wavelet coefficients showed the best performance [11]. In a similar work, 2-D wavelet coefficients from daubechies3 (db3) were used as required features and thresholding was performed to eliminate some coefficients [12]. In another method, wavelet transform on some mammography ROIs with size of 32Х32 pixels was employed and after obtaining coefficients, statistical features from them and texture features from ROI were used [13]. Selecting an appropriate wavelet function for a special task is always challenging. In the proposed method we are going to present a CAD system for detecting microcalcification in different sized ROIs from mammography. Different wavelet functions in the proposed algorithm are used for achieving the best result. Unlike other methods which only use wavelet coefficients, this method is stable to transition and selecting ROI. In section 2, wavelet transform, its different types, support vector machine and the proposed algorithm is described. Section 3 expresses the results applying this method on mammograms and finally discussion and conclusion will be presented.
2. Materials and Methods
In this section a CAD system for detecting microclacification in ROIs with different sizes from mammography images is proposed. For achieving the best performance different wavelet functions in the feature extraction step is employed. First, the wavelet transform and support vector machine are described, then the proposed algorithm is presented.
2.1. Wavelet Transform
Wavelet transform represents an image as a set of wavelet functions with different locations and scales. Each image decomposition consists ofa pair of wave form which one of them represents high frequencies relating to details
of an image (wavelet function) and another represents low frequencies or smooth parts of the image(scale function). The result of wavelet transform is a group of coefficients which determine the contribution of wavelet in these locations and scales [14]. Wavelet transform decomposes the image into images with different resolutions. Resolution is determined by a threshold in which details are ignored, and the difference between two different resolutions shows the detail. Hence an image can be represented by an image with low resolution (approximate or middle extent) and details toward the higher resolution.
2.1.1. 1-D Wavelet Transform
Assuming a 1-D function f(x), in j resolution the approximation of the function is fj(x) and in higher resolution(j+1) it is fj+1(x). Available details in fj+1(x) is shown with dj(x).
( )
( )
( )
1
f
j
+
x f x d x
=
j
+
j
(1)This process can be repeated several times and the original function which is in n resolution is like (2):
( ) ( ) n ( ) f x f xj d xk
k j
= + ∑
= (2) Similarly, the space containing all square integrable functions (V∞=L2) can be assumed like a collection of sub
functions of scale (V j), and wavelet(W j) as the approximate of f(x) with j resolution (f xj( )) is in V j and the details is in W j. V j and W j are described as the translate and dilate of scale functions
(
φ
)
and wavelet functions(
ѱ
)
. Scale sub space V j must exist in all sub spaces with higher resolution(V Vj⊂ +j 1). Wavelet subspaces W j fills the gapbetween two consecutive scale spaces [14].
1
V
j
+
= ⊕
V W
j
j
(3) From (1) and (3) we get f Vj∈ j and d Wj∈ jwhere:( )
( )
f x
j
v
jk jk
x
k
ϕ
=∑
(4)( ) ( )
d xj wjk jk x
k
ψ
=∑ (5)
In (4) and (5) w jk and v jk are coefficients in j resolution. Scale and wavelet functions under translate k and dilate j are described below [15]:
/2
( ) 2x j (2jx k) jk
ϕ = ϕ − (6)
/2
( ) 2x j (2jx k) jk
ψ = ψ − (7)
Figure 1. Procedure of signal(1-D function) decomposition in vn+1 space
[15]
2.1.2. 2-D Wavelet Transform
Discrete wavelet transform (DWT) for an image as a 2-D signal can be derived from 1-D wavelet transform. The easiest way to get the 2-D scale and wavelet function is multiplying two 1-D functions [17]. The 2-D scale function is achieved by multiplying two scale functions as below:
( , ) ( ) ( )x y x y
ϕ =ϕ ϕ (8) 2-D wavelet functions are accomplished by multiplying two wavelet functions or scale and wavelet functions. There are three wavelet functions which describe the details in horizontal, vertical and diagonal directions respectively:
( )( , ) ( ) ( )x y x y
ψ Ι =ϕ ψ (9)
( )( , ) ( ) ( )x y x y
ψ ΙΙ =ψ ϕ (10)
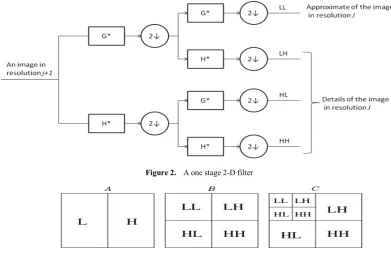
( )( , ) ( ) ( )x y x y
ψ ΙΙΙ =ψ ψ (11) An image is decomposed into four bands using these filters in one stage. Three images are horizontal (HL), vertical (LH) and diagonal (HH) which represent the details in each resolution (Figure 2). This process can be repeated
on the approximate part of the image (LL) (Figure 3).
2.2. Support Vector Machine
It is shown in [18] that the methods which use support vector machine (SVM) for detecting microcalcifications outperform almost all other available methods. In SVM the goal is to find a hyperplane which has the ability to separate the samples. Assuming bigger margin or bigger space between these hyperplanes gives better generalization, we always try to maximize this margin. First, training vectors are mapped into a space with higher dimensions by a kernel function, and then the support vector machine finds a linear hyperplane with the most separability in this space [19].
In this work for showing the separability of the extracted features, support vector machine in MATLAB software is used. The input of support vector machine is a matrix from these features and their corresponding category.
2.3. Proposed Algorithm
In this section the proposed algorithm is presented. In Figure 4 a view of a CAD system is shown. Mini-MIAS digital database of mammography images [20] is used for analyzing this CAD system. With this end in view, 52 images which 26 of them were normal and other 26 images included microcalcification pixels, were selected from the database. A suspicious region with different size (from 13Х13 to 129Х129 and even regions with different length and width like 91Х71) is extracted from each image.
[image:3.595.105.497.491.744.2]Discrete 2-D wavelet transform is used (Figure 5) and wavelet coefficients are computed to extract the features.
Figure 2. A one stage 2-D filter
Figure 4. A CAD system diagram
[image:4.595.62.299.451.673.2](B)
(A)
Figure 5. A. A region of interest including microcalcifications. B. 2-D wavelet transform on this region
Instead of using these coefficients directly or extracting any statistical features from them, a histogram is extracted (Figure 6). For producing this histogram, first we obtain the maximum and minimum of these features and then as it can be seen in (12) we divide the difference of the maximum and minimum by the total number of bins in the histogram to obtain the length of intervals (R). Finally in (13) we distribute the coefficients in the intervals regarding to their value and we get the value of each bins in the histogram:
( ) ( )
Max coefs Min coefs R
total bins −
= (12)
min ( * ) min (( 1) * )
( ); 0,1,..., 1
i R coef i R
coef bin i i bin
+ ≤ < + +
⇒ ∈ = − (13)
Figure 6. wavelet coefficient histogram from an ROI using db4 wavelet function and vertical decomposition after normalization, bins=25
After obtaining these histograms and normalizing them (dividing each bin’s value by the total value of bins in the histogram), the goal is to classify them into two categories (positive (cancerous) or negative (normal)). To achieve this
purpose, SVM is used as a classifier. To separate thetraining samples from the testing samples we use 10-fold cross validation. In this method 90 percent of data is assumed as training data and other 10 percent as test data. At last, using the test data the algorithm is examined.
3. Results
Different parameters in feature extraction step affect the performance of the CAD system. These elements consist the type of wavelet used, the type of image decomposition coefficients (approximate or one of vertical, horizontal or diagonal details) and the number of bins in the histogram. In this work 24 diverse wavelets in four possible decompositions with different number of bins from 5 to 100 are employed.
Four metrics were used to test the system performance. These metrics are:
TP TN Accuracy
TP TN FP FN + =
+ + + (14) TP
Precision TP FP =
+ (15) TP
Sensitivity
TP FN =
+ (16) TN
Specificity
TN FP =
+ (17) Where TP, TN, FP, and FN are number of true positive, true negative, false positive and false negative diagnosis respectively.
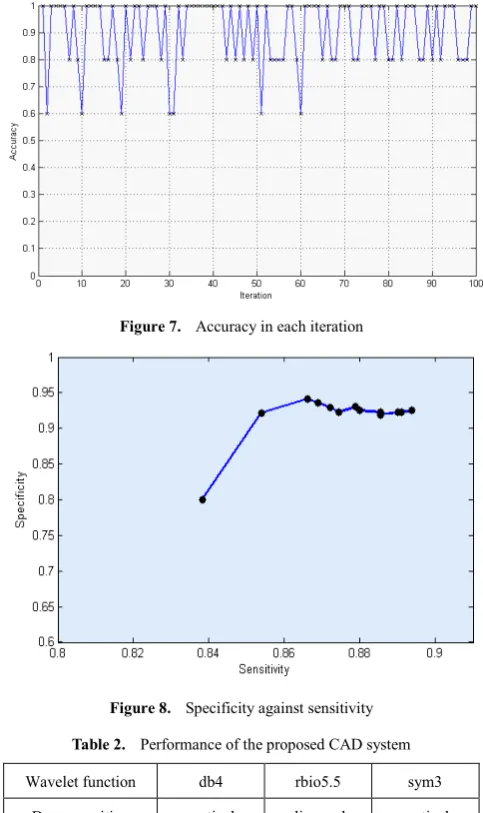
[image:4.595.365.552.571.680.2](52) and N is the number of bins in the histogram. For example the ith row and the jth column in the matrix is the number of wavelet coefficients divided by the total number of coefficients in the jth bin of the ith image. After making the matrix, 10-fold cross validation is performed on the rows and then thetraining and testing is done by SVM. This procedure is performed 30times and after each iteration each four metrics are calculated and finally the mean value of these metrics is obtained for which in table 1 the mean value of accuracy using different wavelet functions in an optimized composition of available parameters is shown. Figure 7 shows the accuracy of this system using db4 wavelet in 100 iterations and in figure 8, the specificity is demonstrated with respect to the sensitivity. In table 2 the performance of an optimized composition of available parameters is shown for 300 iterations. With respect to the performed evaluations the proposed method has an acceptable performance.
Table 1. Average of accuracy using different wavelets
Accuracy Bins Decomposition Wavelet function 86.67 15 vertical haar 81.33 40 vertical db1 87.33 15 diagonal db2 86.00 50 vertical db3 90.67 25 vertical db4 87.33 15 vertical db10 83.33 15 diagonal coif1 86.67 25 diagonal coif2 80.67 25 horizontal coif3 80.00 20 vertical coif5 86.00 15 diagonal sym2 88.67 60 vertical sym3 80.67 10 horizontal sym4 88.00 15 vertical sym5 84.67 15 vertical bior1.1 83.33 15 diagonal bior2.2 88.67 30 vertical bior3.3 82.00 20 diagonal bior44 83.33 25 vertical bior5.5 88.00 15 vertical rbio1.1 80.67 25 vertical rbio2.2 86.00 15 horizontal rbio3.3 85.33 10 diagonal rbio4.4 88.67 25 diagonal rbio5.5
Figure 7. Accuracy in each iteration
Figure 8. Specificity against sensitivity
Table 2. Performance of the proposed CAD system
sym3 rbio5.5 db4 Wavelet function vertical diagonal vertical Decomposition 64 28 18 Bins 89.88 88.77 93.80 Accuracy 87.85 91.99 94.55 Precision 83.84 77.31 88.11 Sensitivity 85.80 92.91 92.00 Specificity
4. Discussion
In [11] the first level of horizontal components and the second level of approximate component in discrete wavelet transform were used. This method is an ROI based one and if we have ROIs with diverse sizes, number of coefficients for each image is different from others and the obtained decompositions also have variety of sizes and the classification will be impossible.
[image:5.595.58.296.314.755.2]a kХN matrix is the result where k is the number of images and N is the number of coefficients (1838). Standard deviation is calculated from each column and if the standard deviation is bigger than the threshold this column will be held, otherwise it will be eliminated. The threshold is calculated using 2log( )X where X is the length of the coefficients (1838). With regard to variety of X in this work, we can’t use the method with different sized ROIs.
In [13] wavelet coefficients and statistical features are used simultaneously where the obtained coefficients using db4 in vertical, horizontal and diagonal decompositions are normalized (the value is divided by the maximum value) and the energy is computed by squaring the value. Some features are added up because of their huge number (43800). The number of features which are added up is predefined to 200 using trial and error. The result is 219 features; this method also is applicable on unique-sized ROIs.
The proposed feature extraction method isn’t limited on ROIs with the same size and direction, and the translation and size doesn’t affect the performance.
5. Conclusion
In this paper a CAD system was presented for microcalcification detection in mammography images. In an optimized composition of available parameters in the system, accuracy of %93.80 and precision of %94.55 were achieved. 2-D wavelet transform and making coefficients histogram were used in feature extraction step. To classify these features, SVM was employed. With regard to varieties in size of ROIs, the results show the effectiveness of the method for detection of microcalcifications. This method has the same performance on different directions and locations of the ROI.
In future works, progress of the system will be considered using intelligent ROI selection methods, enhancement and, classification improvement. We need to conduct more experiments, including a comparison with other methods especially object-based ones for the final conclusions after adding ROI selection phase to the method.
REFERENCES
[1] World Health Organization (WHO), Cancer Fact Sheets, Online available from
http://www.who.int/mediacentre/factsheets/fs/en/index.html. [2] J. Tang, R. M. Rangayyan, J. Xu, I. El Naqa, and Y. Yang,
Computer-aided detection and diagnosis of breast cancer with mammography: recent advances, Information Technology in Biomedicine, IEEE Transactions on, vol. 13, no. 2, pp. 236–251, 2009.
[3] M. P. Sampat, M. K. Markey, and A. C. Bovik, Computer-aided detection and diagnosis in mammography, Handbook of image and video processing, vol. 10, no. 4, pp.
1195–1217, 2005.
[4] R. E. Bird, T. W. Wallace, and B. C. Yankaskas, Analysis of cancers missed at screening mammography., Radiology, vol. 184, no. 3, pp. 613–617, 1992.
[5] D. B. Kopans, Breast imaging. Wolters Kluwer Health, 2007. [6] M. Mustra, M. Grgic, and K. Delac, Enhancement of
microcalcifications in digital mammograms, in Systems, Signals and Image Processing (IWSSIP), 19th International Conference on, pp. 248–251, 2012.
[7] H.-D. Cheng, J. Wang, and X. Shi, Microcalcification detection using fuzzy logic and scale space approaches, Pattern Recognition, vol. 37, no. 2, pp. 363–375, 2004. [8] F. Dehghan and H. Abrishami-Moghaddam, Comparison of
SVM and neural network classifiers in automatic detection of clustered microcalcifications in digitized mammograms, in Machine Learning and Cybernetics, International Conference on, vol. 2, pp. 756–761, 2008.
[9] F. Harirchi, P. Radparvar, H. A. Moghaddam, F. Dehghan, and M. Giti, Two-level algorithm for MCs detection in mammograms using Diverse-Adaboost-SVM, in Pattern Recognition (ICPR), 20th International Conference on, pp. 269–272, 2010.
[10] M. Ramaraj and S. Raghavan, A survey of wavelet techniques and multiresolution analysis for cancer diagnosis, in Computer, Communication and Electrical Technology (ICCCET), International Conference on, pp. 109–114, 2011. [11] M. Sharkas, M. Al-Sharkawy, and D. A. Ragab, Detection of
Microcalcifications in Mammograms Using Support Vector Machine, in Computer Modeling and Simulation (EMS), Fifth UKSim European Symposium on, pp. 179–184, 2011. [12] I. Faye, B. B. Samir, and M. M. Eltoukhy, Digital
mammograms classification using a wavelet based feature extraction method, in Computer and Electrical Engineering, 2009. ICCEE’09. Second International Conference on, vol. 2, pp. 318–322, 2009.
[13] M. E. Osman, M. A. Wahed, A. S. Mohamed, and Y. M. Kadah, Computer aided diagnosis system for classification of microcalcifications in digital mammograms, in National Radio Science Conference (NRSC)., pp. 1–6, 2009.
[14] M. Misiti, Y. Misiti, G. Oppenheim, and J.-M. Poggi, Wavelets and their Applications. Wiley Online Library, 2007. [15] A. Bultheel, Wavelets with applications in signal and image processing, Course material University of Leuven, Belgium, 2003.
[16] O. Christensen, Frames and bases: An introductory course. Springer, 2008.
[17] V. Singh, N. Rajpal, and K. S. Murthy, Design of a neuro fuzzy model for image compression in wavelet domain, Journal of the Indian Society of Remote Sensing, vol. 37, no. 2, pp. 185–199, 2009.
[18] Y. Yang, J. Wang, and Y. Yang, Exploiting rotation invariance with SVM classifier for microcalcification detection, in Biomedical Imaging (ISBI), 9th IEEE International Symposium on, pp. 590–593, 2012.
regression, ISIS technical report, vol. 14, 1998.
[20] J. Suckling, J. Parker, D. R. Dance, S. Astley, I. Hutt, C.