Grey Wolf Optimization for Multi Input
Multi Output System
Ahmed A. M. El-Gaafary
1, Yahia S. Mohamed
1, Ashraf Mohamed Hemeida
2,*, Al-Attar A. Mohamed
31Faculty of Engineering, Elminia University, Egypt
2Ar-Rass Faculty of Science and Arts, Qassim University, Saudi Arabia 3Faculty of Engineering, Aswan University, Egypt
Copyright © 2015 Horizon Research Publishing All rights reserved.
Abstract
Grey wolf optimizer (GWO) is a new technique, which can be applied successfully for solving optimized problems. The GWO indeed simulates the leadership hierarchy and hunting mechanism of grey wolves. There are four types of grey wolves which are alpha, beta, delta and omega. Those four types can be used for simulating the leadership hierarchy. In order to complete the process of GWO a three main steps of hunting, searching for prey, encircling prey and attacking prey are implemented. This work describes a novel meta-heuristic based on grey wolf optimization for optimum allocation of STATCOM devices on power system grid to minimized load buses voltage deviations and system power losses. Bus voltages have been solved by controlling the reactive power of shunt compensator. The Contingency management problem (such as system over-loading and a single line outages) by optimum installation of STATCOM devices, has been presented. Simulations are performed on IEEE 30-bus power system indicate that the proposed approach is a powerful search and optimization technique that may yield better solutions to engineering problems than those obtained using traditional algorithms.Keywords
Grey Wolf Optimizer (GWO) , STATCOM , Contingency Management1. Introduction
Optimization techniques have become more popular in the last two decades, and extended to cover different areas of study. Genetic algorithms (GA), Ant colony optimization (ACO), and particle swarms optimization (PSO) are the most well-known techniques from meta-heuristic optimization techniques[1-3].
Those techniques are the most used optimization techniques due to their simplicity, flexibility, derivation free mechanism, and local optima avoidance. The meta-heuristic optimization techniques have different advantages makes
them the first choice for solving optimization problems. Their simplicity comes from being reveal of natural phenomena, animals behaviors, or evolutionary concepts[4]. Moreover they can be apply simply to different optimization problems without any change in algorithm structure, and they are the most suitable optimization techniques for real problems. Different modification techniques have been introduced to enhance the performance of (PSO)[5-12].
techniques to FACTs devices have received a great attention from the researcher[14-20]. The improvement of transmission system loading margin with optimization based STATCOM device has been investigated using ordinal optimization (OO) [20].
In this study, grey wolf optimizer (GWO) technique is applied to multi-input multi-output electric power systems, to determine the optimum location and sizing of installing (STATCOM) devices in power systems for improving the system voltage stability. Objective functions are considered for the optimization process which is minimizing voltage deviation and power system loss. To validate the use of GWO for optimal location and optimal parameters of STATCOM, an IEEE 6M/30 bus power system is tested. The obtained results indicate the accuracy of the proposed GWO technique for the optimum allocation of STATCOM for system over-loading and a single line outages.
2. Problem Formulation
The optimal power flow consists of multiple objective functions is formulated to be minimize, power losses, voltage deviations and allocation of STATCOM devices (numbers and sizing).Generally the problem can be formulated as a nonlinear and constrained optimization problem [21-23]:
Minimize: f(x,u) (1) Subject to: g(x,u) = 0 ; (2) h(x,u) ≤ 0 (3) where u: Vector of problem control variable ; x: Vector of system state variables
f(x, u): Objective function to be minimized. g(x, u) : Equality constraints represents non-linear load flow equations.h(x, u): Inequality constraints.
2.1. Minimization of Transmission lines losses
Minimization real power loss as in [24-25] can be represented as:
𝑓𝑓1(PLoss) =∑nli=1Gij(Vi2+ Vj2−2ViVjcos (δi− δj) (4) Where nl is the total number of transmission lines, V and δ are the voltage and the voltage angle of bus respectively, and Gij is the conductance between i and j buses.
2.2. Minimization of Voltage Deviation (VD)
The load voltage deviation as a term of objective function f2(x, u) is defined as:
𝑓𝑓2(𝑉𝑉𝑉𝑉) =∑𝑁𝑁𝑁𝑁𝑁𝑁𝐾𝐾=1�𝑉𝑉𝐾𝐾− 𝑉𝑉𝐾𝐾𝑟𝑟𝑟𝑟𝑟𝑟� (5) where, NLB represents total number of load buses, 𝑉𝑉𝐾𝐾𝑟𝑟𝑟𝑟𝑟𝑟is the nominal voltage value. To have a good voltage performance, the voltage deviation at each load bus must be made as small as possible from 1.0 per unit.
2.3. Minimization of FACTS Number and Size
The number of STATCOM devices and its corresponding reactive power will be precisely selected by incorporated into cost function as:
𝑓𝑓3(𝑁𝑁𝑁𝑁𝑁𝑁𝑁𝑁𝑁𝑁𝑁𝑁,𝑠𝑠𝑠𝑠𝑠𝑠𝑁𝑁) =𝑁𝑁𝑠𝑠𝑠𝑠+∑𝑁𝑁𝑠𝑠𝑠𝑠𝑗𝑗=1|𝑄𝑄𝑠𝑠𝑠𝑠(𝑗𝑗)| (6)
Where Qsc is the STATCOM reactive power,𝑁𝑁𝑠𝑠𝑠𝑠 is the number of STATCOM Buses.
The objective function includes the total voltage deviation, the total power losses, the total STATCOM reactive power and the total STATCOM number will be described as:
f(x,u)=𝑓𝑓1(PLoss)+𝑓𝑓2(𝑉𝑉𝑉𝑉)+𝑓𝑓3(𝑁𝑁𝑁𝑁𝑁𝑁𝑁𝑁𝑁𝑁𝑁𝑁,𝑠𝑠𝑠𝑠𝑠𝑠𝑁𝑁) (7) In all objective functions, x is the vector of dependent variable consisting of i.e. load voltages (VL1 ... VNLB) and
generators reactive powers (QG1 ... QgNG ), where u is the
vector of independent variables here reactive power injections (𝑄𝑄𝑠𝑠𝑠𝑠1... 𝑄𝑄𝑠𝑠𝑠𝑠𝑁𝑁𝑠𝑠𝑠𝑠). The objective function (7) is described as a mixed continuous discrete optimization problem. The placement of STATCOM is considered as a discreet decision variable. Some constraints including entire power flow equations. The cost function Subject to: Equivalent constraints g(x, u):
𝑃𝑃𝐺𝐺𝐺𝐺− 𝑃𝑃𝐷𝐷𝐺𝐺− 𝑉𝑉𝐺𝐺∑𝑛𝑛𝑛𝑛𝑗𝑗=1𝑉𝑉𝑗𝑗[𝐺𝐺𝐺𝐺𝑗𝑗cos�𝛿𝛿𝐺𝐺− 𝛿𝛿𝑗𝑗�+𝐵𝐵𝐺𝐺𝑗𝑗sin�𝛿𝛿𝐺𝐺−
𝛿𝛿𝑗𝑗�] = 0 (8)
𝑄𝑄𝐺𝐺𝐺𝐺− 𝑄𝑄𝐷𝐷𝐺𝐺− 𝑉𝑉𝐺𝐺∑𝑗𝑗=1𝑛𝑛𝑛𝑛 𝑉𝑉𝑗𝑗[𝐺𝐺𝐺𝐺𝑗𝑗sin�𝛿𝛿𝐺𝐺− 𝛿𝛿𝑗𝑗� − 𝐵𝐵𝐺𝐺𝑗𝑗𝑐𝑐𝑐𝑐𝑠𝑠�𝛿𝛿𝐺𝐺−
𝛿𝛿𝑗𝑗�] = 0 (9) Where i=1,2…nb is the number of buses, PG and QG are
the generator real and reactive power respectively, PD and QD
are the real and reactive loads respectively, Bij is the transfer
susceptance between bus i and bus j respectively. Inequality constraints h(x, u):
Upper and lower limits on the active and reactive generations:
𝑃𝑃𝐺𝐺𝐺𝐺𝑚𝑚𝐺𝐺𝑛𝑛 ≤ 𝑃𝑃𝐺𝐺𝐺𝐺≤ 𝑃𝑃𝐺𝐺𝑛𝑛𝑚𝑚𝑚𝑚𝑚𝑚 ∀𝑠𝑠𝜀𝜀𝑛𝑛𝑛𝑛 (10)
𝑄𝑄𝐺𝐺𝐺𝐺𝑚𝑚𝐺𝐺𝑛𝑛≤ 𝑄𝑄𝐺𝐺𝐺𝐺≤ 𝑄𝑄𝐺𝐺𝑛𝑛𝑚𝑚𝑚𝑚𝑚𝑚 ∀𝑠𝑠𝜀𝜀𝑛𝑛𝑛𝑛 (11) Upper and lower bounds in the bus voltage magnitude:
𝛿𝛿𝐺𝐺𝑗𝑗𝑚𝑚𝐺𝐺𝑛𝑛 ≤ 𝛿𝛿𝐺𝐺𝑗𝑗≤ 𝛿𝛿𝐺𝐺𝑗𝑗𝑚𝑚𝑚𝑚𝑚𝑚 ∀𝑠𝑠𝜀𝜀𝑛𝑛𝑛𝑛 (-45o to 45o) (12) Upper and lower bounds in the STATCOM parameters:
QminSC ≤QSC≤QSCmax (-20Mvar to 20Mvar) (13) Inequality constraints of the system voltage
𝑉𝑉𝐺𝐺𝑚𝑚𝐺𝐺𝑛𝑛≤ 𝑉𝑉𝐺𝐺≤ 𝑉𝑉𝐺𝐺𝑚𝑚𝑚𝑚𝑚𝑚 (14) The bus voltages specified within ±5% of the nominal value.
2.4. Contingency Analysis and Power System Stress
causes such as the variation of load and the outage of lines. 2.4.1. Single Line Outages
For optimal placement of STATCOM in a power system, single line outages are considered as contingencies in this paper and to evaluate the severity of a contingency, Voltage Power Index (VPI) has been used as:
𝑉𝑉𝑃𝑃𝑉𝑉=∑𝑁𝑁𝑁𝑁𝐺𝐺=1(∆|𝑉𝑉𝐺𝐺|/∆|𝑉𝑉𝐺𝐺𝑚𝑚𝑚𝑚𝑚𝑚|)2𝑚𝑚 (15)
where, ∆|𝑉𝑉𝐺𝐺| is absolute arithmetic difference between the voltage magnitude under line outage and base case condition;
∆|𝑉𝑉𝐺𝐺𝑚𝑚𝑚𝑚𝑚𝑚| is bus voltage magnitude selected by the utility engineers to specify how much they think is permissible limit for an outage case. ∆|𝑉𝑉𝐺𝐺𝑚𝑚𝑚𝑚𝑚𝑚| has been considered as 0.2 p.u.
2.4.2. System Loadability
The equality constraints are the load flow equations given by the relation:
𝑃𝑃𝐺𝐺𝐺𝐺− 𝜆𝜆𝑃𝑃𝐷𝐷𝐺𝐺 =𝑃𝑃𝐺𝐺 (16)
𝑄𝑄𝐺𝐺𝐺𝐺− 𝜆𝜆𝑄𝑄𝐷𝐷𝐺𝐺 =𝑄𝑄𝐺𝐺 (17)
λ is the loadability factor in p.u. 𝑃𝑃𝐺𝐺 and𝑄𝑄𝐺𝐺 are real and reactive power loads at bus i.
3. Grey Wolf Search Algorithm
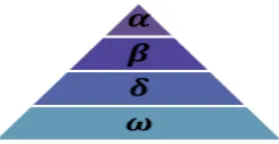
[image:3.595.316.548.336.490.2]Grey wolves at the top of the food chain, mostly prefer to live in a pack. Of particular interest is that they have a very strict social dominant hierarchy as shown in Fig. 1.
Figure 1. Hierarchy of grey wolf (dominance decreases from top down).
In the GWO algorithm the hunting (optimization) is guided by α, β, and δ. The ω wolves follow these three wolves.
Encircling prey: grey wolves encircle prey during the hunt. In order to mathematically model encircling behavior the following equations are proposed[4]:
𝑉𝑉= |𝐶𝐶 ∙ 𝑋𝑋𝑃𝑃(𝑡𝑡)| (18)
𝑋𝑋(𝑡𝑡+ 1) =𝑋𝑋𝑃𝑃(𝑡𝑡)− 𝐴𝐴 ∙ 𝑉𝑉 (19) where t indicates the current iteration, A and C are coefficient vectors, Xp is the position vector of the prey, and
X indicates the position vector of a grey wolf. The vectors A and C are calculated as follows:
𝐴𝐴= 2𝑎𝑎 ∙ 𝑁𝑁1− 𝑎𝑎 (20)
𝐶𝐶= 2∙ 𝑁𝑁2 (21) where components of a are linearly decreased from 2 to 0
[image:3.595.107.247.454.526.2]over the course of iterations and r1, r2 are random vectors in
[0, 1].
Hunting: In order to mathematically simulate the hunting behavior of grey wolves, suppose that the alpha (best candidate solution) beta, and delta have better knowledge about the potential location of prey. Therefore, we save the first three best solutions obtained so far and oblige the other search agents (including the omegas) to update their positions according to the position of the best search agents. The following formulas are proposed in this regard.
𝑉𝑉∝= |𝐶𝐶1∙ 𝑋𝑋𝛼𝛼− 𝑋𝑋|,𝑉𝑉𝛽𝛽=�𝐶𝐶2∙ 𝑋𝑋𝛽𝛽− 𝑋𝑋�,𝑉𝑉𝛿𝛿 = |𝐶𝐶3∙ 𝑋𝑋𝛿𝛿− 𝑋𝑋|
(22)
𝑋𝑋1=𝑋𝑋∝− 𝐴𝐴1∙(𝑉𝑉𝛼𝛼),𝑋𝑋2=𝑋𝑋𝛽𝛽− 𝐴𝐴2∙ �𝑉𝑉𝛽𝛽�,𝑋𝑋3=𝑋𝑋𝛿𝛿− 𝐴𝐴3∙
(𝑉𝑉𝛿𝛿) (23)
𝑋𝑋(𝑡𝑡+ 1) =𝑋𝑋1+𝑋𝑋2+𝑋𝑋3
3 (24)
4. Studied Model
The IEEE 30-bus power system has been selected for this study as shown in Figure 2.
Figure 2. IEEE 30 Bus power system.
From the equivalent circuit of the STATCOM shown in Figure 3 let the voltage at bus j as 𝑉𝑉𝑗𝑗⌊𝛿𝛿𝑗𝑗, the variable voltage (ac) at the output of STATCOM as𝑉𝑉𝑗𝑗⌊𝛿𝛿𝑗𝑗, (𝑌𝑌𝑠𝑠𝑠𝑠 =𝐺𝐺𝑠𝑠𝑠𝑠+𝑗𝑗𝐵𝐵𝑠𝑠𝑠𝑠) is the STATCOM admittance and 𝑄𝑄𝑠𝑠𝑠𝑠is the Reactive power exchange for the STATCOM with the bus. The STATCOM power flow constraints given in [21] are used for calculating the power flow analysis on the studied electrical network given in Figure 2. These constraints can be described from eq. (25) to eq. (28).
𝑃𝑃𝑠𝑠𝑠𝑠 =
|𝑉𝑉𝑠𝑠𝑠𝑠|2𝐺𝐺𝑠𝑠𝑠𝑠−|𝑉𝑉𝑠𝑠𝑠𝑠|�𝑉𝑉𝑗𝑗��𝐺𝐺𝑠𝑠𝑠𝑠cos�𝛿𝛿𝑠𝑠𝑠𝑠− 𝛿𝛿𝑗𝑗�+𝐵𝐵𝑠𝑠𝑠𝑠sin�𝛿𝛿𝑠𝑠𝑠𝑠− 𝛿𝛿𝑗𝑗�� (25)
𝑄𝑄𝑠𝑠𝑠𝑠 =−|𝑉𝑉𝑠𝑠𝑠𝑠|2𝐵𝐵𝑠𝑠𝑠𝑠−|𝑉𝑉𝑠𝑠𝑠𝑠|�𝑉𝑉𝑗𝑗��𝐺𝐺𝑠𝑠𝑠𝑠𝑠𝑠𝑠𝑠𝑛𝑛�𝛿𝛿𝑠𝑠𝑠𝑠− 𝛿𝛿𝑗𝑗� −
𝐵𝐵𝑠𝑠𝑠𝑠𝑐𝑐𝑐𝑐𝑠𝑠�𝛿𝛿𝑠𝑠𝑠𝑠− 𝛿𝛿𝑗𝑗�� (26)
𝑃𝑃𝑗𝑗=�𝑉𝑉𝑗𝑗�2𝐺𝐺𝑠𝑠𝑠𝑠−|𝑉𝑉𝑠𝑠𝑠𝑠|�𝑉𝑉𝑗𝑗��𝐺𝐺𝑠𝑠𝑠𝑠𝑐𝑐𝑐𝑐𝑠𝑠�𝛿𝛿𝑗𝑗− 𝛿𝛿𝑠𝑠𝑠𝑠�+𝐵𝐵𝑠𝑠𝑠𝑠𝑠𝑠𝑠𝑠𝑛𝑛�𝛿𝛿𝑗𝑗−
𝛿𝛿𝑠𝑠𝑠𝑠�� (27)
𝑄𝑄𝑗𝑗=
𝛿𝛿𝑠𝑠𝑠𝑠�� (28)
Figure 3. Static compensator (STATCOM) system.
5. Simulations Results
The GWO has been implemented to search with the following parameters:
Number of Search Agents :40 ;Number of iterations : 150 Number of variables (dimension of the problem) : 14 It is desirable to keep the voltage deviations near zero to avoid voltage collapses during faulty conditions. The base case and different two fault cases (single line outages and system loading ) have been carried out (Table 1) .
Table 1. THE BEST OPTIMAL SOLUTION OBTAINED BY GWO
Case Location (Bus No.) STATCOM STATCOM Size (Mvar) (Alpha-score) Min.fitness
1 2 3
30th,26th ,21th 30th 30th ,26th ,22th
2.631 , 2.344 , -0.288 15.19 4.440 , 3.636 , 6.721
17.8187 27.8558 33.2976
Case 1: base case
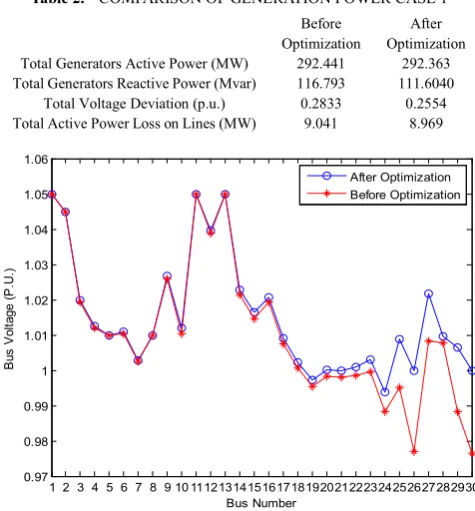
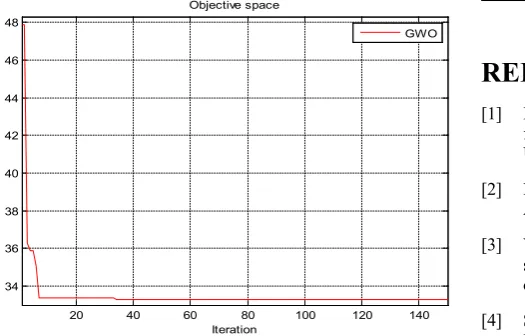
[image:4.595.312.550.81.337.2]A modify IEEE 30 bus network [26]. A fast solve of the fitness function by GWO shown in Fig. 4. The effect of optimization solution on the power system voltage profile (Fig. 5) and the successfully reduce in generation powers and system losses are illustrated in Table 2.
Figure 4. GWO Fitness function convergence curve for case 1
Table 2. COMPARISON OF GENERATION POWER CASE 1
Before
Optimization Optimization After Total Generators Active Power (MW)
Total Generators Reactive Power (Mvar) Total Voltage Deviation (p.u.) Total Active Power Loss on Lines (MW)
292.441 116.793 0.2833 9.041
292.363 111.6040
0.2554 8.969
Figure 5. comparison of voltage profile case 1 Case 2: single line outages
[image:4.595.64.291.359.425.2]For optimum allocation of STATCOM, single line outages are considered as contingencies in the test power system and to evaluate the severity of a contingency VPI is used. It has been observed that Newton Raphson load flow converges for only for 38 line outages out of 41 line outages. On the basis of VPI, the ranking of critical contingencies was done as 36, 38, 39 and 14 and so on, with corresponding values 2.1285, 0.0293, 0.065 and 0.0156. Only first most severe contingencies i.e. outage of line no.36 have been considered for STATCOM placement. Fig.6 shows the convergence characteristic of GWO, while fig.7 illustrates the voltage profile of the test system without and with STATCOM at bus no. 30. The enhancement in the total performances of the power system as illustrated in table 3.
Figure 6. Convergence characteristic of GWO for outage of line no. 36.
20 40 60 80 100 120 140
20 25 30 35 40
Objective space
Iteration
M
in.
F
itnes
s (
A
lpha s
cor
e)
GWO
1 2 3 4 5 6 7 8 9 10 1112131415161718192021222324252627282930 0.97
0.98 0.99 1 1.01 1.02 1.03 1.04 1.05 1.06
Bus Number
Bus
V
ol
tage (
P.
U.
)
After Optimization Before Optimization
20 40 60 80 100 120 140
28 30 32 34 36 38 40
Objective space
Iteration
M
in.
F
itnes
s (
A
lpha s
cor
e)
[image:4.595.62.296.528.707.2] [image:4.595.312.549.549.719.2]Figure 7. Comparison of voltage profile case 2
Table 3. COMPARISON OF GENERATION POWER CASE 2
Before
Optimization Optimization After Total Generators Active Power
(MW)
Total Generators Reactive Power (Mvar)
Total Active Power Loss on Lines (MW)
Injected Reactive power (Mvar) Total Voltage Deviation (p.u.)
295.136
124.095
11.736
0.0 1.0986
294.711
106.78
11.311
15.19 0.3556 Case 3: System Loadability
The stress of power system is modeled by an increase the loadability factor λ up to 1.2, so an increase in the demand load power from (283.4MW 126.2Mvar) to (340.08MW 151.44Mvar). Without any modify in the generating powers in generation buses (PG buses). Solve the optimization problem with GWO, as can be seen from fig. 8. The network without STATCOM devices has more voltage drop in the buses. This clearly shows the significant influence of STATCOM devices on keeping bus voltages in the acceptable range, as shown in Fig.9. The improvement in the total performances of the power system as illustrated in table 4.
[image:5.595.59.294.79.257.2]Figure 8 . GWO Fitness function convergence curve for case 3
Figure 9. Comparison of voltage profile case 3
Table 4. COMPARISON OF GENERATION POWER CASE 3
Before
Optimization Optimization After Total Generators Active Power (MW)
Total Generators Reactive Power (Mvar)
Total Active Power Loss on Lines (MW)
Injected Reactive power (Mvar) Total Voltage Deviation (p.u.)
355.643
167.470
15.563 0.0 0.3764
355.349
150.7560
15.269 14.797 0.2319
6. Conclusions
Grey Wolf Optimizer used for optimum number, location and size of STATCOM devices. GWO is proposed in order to improve the voltage profile and reduce the system losses, that clearer in IEEE 30 bus system. From the obtained results, it is obvious that sufficient enhancement in the steady-state security of the network and system loadability. The proposed GWO has shown superior features including high quality solution, stable convergence characteristics, good computational efficiency and mainly have a fast coverage to optimal solution.
REFERENCES
[1] Bonabeau E, Dorigo M, Theraulaz G. "Swarm intelligence: from natural to artificial systems", Oxford University Press, USA , 1999.
[2] Marco Dorigo, Thomas Stutzle, "Ant Colony Optimization", A Bradford Book, The MIT Press, 2006.
[3] Yuhui Shi ; Eberhart, R., Eberhart R." Modified Particle swarm optimizer", The 1998 IEEE International Conference on Computational Intelligence, 1998, pp. 69-73.
[4] Seyedali Mirjalili, Seyed Mohammad Mirjalili, Andrew Lewis, "Grey Wolf Optimizer", Advances in Engineering Software, Vol. 69, 2014, pp. 46–61.
1 2 3 4 5 6 7 8 9 10 1112131415161718192021222324252627282930 0.8
0.85 0.9 0.95 1 1.05
Bus Number
Bus
V
ol
tage (
P.
U.
)
After Optimization Before Optimization
20 40 60 80 100 120 140
34 36 38 40 42 44 46 48
Objective space
Iteration
M
in.
F
itnes
s (
A
lpha s
cor
e)
GWO
1 2 3 4 5 6 7 8 9 10 1112131415161718192021222324252627282930 0.95
0.96 0.97 0.98 0.99 1 1.01 1.02 1.03 1.04 1.05
Bus Number
B
us
V
ol
tage (
P
.U
.)
[image:5.595.70.333.570.738.2][5] Tao Xiang, Kwok-wo Wong, Xiaofeng Liao, "A novel particle swarm optimizer with time-delay" Applied Mathematics and Computation 186, 2007, pp. 789–793. [6] Leandro dos Santos Coelho, "A quantum particle swarm
optimizer with chaotic mutation operator" Chaos, Solitons and Fractals, Vol. 37, (2008), pp. 1409–1418.
[7] Rupam Kundu a, Swagatam Das b,n, Rohan Mukherjee a, Shantanab Debchoudhury, "An improved particle swarm optimizer with difference mean based perturbation" Neurocomputing, Vol. 129, 2014, pp. 315–333.
[8] Yixiong Feng, Bing Zheng, Zhongkai Li, " Exploratory study of sorting particle swarm optimizer for multiobjective design optimization" Mathematical and Computer Modelling, Vol. 52, (2010), pp. 1966-1975.
[9] Prithwish Chakraborty, Swagatam Das, Gourab Ghosh Roy, Ajith Abraham, " Erratum to On convergence of the multi-objective particle swarm optimizers" Information Sciences 181 (2011) 3533
[10] Xueming Yang, Jinsha Yuan, Jiangye Yuan, Huina Mao, " A modified particle swarm optimizer with dynamic adaptation" Applied Mathematics and Computation, Vol. 189, (2007), pp. 1205–1213.
[11] XU Jun-jie, YUE Xin, XIN Zhan-hong, "Research of stochastic weight strategy for extended particle swarm optimizer" The Journal of China Universities of Posts and Telecommunications, Vol.15, Issue 2, June 2008, pp. 122-125.
[12] Xuewen Xia, Jingnan Liu, Zhongbo Hu, " An improved particle swarm optimizer based on tabu detecting andlocal learning strategy in a shrunk search space" Applied Soft Computing, Vol. 23, 2014, pp. 76–90.
[13] Jin Yisu, Joshua Knowles, Lu Hongmei, Liang Yizeng, Douglas B. Kell, "The landscape adaptive particle swarm optimizer", Applied Soft Computing, Vol. 8, 2008, pp. 295– 304.
[14] Sidhartha Panda, "Multi-objective PID controller tuning for a FACTS-based damping stabilizer using Non-dominated Sorting Genetic Algorithm-II" Electrical Power and Energy Systems Vol. 33, 2011, pp. 1296–1308.
[15] T. Nireekshana, G. Kesava Rao, S. Siva Naga Raju, "Enhancement of ATC with FACTS devices using Real-code Genetic Algorithm", Electrical Power and Energy Systems, Vol. 43, 2012, pp. 1276–1284.
[16] Sidhartha Panda, Narayana Prasad Padhy, "Comparison of
particle swarm optimization and genetic algorithm for FACTS-based controller design" Applied Soft Computing, Vol. 8, 2008, pp. 1418–1427.
[17] J. Preetha Roselyn, D. Devaraj, Subhransu Sekhar Dash, "Multi-Objective Genetic Algorithm for voltage stability enhancement using rescheduling and FACTS devices" Ain Shams Engineering Journal, Vol. 5, 2014, pp. 789–801. [18] M. Saravanan, S. Mary Raja Slochanal, P. Venkatesh, J.
Prince Stephen Abraham, "Application of particle swarm optimization technique for optimal location of FACTS devices considering cost of installation and system loadability" Electric Power Systems Research, Vol. 77, 2007, pp. 276–283.
[19] K. Ravi, M. Rajaram, "Optimal location of FACTS devices using Improved Particle Swarm Optimization" Electrical Power and Energy Systems, Vol. 49, 2013, pp. 333–338. [20] Y.C. Chang, "Transmission system loading margin
enhancement with ordinal optimization based STATCOM installation strategy", Electrical Power and Energy Systems, Vol. 55, 2014, pp. 503–510.
[21] G. Sasank Das, B. Mohan, "Optimal Allocation of FACTS Device with Multiple Objectives Using Genetic Algorithm", International Journal Of Modern Engineering Research (IJMER), Vol. 4, Iss. 2, Feb. 2014, pp. 162-168.
[22] V. Petridis, S. Kazarlis, A. Bakirtzis, "Varying Fitness Functions in Genetic Algorithm Constrained Optimization", IEEE Transactions On Systems, Man, and Cybernetics Part B, VOL. 28, NO. 5, October 1998, pp. 629 - 640.
[23] Abido, M. A. "Optimal power flow using particle swarm optimization." International Journal of Electrical Power & Energy Systems,Vol 24, 2002,pp.563–571
[24] J. Namratha Manohar, J.Amarnath,"Enhancement of Available Transfer Capability Using Facts Devices and Evaluation of Economics of Operating De-Regulated Power Systems",Int. J. of Advanced Research in Electrical, Electronics and Instrumentation Engineering, Vol.3, Issue 1, Jan. 2014, pp. 6747-6761.
[25] R.Kalaivani, S.K.Dheebika,"Application of Soft Computing Technique to Avoid Voltage Collapse in Power System", International Journal of Engineering and Technology (IJET), Vol 5 No 6, Jan 2014 , pp 5079 –5087.