2016 International Conference on Artificial Intelligence and Computer Science (AICS 2016) ISBN: 978-1-60595-411-0
Pulse Compression of Linear Frequency Modulation Signals
in Presence of Phase Truncation
Wei-bo DENG and Ying-jun ZHUANG
*Research Institute of Electronic Engineering, Harbin Institute of Technology, 150001 Harbin, China *Corresponding author
Keywords: Linear frequency modulation, Direct digital synthesis, Phase truncation, Pulse compression.
Abstract. Direct digital synthesis (DDS) is widely used in radar signal generation. In order to study the influence of phase truncation on signal processing, this paper models DDS to generate linear frequency modulated (LFM) signal, and accomplishes pulse compression based on systemvue. Based on phase truncation spurs of thesingle-tone sinusoidal signal, spurious components of LFM signals generated by DDS are analyzed qualitatively. Simulations graphically demonstrate that, these spurs decrease signal to noise ratio after pulse compression. To avoid effect of these spurs, proper parameters of DDS are provided for radar systems.
Introduction
With the emergence of pulse compression technology, LFM signals have been playing an important role in radar systems. LFM waveform generation schemes are classified in analog and digital techniques [1]. With the development of the digital technology, modern radar systems have raised remarkably requirements for the direct digital frequency synthesis owing to its advantages of high frequency resolution and fast frequency switching speed. Previous research suggested that DDS technology can be entirely implemented on a Field Programmable Gate Array (FPGA) [1] and the quantized LFM signal generated has exactly similar performances with a continuous chirp signal [2]. Inevitably, it is the digital structure especially the phase truncation that bring complicated spurious components to the output signal, which have always been the focus that people pay attention to. Early efforts mainly concentrated on determining the location and magnitude of phase truncation spurs [3,4]. With the widely use of DDS, various effective methods have been proposed to reject the output spurious, which can be divided into two kinds: one kind is designing new approaches of phase to sine mapper [5]; another kind is applying the coordinate rotation digital computer (CORDIC) algorithm to DDS [6].
However, few attempts have been made to investigate the influence of phase truncation on signal processing, especially pulse compression for the LFM signal. In this paper, we aim to analyze the characteristic of spurs introduced by phase truncation in the LFM signal generated by DDS. Furthermore, this paper would provide some results about the influence of these spurs on pulse compression.
Model of Simulated System LFM Signal Generation with DDS
Chirp signal is a sinusoid and its frequency increases or decreases linearly with the pulse width, which can be described as Eq. 1
2 2 1
t 1
pw
f - f
S = exp f t + t
2T
where
f
1andf
2are the initial and terminal frequency of the LFM respectively,T
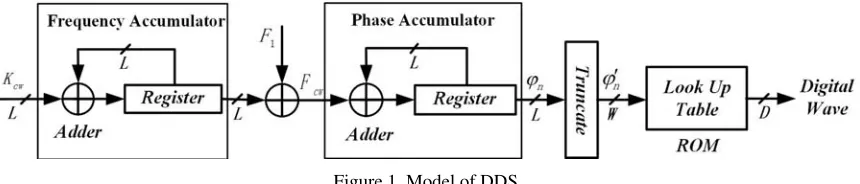
pwrefers to the pulse width of the LFM pulse signal.Figure 1. Model of DDS.
Fig.1 demonstrates the structure of generating LFM signal by DDS. The operational principle of accumulator is the overflow algorithm. Kcw denotes the chirp rate control word with word length of L bits, which can be calculated by Eq. 2.
L2 1 cw
pw c c
f
f
2
K
=
T
f
f
-
. (2)where
f
c is clock frequency and 〈∙〉 is operation of rounding to the nearest number. 1 1c L
2 × F = f
f
indicates the digital frequency of
f
1. Digital phase from accumulator can be calculated by Eq. 3.
nn i = 0 cw
φ =
F i . (3) Considering the size of ROM, we usually truncate the lowest B = L - W bits ofφ
nas Eq. 4.
n
' B
n
L
n
φ 2
φ = mod , - mod φ , 2 . (4)
Since we are interested in the spurious due to phase truncation, we will focus on the characteristics of the output digital wave, which can be described as Eq. 5.
' n
n L
φ
S = cos 2π
2
. (5)where the initial phase is assumed to be 0.
Model of Signal Processing
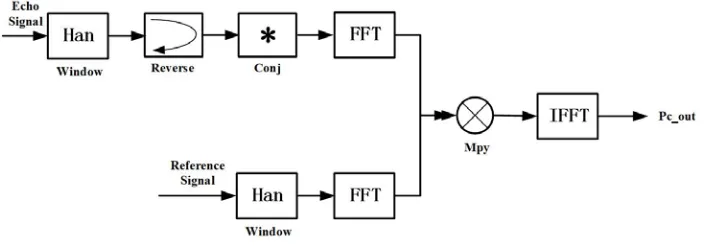
Figure 2. Pulse compression.
Echo signal will be produced by DDS model above and modulated by a target model, which is set to be a stationary point target and 60000 meters away from the radar. FFT of the reversed and conjugated echo signal is multiplied with FFT of reference signal. Afterwards, making IFFT of the output will obtain the result of pulse compression. We will use hanning window to decrease the sidelobe.
Analysis of Phase Truncation Spurs
As the output frequency of DDS is digital, what we need analyze firstly is the spurs of the single-tone sinusoidal signal. Henry T. Nicholas and Henry Samueli have derived the error sequence of phase truncation in [1], and obtained the complex Fourier series representation as Eq. 6.
Λ cw
p k=1 k B
F
ε n = ξ exp j2πk n exp jΨ k,Λ
2
. (6)where
B-1 B
cw
2 Λ =
gcd 2 , F ,
B
k
2 kπ
ξ csc
2Λ 2Λ
,
kπ Ψ k,Λ -ctg
2Λ
,
ξ
k and Ψ k,Λ
mean themagnitude and phase of the
k
thdistortion of the error sequence.Positions of the Λ components can be mapped to the spectral range
0,f / 2
c
,f
ek andξ
ek in Eq. 7and Eq. 8 are the position and magnitude of the
k
thspur.
B
B
cw cw
ek c B B
mod kF , 2 mod kF , 2
f = f min
,1-2 2
×
. (7)
B-1
ek
2 kπ
ξ = csc
Λ 2Λ
. (8)
Therefore, output of the single-tone with phase truncation can be expressed as Eq. 9.
n L cw p
2π
S = cos nF -ε n
2
. (9)
Because p
Lε n 1
n L cw L p L cw
cw k
L L+1 k
L-B L-B
cw cw
L L
2π 2π 2π
S cos nF + ε n sin nF
2 2 2
2π 2π π
cos nF + ξ exp j Ψ k, Λ ×
2 2 2
2πnF 2πnF
exp j k2 +1 - exp j k2 -1
2 2
(10)It is obvious that the output signal is suspiciously like a double side band amplitude modulated (AM) signal. Considering the word length of L and effect of ideal DA, the position of the spurs can be mapped to spectral range
0,f / 2
c
as Eq. 11.
L-B L
L-B L
cw cw cw cw
sk c L L
mod kF 2 F , 2 mod kF 2 F , 2
f = f min
,1-2 2
. (11)
B-1 B-L
sk L+1
2π 2 kπ π 2 kπ
ξ × csc csc
2 Λ 2Λ 2Λ 2Λ
. (12)
sk
f
andξ
skare the actual frequency and magnitude of thek
thspurs. Simplifying Eq. 12, we can getsk
ξ
as Eq. 13.
B B B-L cw B-Lsk B B
cw
πgcd 2 , F / 2
π2 kπ
ξ = csc = 2
2Λ 2Λ sin πkgcd 2 , F / 2
. (13)
It can be seen that when k=1, the location and magnitude of the worst spur are shown in Eq. 14 and Eq. 15.
L-B
ws
L L-B L
cw cw cw cw
c L L
mod F 2 F , 2 mod F 2 F , 2
f min ,
f =
1-2 2
. (14)
B B cw B-Lws B B
cw
πgcd 2 , F / 2
ξ = 2
sin πgcd 2 , F / 2 . (15)
The signal to noise ratio (SNR) shown in Eq. 16 can be calculated by Eq. 15.
B B cw L-B B B s1 cwπgcd 2 , F / 2
1
SNR = 20log ξ = 20log2 - 20log
sin πkgcd 2 , F / 2
. (16)
Because
B B cw B B cwπgcd 2 , F / 2 π
1 < <
2
sin πkgcd 2 , F / 2 , the SNR will satisfy Eq. 17.
Simulation Results
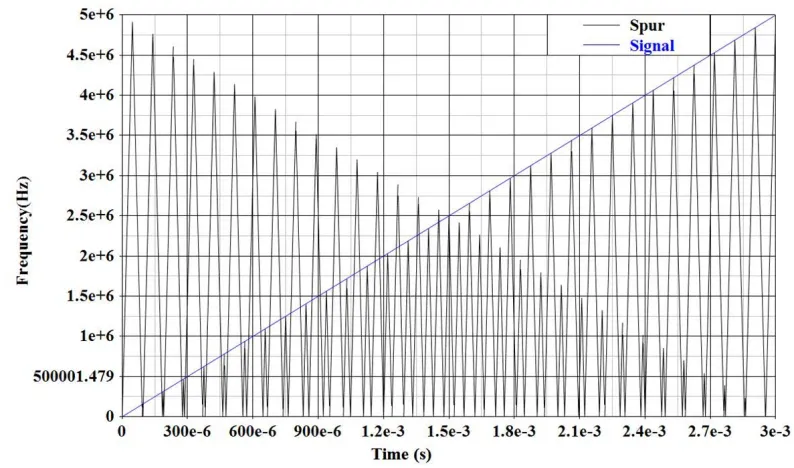
[image:5.612.106.503.107.341.2]Calculating the location of output signal and the worst spur according to Eq. 14, we can get Fig. 3.
Figure 3. Relationship between Signal and Spurs when L=24, B=18.
Note that when the frequency of the output signal changes with time linearly, the spurs also changes linearly but shows like a saw tooth wave which is non-periodic. Calculating the slope,
sig 1
k = .33e9 and ksp = .4e108 indicate that the slope of spurs is greatly lager than signal. Define
sp k
sig
k r
k
= ,the simulation also shows that rk varies with L-B, which is shown graphically in Fig. 4.
Figure 4. Relationship Between r and L-B
k
r increases rapidly with L-B increasing, insuring that the bandwidth of spurs absolutely larger than output signal. Consequently, the influence of spurious components is extremely similar like noise. Fig. 5 demonstrates LFM pulse signal withTpw=300μs,Tpp= 400μs,f1=1.67MHz,f2=1.87MHz,
[image:5.612.185.431.455.609.2]Figure 5. LFM signal of DDS when L=32, B=21.
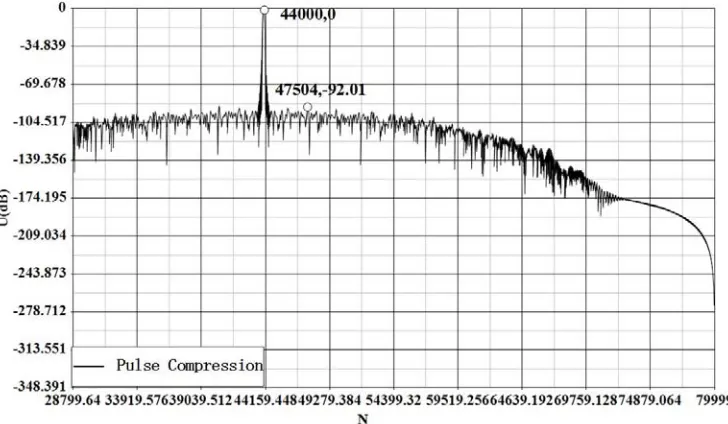
Simulation of pulse compression with phase truncation is shown in Fig. 6, showing that the phase truncation results in SNR -92dB after pulse compression.
Figure 6. Result of Pulse Compression when L=32, B=21.
pp c
2R
N = + T f = 44000
c
is consistent with R = 60000m,where
8
c =3 10 m s .
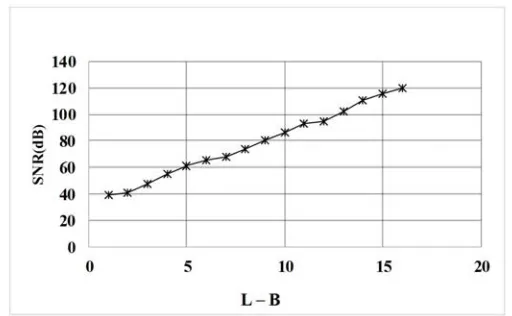
According to the analysis before, SNR of DDS output signal get higher and the band of spurs get wider with the increase of L-B, causing improvement of SNR after pulse compression. Fig. 7 shows the relationship between L-B and SNR after pulse compression in simulation.
[image:6.612.125.489.350.562.2]Figure 7. Relationship between L-B and SNR after Pulse Compression.
Conclusions
Results of simulation show that phase truncation spurs of LFM signal mainly reduce the SNR after pulse compression. In addition, the extent of this impact varies with L-B to some degree and
L-B >10
could ensure that the signal process not be affected by phase truncation in DDS. This conclusion will provide proper reference on the choice of parameters in radar systems.References
[1] Kiran Patel, Usha Neelakantan, Shalini Gangele, J.G Vacchani, N.M. Desai, Linear Frequency Modulation Waveform Synthesis, C. IEEE Students' Conference on Electrical, Electronics and Computer Science. (2012) 1-4.
[2] Fernando Martin Porqueras, Albert Aguasca Sole, Antoni Broquetas Ibars, Performance Study of Quantized Linear Frequency Modulated signals and its application to CW radars, C. 3rd European Radar Conference. (2006) 100-103.
[3] Ren-hong Xie, Xiang-quan Shi, Novel analysis method for the spurious spectrum of direct digital frequency synthesizer in the presence of phase truncation, J. Journal of Systems Engineering and Electronics. 2 (2005) 301-304.
[4] H.T. Nicholas, H. Samueli, An analysis of the output spectrum of direct digital frequency synthesiers in the presence of phase accumulator truncation. C. 41st Annual Symposium on Frequency Control. (1987) 495-502.
[5] D. De Caro, E. Napoli, A.G.M. Strollo, Direct digital frequency synthesizers with polynomial hyperfolding technique, J. IEEE Transactions on Circuits and Systems II: Express Briefs. 51 (2004) 337-344.