5
XI
November 2017
“Nonlinear Flexural behavior of Post Tensioned
Beam”
Ajinkya S. Dixit1, V.G. Khurd2
1
Student of P.G., M.E. Civil,-Structure Sanjay Ghodawat Institutions, Atigre,Shivaji University, Kolhapur, India 2
Assistant Professor, Civil Engg. Department, Sanjay Ghodawat Institutions, Atigre, Shivaji University, Kolhapur, India
Abstract: Analysis of a post tensioned concrete beam or determination of physical properties such as deflection, stress distribution under a two-point loading. For analysis purpose ANSYS V15.0 package program is used as a Finite Element Analysis tool. The main objective of this study was to develop three dimensional finite element modeling (3D-FEM) of Post Tensioned Concrete Beam that can be used to investigate the nonlinear response. The accuracy of the results obtained from nonlinear static analysis using ANSYS is validated by comparing it with previous literature study.
Keywords: 3D-FE, static analysis,
I. INTRODUCTION
Concrete structural components exist in buildings and bridges in different forms. Understanding the response of these components during loading is crucial to the development of an overall efficient and safe structure. In Prestressed concrete members, stresses are induced during the construction in such a way that they can resist stresses caused by externally applied loads. Prestressed concrete is most suitable for long span structural elements like beams and girders, where larger bending moment results in greater depth of beam or girder. (Chouragade, M., 2013)
Experimental based testing has been widely used as a means to analyze individual elements and the effects of concrete strength under loading. While this is a method that produces real life response, it is extremely time consuming, and the use of materials can be quite costly. (Kasat, A.S., and Varghese, V., 2012). There are a number of approaches for the study of the behaviour of concrete structures, viz., experimental, numerical, theoretical, etc. Finite Element Analysis (FEA) is a numerical one which provides a tool that can accurately simulate the behaviour of concrete structures. ( Joshuva, N. R.,et al., 2014)
The use of computer software to model structural elements is much faster, and extremely cost-effective. To fully understand the capabilities of finite element computer software, one must look back to experimental data and simple analysis
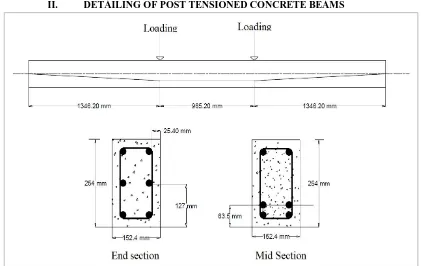
II. DETAILING OF POST TENSIONED CONCRETE BEAMS
[image:2.612.119.540.456.722.2]`
Figure 2. Stirrup detail for post-tensioned concrete beams (Kim, U., et al. 2010,)
The Post tensioned concrete beams were modeled in ANSYS workbench. The size and loading case is same as mentioned in paper “Nonlinear Finite Element Analysis of Unbonded Post Tensioned Concrete Beam”by Kim, U., Chakrabarti, P. R., & Choi, J. H.,
III. MATERIAL PROPERTIES
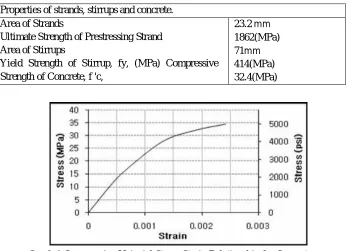
The engineering data of new materials for the project can be input or edited in this. M35 grade of concrete and Fe 415 grade of steel is chosen for the beam specimens. ANSYS automatically defines the material properties as per the selected grade of concrete steel, and high tension wire.In the longitudinal direction, 2 numbers of 9.53mm diameter rods were used in the tension side and 2 numbers of 9.53mm diameter rods were used in the compression side. 5.43mm stirrups at 140mm c/c were used in the transverse direction. The steel for the finite element models has been assumed to be an elastic-perfectly plastic material and identical in tension and compression.
Table1. Properties of strands, stirrups and concrete
Graph 1.Compressive Uniaxial Stress-Strain Relationship for Concrete
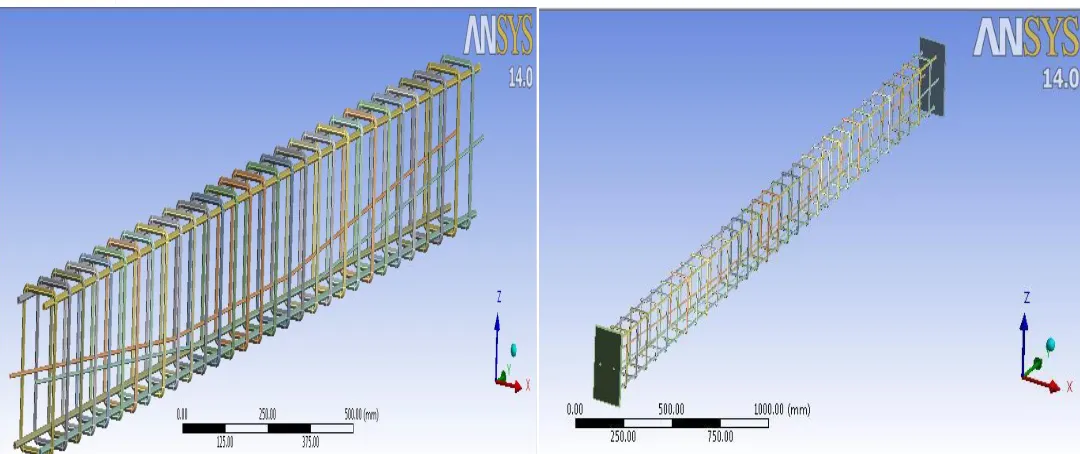
This section explains the material properties of the post-tensioned concrete beams. The complete stress-strain history for concrete subjected to uniaxial compression provides data for use in characterizing the response of concrete to general loading Graph 1 shows the stress-strain curve of the concrete. The value used for the uniaxial tensile cracking stress of concrete was 3.6 MPa (520 psi). During the analysis, if the tensile stress was over 3.6 MPa, cracking would begin to appear. The ANSYS model of the beam specimens with reinforcement is shown in Figure 1 and 2
Material properties of the strands were input as multi-linear isotropic material properties. Graph 2 illustrates the stress-strain curve of the strands.
Properties of strands, stirrups and concrete. Area of Strands
Ultimate Strength of Prestressing Strand Area of Stirrups
Yield Strength of Stirrup, fy, (MPa) Compressive Strength of Concrete, f 'c,
23.2 mm
1862(MPa)
71mm
Graph 2. Stress strain curve for high tensioned wire
For prestressed concrete member’s high strength steel generally of wires, bars or strands. The wires which are individually or in wire cables are generally from 3 to 8mm in diameter. The strands which are used in nominal diameter from 10 to 44 mm
Graph 3.Stress-Strain Curve for Stirrup and Rebar
Graph 3.Stress strain curve forstirrups and rebar’s
Graph 3 shows the stress-strain curve of the stirrups and rebar’s as bilinear isotropic material properties. The stress-strain behavior for concrete steel bar and high tensioned wire was given as per paper. Normalized stress-strain values were calculated by dividing each stress value by the peak stress and dividing each strain value by strain at peak stress. From the normalized stress-strain values of mixes, the average normalized stress-strain curves obtained. The software allows us to define stress-strain diagrams, to control the linear or non-linear behavior of the material and to select the activation time of the material.
IV. MODELLING OF THE STRUCTURE
For the analysis, the post tensioned beam is being modelled as shown in figure. The beam is simply supported at the ends. Before modeling the structure, it is important to define the unit’s system that is going to be used. The unit system used will be the following:
a) Length: meter (m) b) Force: Kilo-Newton (KN)
[image:4.612.182.441.78.213.2]The beam is located in the X-Z plane. And longitudinal length is along the Y direction. The gravity loads act along the Z direction. Hence deflection and bending moments are along Z direction respectively. As shown in figure 3
Figure 4. Stirrups, Bars and Wire connection Figure 5. Placement of Stirrups, Bars and Wire connection
A. Finite Element Discretization
Figure6. Meshing with 4 noded tetrahedral elementFigure 7. Meshing of bar stirrup and wire
A finite element analysis requires meshing of the model. An important step in finite element modelling is the selection of the mesh density. A convergence of results is obtained when an adequate number of elements are used in a model. This is practically achieved when an increase in the mesh density has a negligible effect on the results. This properly sets the width and length of elements in the plates to be consistent with the elements and nodes in the concrete portions of the model.
The numbering control command is used to merge all the items to make it as a single entity. Very fine size was chosen to get more accurate results. The meshed model of the beam specimen is shown in Figure 6 and 7
V. BOUNDARY CONDITIONS
Boundary conditions are required to get a proper solution for the model. Displacement boundary conditions were assigned similar to the experimental set up so as to constrain the model to get a unique solution. One end of the beam had hinged support and the other end had a roller support as shown in figure 8 below
Figure8. Boundary condition
The finite element model of the beam with loads is shown in Figure 6 and 8 The analysis type chosen was static. The beam specimens were analyzed at various load increments until failure load
In order for the nonlinear analysis to be done accurately, the loads are required to have a gradual application, and the nonlinear analysis also requires handling of solution controls. Two point loadings were applied in small incremental loads on beam using the load step and sub step
A. Load steps, Sub steps and Time
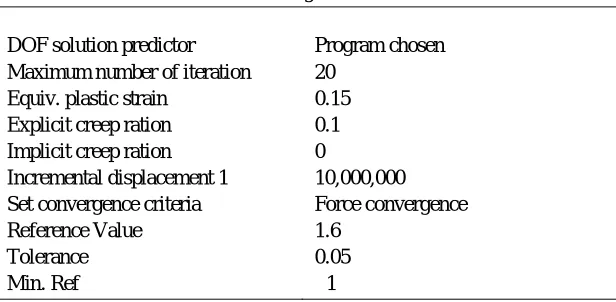
For a nonlinear analysis, the total load is subdivided into a series of load increments and applied. A typical load history has been described in terms of loadsteps, substeps and time. At the completion of each solution for the given incremental load, the stiffness matrix of the model is adjusted to reflect the nonlinear (incrementally linear) changes in structural stiffness before proceeding to the next load increment. gradual application, and the nonlinear analysis also requires handling of solution controls. Two point loadings were applied in small incremental loads on beam using the load step and sub step The automatic time stepping facility available in the ANSYS software package is utilized to predict and control the loadstep sizes. Table 2 and Table 3 shows the Solution control for obtaining nonlinear response of beam.
Table2. Basic Solution Control
Analysis options Small displacement
Calculate prestress effects Off
Automatic time stepping On On
Time at end of loadstep 0
Number of substeps 50
Max no. of substeps 100
Min no. of substeps 10
Write items to results file All solution items
Frequency Write every Substeps
becomes difficult to converge. So The loads are applied gradually with small load increments. The Automatic time stepping will bisect the load until it is equal to the minimum load step size
In order for the nonlinear analysis to be done accurately, the loads are required to have a gradual application, and the nonlinear analysis also requires handling of solution controls
Table3. Nonlinear convergence for solution control.
DOF solution predictor Program chosen
Maximum number of iteration 20
Equiv. plastic strain 0.15
Explicit creep ration 0.1
Implicit creep ration 0
Incremental displacement 1 10,000,000
Set convergence criteria Force convergence
Reference Value 1.6
Tolerance 0.05
Min. Ref −1
[image:7.612.153.461.148.299.2]Two point loadings were applied in small incremental loads on beam using the loadstep and sub step as shown in figure 9 and 10
Figure 9. Loading applied on beam in case I Figure 10. Loading applied on beam in case II
For obtaining the nonlinear solution for given loading in analysis setting result is setfor large deflection on and solution is run for nonlinear solution control.
VI. DETERMINATION OF NONLINEAR FLEXURAL RESPONSES OF BEAM
A. By Using Software
The beam is pinned at one end and roller support. Since all material properties, cross sectional properties, loads and boundary conditions have been defined, the beam can now be analyzed. The software ANSYS gave the following results.
[image:8.612.81.517.144.471.2]Loading –load increment is as below prestressing force -31.1KNprestressing force -15.1KN
Table 4. load increment I Table 5. load increment II S.r No Incremental
load
Prestressing force(KN)
1 18,014N 31.1KN
2 26,243N 31.1KN
3 34,250N 31.1KN
[image:8.612.133.493.494.718.2]Loadingcase1-For1stmodel Loading case 2 -For 2nd model
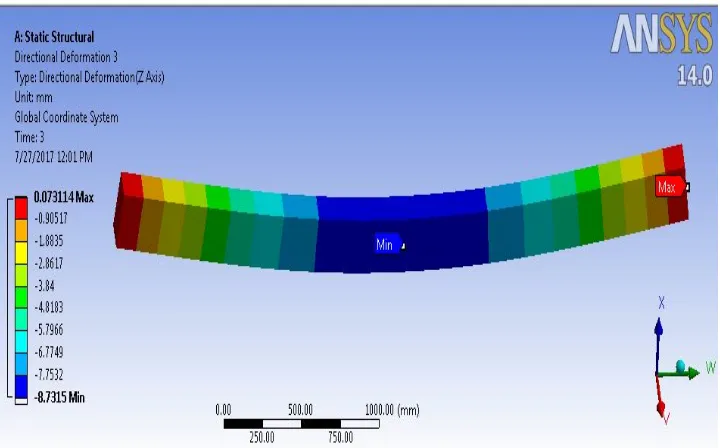
Figure 11. Deflection of beam for loading 18,014N and prestressing force 31.1KN
Figure 12. Deflection of beam for loading 26, 243N and prestressing force 31.1KN S.r No Incremental
load
Prestressing force(KN)
1 15,568N 15.1KN
2 23,130N 15.1KN
Figure 13. Deflection of beam for loading 34,250N and prestressing force 31.1KN
Figure 14. Deflection of beam for loading 15,568N and prestressing force 15.1KN
[image:9.612.82.538.528.715.2]Figure 16. Deflection of beam for loading 28956N and prestressing force 15.1KN
VII. COMPARISON OF DEFLECTION OF BEAM WITH PREVIOUS STUDY
[image:10.612.306.542.531.626.2] [image:10.612.35.292.538.627.2]In previous literature paper “Nonlinear Finite Element Analysis of Unbonded Post Tensioned Concrete Beam “by Kim, U., et al.2010, has developed a sophisticated 3-D finite element model for simulating the nonlinear flexural behavior of unbounded post-tensioned beams, and compared analysis results with experimental results to verify the accuracy of the developed 3-D finite element model, and investigated the effects of various prestressing forces on the flexural behavior of tensioned beams. Four post-tensioned beams were tested at the structures laboratory of California State University, Fullerton and the test results were compared with the analysis results obtained using Ansys.
Table 6. Literature result for beam I Table 7. Literature result for beam II
Beam model I-Prestressing Force -31.1KN Beam model II-Prestressing Force -15.1KN
The observation of ANSYS result and previous literature result study is as below
The deflection developed in the post tensioned beam under loading condition are observed for Nonlinear analysis for incremental loading condition to get actual nonlinear response of beam ANSYS solution the obtained result for fully prestressing condition (prestressing force 31.1KN) and partial prestressing condition (prestressing force 15.1KN) are compared and plotted as below Percent difference of load-displacement between actual test
and ANSYS for beam I
Displacement 2.5mm 12.7mm 22.9mm
Load (ANSYS) 18,014 26,243 34250
Load (TEST) 13,122 26,688 33,805
Difference 27.16% 1.67% 1.3%
Percent difference of load-displacement between actual test and ANSYS for beam 2
Displacement 2.5mm 12.7mm 17.9mm
Load (ANSYS)
15,568 23,130 28,956
Load (TEST) 10.008 22,018 27,527
Graph 4.Comparison of deflection in post tensioned beam between ANSYS and Previous literature result
Graph 5.Comparison of deflection in post tensioned beam between ANSYS and Previous literature result
VIII. CONCLUSION
In the present work, three dimensional finite element analysis of post-tensioned concrete beam using commercial software ANSYS is presented. From study following conclusion can be drawn
The results of the fully prestressing case (31.1 KN) and the partial prestressing force (15.1KN) for post-tensioned concrete beams.
A. Results obtained for nonlinear analysis of post tensioned beam is validated by comparing it with previous literature study. The result reveals the response obtained by Ansys for nonlinear analysis are close to literature study for given loading condition and deflection.
B. The initial behaviour for first loading shows close agreement in deflection than the remaining load cases it was due to difference in convergence criteria for nonlinear analysis and due to mesh density
REFERENCES
[1] Barbosa, A.F., Ribeiro, G.O., “Analysis of reinforced concrete structures using ANSYS nonlinear concrete model” In: Idelsohn, S., Onate, E., and Dvorkin, E. (Eds.), Computational Mechanics: New trends andapplications, pp. 1-7, 1998
[2] Dawari, V. B.,and Vesmawala, G. R., “Application Of Nonlinear Concrete Model For Finite Element Analysis Of Reinforced Concrete Beam” International Journal of Scientific & Engineering Research, Volume 5, Issue 9, September-(2014)
[3] ISSN 2229-5518 Fanning, P., “Nonlinear Models of Reinforced and Post-tensioned Concrete Beams”, Electronic Journal of Structural Engineering,vol 2 (2001), pages (111-119)
[4] Gupta, P. K.,and Khapre, R. N.,“A Study On Development Of Stresses In Anchorage Zone Using Parallel Processing” Asian Journal Of Civil Engineering (Building And Housing) Vol. 9, No. 1 (2008) Pages 47-59
[5] Joshuva, N. R., Saibabu, S., Sakaria, E. P., Lakshmikandhan, K. N., Sivakumar, P., “Finite Element Analysis of Reinforced and Pre-Tensioned Concrete Beams” International Journal of Emerging Technology and Advanced Engineering ,ISSN 2250-2459, Volume 4, Issue 10, (October 2014)
[6] Kaewunruen. S., Remennikov. A., “Nonlinear finite element modelling of railway prestressed concrete sleeper” Faculty of Engineering and information Science 2006
2.51 8.73 16.36 2.5 12.2 22.9 0 5 10 15 20 25
18014 N 26243 N 34250 N
D ef le ct io n i n m m Load
Beam result for prestressing force 31.1KN
ANSYS result Previous litreture result
2.29 7.64 13.09 2.5 12.7 17.9 0 10 20
15568N 23130 N 28956 N
D ef le ct io n i n m m
Load in N
Beam result for prestressing force 15.1KN
[7] Kang,T., Huang,Y.,“Computer Modeling of Post-Tensioned Structures” International Conference on Computer Modeling and Simulation IPCSIT vol.22 (2012) Singapore
[8] Kasat, A.S., varghese, V., “finite element analysis of prestressed concrete beams” International journal of advanced technology in civil engineering,issn: 2231 –5721, volume-1, issue-3, 2012
[9] Kim, U., Chakrabarti, P. R., & Choi, J. H., “Nonlinear finite element analysis of unbonded post-tensioned concrete beams” Challenges, Opportunities and Solutions in Structural Engineering and Construction – Ghafoori (ed.) 2010 Taylor & Francis Group, London, ISBN 978-0-415-56809-8
[10]Kote, P. B., Patil, S. P., Sangle, K. K.,“Finite Element analysis of Prestressed Beam”, International Journal of Advance Foundation and Research in Science & Engineering ,Volume 1, Issue 3, August 2014.
[11]Lou,T., Xiang, Y., “Finite element modeling of concrete beams prestressed with external tendons” Engineering Structures 28 (2006)
[12]Maroliya, M. K., “Comparative Study Of Flexural Behaviour Of Reinforced Concrete Beam And Prestressed Concrete Beam” International Journal of Engineering Research and Applications (IJERA) ISSN: 2248-9622 Vol. 2, Issue 6, November- December 2012,
[13]Markovic, M., Krauberger, N., Saje, M., Planinc ,I., Bratina, S., “Non-linear analysis of pre-tensioned concrete planar beams” Engineering Structures 46 (2013) 279–293
[14]Naghipour, M., Nemati, M., Doostdar,H. M., “Experimental study and modeling of reinforced concrete beams strengthened by post-tensioned external reinforcing bars” International Journal of Engineering Transactions A: Basics Vol. 23, No. 2, April 2010 – 127
[15]Yapar, O., Basu ,p. k., Nordendale N., “Accurate finite element modeling of pretensioned prestressed concrete beams” Engineering Structures 101 (2015) 163–178
A. Standard Codes
1) IS1343, “Code of practice for prestress concrete”, Second Revision.
2) IS 456-2000. “Indian Standard Plain and Reinforced Concrete – Code of Practice”, Fourth Revision.
B. Books
1) N Krishna Raju “Prestressed Concrete” Fourth Edition Tata McGraw-Hill, New Delhi, 2011