CLSI Methods Development and Standardization Working
Group Best Practices for Evaluation of Antimicrobial
Susceptibility Tests
Romney M. Humphries,aJane Ambler,bStephanie L. Mitchell,cMariana Castanheira,dTanis Dingle,e,fJanet A. Hindler,g Laura Koeth,hKatherine Sei,ion behalf of the CLSI Methods Development and Standardization Working Group of the Subcommittee on Antimicrobial Susceptibility Testing
aAccelerate Diagnostics, Tucson, Arizona, USA
bWockhardt, Morton Grove Pharmaceuticals, Morton Grove, Illinois, USA
cClinical Microbiology Laboratory, Children's Hospital of Pittsburgh of UPMC and University of Pittsburgh School of Medicine, Pittsburgh, Pennsylvania, USA
dJMI Laboratories, North Liberty, Iowa, USA
eProvincial Laboratory for Public Health, Edmonton, Alberta, Canada
fDepartment of Laboratory Medicine and Pathology, University of Alberta, Edmonton, Alberta, Canada
gDepartment of Pathology & Laboratory Medicine, University of California, Los Angeles, Los Angeles, California, USA
hLaboratory Specialists, Inc., Westlake, Ohio, USA
iBeckman-Coulter, West Sacramento, California, USA
ABSTRACT Effective evaluations of antimicrobial susceptibility tests (ASTs) require robust study design. The Clinical and Laboratory Standards Institute (CLSI) Subcom-mittee on Antimicrobial Susceptibility Testing has recognized that many published studies reporting the performance of commercial ASTs (cASTs) suffer from major de-sign and/or analysis flaws, rendering the results difficult or impossible to interpret. This minireview outlines the current consensus of the Methods Development and Standardization Working Group of the CLSI Subcommittee on Antimicrobial Suscepti-bility Testing regarding best practices for systematic evaluation of the performance of an AST, including the analysis and presentation of essential data intended for publication.
KEYWORDS antimicrobial susceptibility testing, CLSI, evaluations
N
umerous methods exist for thein vitroassessment of antimicrobial susceptibility of microorganisms. Traditionally, susceptibility is determined by evaluating the inhi-bition of growth of a microorganism by an antibiotic, when that microorganism is isolated in pure culture. Newer technologies infer antimicrobial resistance by detecting the presence of resistance genes or by evaluating the phenotypic response of the microorganism to antibiotic(s) directly in a clinical specimen. The accuracy of these methods is paramount for confronting antimicrobial resistance. Therefore, many inves-tigators desire to evaluate and to report on the performance of new or reformulated commercial antimicrobial susceptibility tests (cASTs).The U.S. Food and Drug Administration (FDA) requires that cAST manufacturers establish the performance of each antimicrobial agent included in their systems and provide data demonstrating “substantial equivalence” of the cAST to a reference standard method. U.S. regulations (Clinical Laboratory Improvement Amendments of 2003) stipulate that laboratories must further verify the performance of FDA-cleared cASTs prior to use for patient care at their institution. Conducting verification studies is both labor and resource intensive, particularly for smaller laboratories with limited
Accepted manuscript posted online24 January 2018
CitationHumphries RM, Ambler J, Mitchell SL, Castanheira M, Dingle T, Hindler JA, Koeth L, Sei K, on behalf of the CLSI Methods Development and Standardization Working Group of the Subcommittee on Antimicrobial Susceptibility Testing. 2018. CLSI Methods Development and Standardization Working Group best practices for evaluation of antimicrobial susceptibility tests. J Clin Microbiol 56:e01934-17.https://doi .org/10.1128/JCM.01934-17.
EditorColleen Suzanne Kraft, Emory University Copyright© 2018 American Society for Microbiology.All Rights Reserved.
Address correspondence to Romney M. Humphries, [email protected].
crossm
on May 16, 2020 by guest
http://jcm.asm.org/
resources. Consequently, laboratories are more likely to verify and to implement cASTs that demonstrate a high probability of satisfactory performance and to avoid those for which poor performance has been reported by colleagues or in publications. Unfortu-nately, evaluations of antimicrobial susceptibility tests (ASTs) published in the literature are often conducted using substandard methodology. Laboratory directors have re-ported to the Clinical and Laboratory Standards Institute (CLSI) that one reason for delaying the implementation of cASTs for new antibiotics is concern regarding their performance, as documented in scientific abstracts or publications. Some of those studies documented erroneous issues with AST devices, due to poor study design (CLSI, unpublished data). Such delays tremendously limit the ability of physicians to treat patients with life-threatening infections effectively and hamper public health responses to halt the spread of antimicrobial resistance. Similarly, delays in the implementation of current CLSI breakpoints, such as revised carbapenem breakpoints for Enterobacteria-ceae in 2010 (1), have been shown to facilitate the spread of carbapenem-resistant
Enterobacteriaceae(2).
As part of the collaborative efforts to improve timely access to FDA-cleared cASTs for new antimicrobial agents, the CLSI Subcommittee on Antimicrobial Susceptibil-ity Testing formed an ad hoc working group (ahWG) to assist the coordinated development of new antimicrobials and cASTs. This ahWG has recognized that some studies reporting the performance characteristics of cASTs in the literature suffer from major design and/or analysis flaws, rendering the results difficult or impossible to interpret at the least and misleading at the worst. To address this issue, the ahWG has developed the present consensus standards on the minimum study design requirements for conducting a systematic performance evaluation of a cAST, either as a whole system or for an individual antimicrobial. This document is not intended as a laboratorian guide for verification studies, as that already exists in the M52 guideline (3) and such studies typically require a smaller study than that described herein.
STUDY DESIGN
Reference susceptibility test methods.cAST results should be compared to those obtained by the CLSI broth microdilution (BMD) reference method (4), as the gold standard. While agar dilution (AD) and disk diffusion (DD) (5) are also CLSI reference methods, both were developed against BMD. BMD is used as the comparator for cASTs for U.S. FDA 510(k) applications. Molecular detection of a resistance gene may serve as the gold standard for resistance in only two scenarios, namely, detection ofmecAor
mecCto define methicillin resistance in staphylococci and detection ofvanAorvanBto detect vancomycin resistance in enterococci and staphylococci. Resistance in other species, particularly Gram-negative bacteria, is multifactorial and is rarely defined by single (or even multiple) molecular targets. DD may be used as the reference method in cAST evaluations if it is the CLSI reference method to evaluate a specific resistance mechanism (e.g., inducible clindamycin resistance evaluated by the D-zone test). However, investigators must remain cognizant that the performance characteristics of commercial FDA-cleared disks may differ significantly across manufacturers. A second exception to the use of BMD is for fosfomycin testing or testing ofNeisseria gonor-rhoeae, for which AD is the reference method, due to technical difficulties associated with BMD in these scenarios (6).
Use of BMD as the comparator method is complicated by the fact that very few laboratories have experience in making BMD panels and performing the test, as outlined in the M07 standard (4). Details of BMD reference testing that should be included in Materials and Methods are listed in Table 1. Careful description of the BMD method used in the investigation is paramount to future applicability of the cAST evaluation data. Simply stating that BMD was performed according to the M07 stan-dard is not acceptable, because information such as descriptions of the medium source, the antimicrobial source, and the methods used to prepare inocula for BMD needs to be included. If any deviations from the M07 standard are made, then they must be
on May 16, 2020 by guest
http://jcm.asm.org/
disclosed and the rationale for the deviations described. MIC determinations using automated cAST systems (MicroScan [Beckman Coulter, Sacramento, CA], Phoenix [BD, Sparks, MD], Sensititre [Thermo Scientific, Lenexa, KS], or Vitek 2 [bioMérieux, Durham, NC]), gradient diffusion strips (Etest [bioMérieux] or MTS [Liofilchem, Waltham, MA]), or lyophilized BMD panels (MicroScan or Sensititre) are not acceptable substitutes for BMD, since these commercial products are correlated to BMD and may be calibrated to best match the reference BMD but not necessarily the cAST under evaluation.
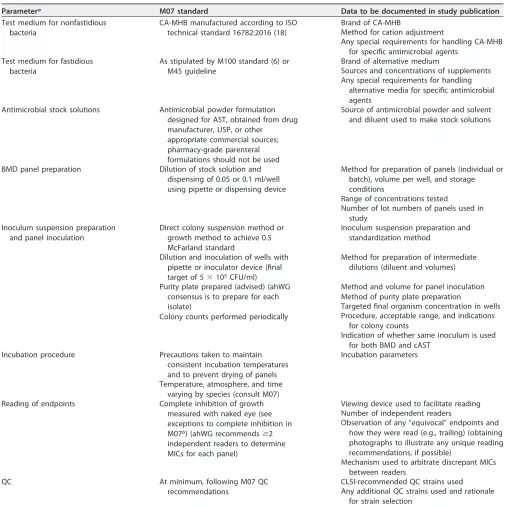
[image:3.585.40.551.79.585.2]Challenge isolates.When evaluating a cAST, careful consideration should be given to the isolates selected for study. Frequently, investigators are interested in evaluating TABLE 1Variables to be detailed in Materials and Methods for CLSI BMD reference method
Parametera M07 standard Data to be documented in study publication
Test medium for nonfastidious bacteria
CA-MHB manufactured according to ISO technical standard 16782:2016 (18)
Brand of CA-MHB
Method for cation adjustment
Any special requirements for handling CA-MHB for specific antimicrobial agents
Test medium for fastidious bacteria
As stipulated by M100 standard (6) or M45 guideline
Brand of alternative medium
Sources and concentrations of supplements Any special requirements for handling
alternative media for specific antimicrobial agents
Antimicrobial stock solutions Antimicrobial powder formulation designed for AST, obtained from drug manufacturer, USP, or other
appropriate commercial sources; pharmacy-grade parenteral formulations should not be used
Source of antimicrobial powder and solvent and diluent used to make stock solutions
BMD panel preparation Dilution of stock solution and
dispensing of 0.05 or 0.1 ml/well using pipette or dispensing device
Method for preparation of panels (individual or batch), volume per well, and storage conditions
Range of concentrations tested
Number of lot numbers of panels used in study
Inoculum suspension preparation and panel inoculation
Direct colony suspension method or growth method to achieve 0.5 McFarland standard
Inoculum suspension preparation and standardization method
Dilution and inoculation of wells with pipette or inoculator device (final target of 5⫻105CFU/ml)
Method for preparation of intermediate dilutions (diluent and volumes)
Purity plate prepared (advised) (ahWG consensus is to prepare for each isolate)
Colony counts performed periodically
Method and volume for panel inoculation Method of purity plate preparation
Targeted final organism concentration in wells Procedure, acceptable range, and indications
for colony counts
Indication of whether same inoculum is used for both BMD and cAST
Incubation procedure Precautions taken to maintain
consistent incubation temperatures and to prevent drying of panels
Incubation parameters
Temperature, atmosphere, and time varying by species (consult M07)
Reading of endpoints Complete inhibition of growth
measured with naked eye (see exceptions to complete inhibition in M07b) (ahWG recommendsⱖ2 independent readers to determine MICs for each panel)
Viewing device used to facilitate reading Number of independent readers
Observation of any “equivocal” endpoints and how they were read (e.g., trailing) (obtaining photographs to illustrate any unique reading recommendations, if possible)
Mechanism used to arbitrate discrepant MICs between readers
QC At minimum, following M07 QC
recommendations
CLSI-recommended QC strains used Any additional QC strains used and rationale
for strain selection
aCA-MHB, cation-adjusted Mueller-Hinton broth; ISO, International Organization for Standardization; USP, U.S. Pharmacopeia; BMD, broth microdilution; cAST,
commercial antimicrobial susceptibility test; ahWG,ad hocworking group; CLSI, Clinical and Laboratory Standards Institute; QC, quality control.
bExceptions include the evaluation of trimethoprim-sulfamethoxazole, where 80% growth inhibition is read as the endpoint.
on May 16, 2020 by guest
http://jcm.asm.org/
the performance of a cAST for a specific resistance phenotype. Consideration should be given to whether such isolates are clonal, especially if they were collected at a single institution or at institutions within a single region. Additionally, isolate storage condi-tions are an important parameter to document, as resistance mechanisms, particularly plasmid-borne resistance determinants, may be lost under suboptimal storage condi-tions. In general, the ahWG recommends storage of isolates at⫺70°C to⫺80°C, in 20% glycerol or another suitable storage medium. For certain resistance phenotypes, such as those involving plasmid-borne-lactamases, subculturing of isolates from frozen stocks with concomitant selective pressure (e.g., placing a meropenem disk in the first quadrant of a subculture from frozen stock to maintain carbapenemase expression) may aid in maintaining the desired phenotype.
Studies that enrich for isolates with MICs outside the normal distribution, while clinically useful, should be undertaken with the understanding that these evaluations invariably result in error rates higher than those generally considered acceptable, as described further below. Testing of a minimum of 100 isolates is recommended for each group of organisms, as defined by CLSI M100 categorization (6), that are consid-ered relevant to the clinical use of the antimicrobial agent and for which interpretive criteria exist (7). For example, an evaluation of 100Enterobacteriaceaeisolates and 100
Pseudomonas aeruginosaisolates would be sufficient for a novel-lactam/-lactamase inhibitor AST targeted for Gram-negative bacteria. When evaluating new or novel technologies, pilot studies that include fewer challenge isolates may be appropriate.
Testing parameters.When performing a cAST evaluation, it is critical that both the reference method (BMD) and the cAST method under evaluation be performed in parallel, using the same inocula, to ensure that the same population of bacteria is evaluated. Reliance on previously determined MIC data obtained at the time of isolation, or from another laboratory, is not acceptable, as isolate MICs may shift during storage, including loss of resistance. For example, colistin MICs for P. aeruginosa,
Klebsiella pneumoniae, andAcinetobacter baumanniihave been shown to decrease from a resistant/non-wild-type phenotype to a susceptible/wild-type phenotype after frozen storage (8). Similarly, vancomycin MICs forStaphylococcus aureushave been shown to decrease after 1 year of frozen storage (9). Details to be included in Materials and Methods for the evaluation, regarding how the cAST was performed, are outlined in Table 2.
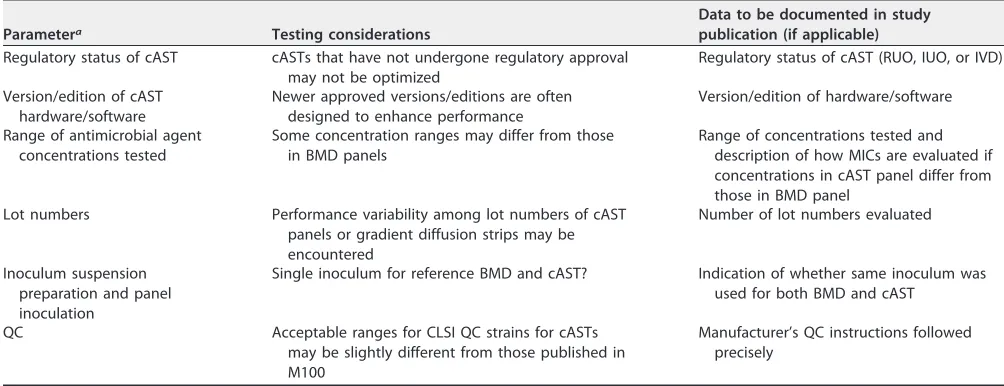
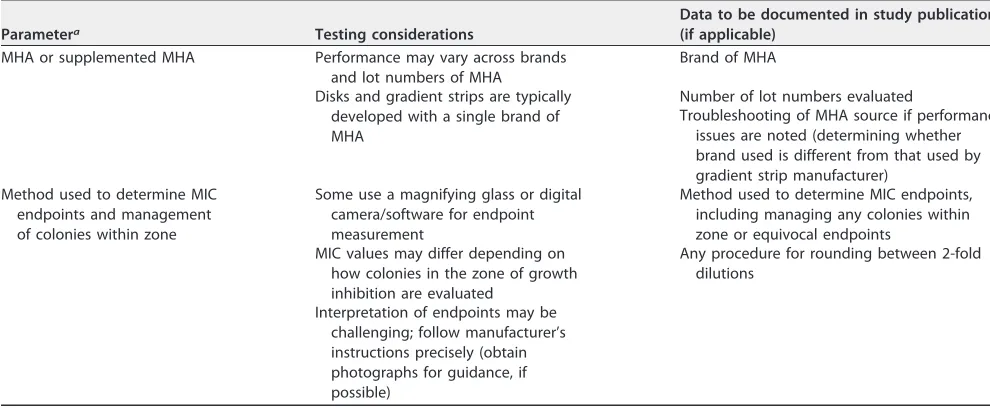
Special considerations for evaluation of disks and gradient strips.Due to the manual testing nature of DD and gradient strip ASTs, special considerations must be used when evaluating these tests (Table 3). Several commercial sources of Mueller-TABLE 2Variables to be detailed in Materials and Methods for the cAST under evaluation
Parametera Testing considerations
Data to be documented in study publication (if applicable) Regulatory status of cAST cASTs that have not undergone regulatory approval
may not be optimized
Regulatory status of cAST (RUO, IUO, or IVD)
Version/edition of cAST hardware/software
Newer approved versions/editions are often designed to enhance performance
Version/edition of hardware/software
Range of antimicrobial agent concentrations tested
Some concentration ranges may differ from those in BMD panels
Range of concentrations tested and description of how MICs are evaluated if concentrations in cAST panel differ from those in BMD panel
Lot numbers Performance variability among lot numbers of cAST
panels or gradient diffusion strips may be encountered
Number of lot numbers evaluated
Inoculum suspension preparation and panel inoculation
Single inoculum for reference BMD and cAST? Indication of whether same inoculum was used for both BMD and cAST
QC Acceptable ranges for CLSI QC strains for cASTs
may be slightly different from those published in M100
Manufacturer’s QC instructions followed precisely
acAST, commercial antimicrobial susceptibility test; RUO, research use only; IUO, investigational use only; IVD,in vitrodiagnostic; QC, quality control.
on May 16, 2020 by guest
http://jcm.asm.org/
[image:4.585.40.542.83.276.2]Hinton agar (MHA) are available, and the performance of disks and gradient strips has been shown to vary across MHA brands (10, 11). Careful consideration should be given to evaluating disks and gradient strips using more than one brand of MHA. At a minimum, if performance issues are found, then evaluation of the tests with the MHA brand used by the cAST manufacturer during development, in consultation with the cAST manufacturer, should be considered, to determine whether the performance issues are related to the MHA brand. In any case, the brand of MHA must be clearly stipulated in Materials and Methods.
Evaluation of endpoints for disks and MIC gradient strips often varies across labo-ratories, with some laboratories using a magnifying glass or digital imaging to evaluate zones or ellipses of inhibition. The method used for evaluation (with the naked eye, a magnifying glass, or a digital camera) should be clearly documented in the description of the evaluation. Additionally, the use of reflected light (recommended for all antimi-crobials except the oxazolidinones) or transmitted light (5) and the side of the MHA plate from which zones of inhibition are evaluated (the bottom is recommended) should be described. It is not unusual to observe colonies of growth within the zone or ellipse of growth inhibition or to observe unusual ellipses that are difficult to interpret with gradient strip tests. How endpoints are evaluated should be determined prior to evaluation and described clearly in the publication. In general, the CLSI recommends reading the inner zone of complete growth inhibition for DD, with some exceptions (e.g., trimethoprim-sulfamethoxazole) (5). Evaluation of endpoints is one parameter that may be affected by a change from research use only (RUO) to FDA-clearedin vitro
diagnostic (IVD) status for a disk or strip, in that manufacturers may have very specific instructions on how to evaluate endpoints for disks or strips in the instructions for use of the IVD product that are lacking for RUO tests.
EVALUATION OF RESULTS
[image:5.585.41.536.83.287.2]Performance specifications for cAST methods are defined by accuracy, error rates, and, in some instances, precision. In general terms, accuracy is defined as the closeness of the result obtained with the test under evaluation to the true value (i.e., agreement). In the context of AST, however, a “true” value or MIC is a misnomer, as inherent variability can exist, even with reference BMD, across replicate MIC values measured for a single isolate. For this reason, careful review of all discrepancies between the cAST under evaluation and the reference method is necessary, as described further below. Additionally, evaluation of the reproducibility of MICs for these isolates should be considered.
TABLE 3Additional variables to be detailed when cAST method is gradient strip or disk diffusion method
Parametera Testing considerations
Data to be documented in study publication (if applicable)
MHA or supplemented MHA Performance may vary across brands
and lot numbers of MHA
Brand of MHA
Disks and gradient strips are typically developed with a single brand of MHA
Number of lot numbers evaluated
Troubleshooting of MHA source if performance issues are noted (determining whether brand used is different from that used by gradient strip manufacturer)
Method used to determine MIC endpoints and management of colonies within zone
Some use a magnifying glass or digital camera/software for endpoint measurement
Method used to determine MIC endpoints, including managing any colonies within zone or equivocal endpoints
MIC values may differ depending on how colonies in the zone of growth inhibition are evaluated
Any procedure for rounding between 2-fold dilutions
Interpretation of endpoints may be challenging; follow manufacturer’s instructions precisely (obtain photographs for guidance, if possible)
aMHA, Mueller-Hinton agar.
on May 16, 2020 by guest
http://jcm.asm.org/
Accuracy of cASTs is measured in two ways, namely, categorical agreement (CA) and essential agreement (EA). CA is the total number of isolates tested using the cAST that yielded a MIC result and the same categorical interpretation as the BMD MIC result (i.e., susceptible, intermediate, susceptible dose dependent, resistant, or nonsusceptible) (see Table S1 in the supplemental material). Generally, cAST performance should be ⱖ90% CA. EA is defined as obtaining a MIC value with the cAST under evaluation that is within 1 log2dilution of the reference BMD MIC value (Table S1). EA is applicable only
to AST methods that determine MIC values. As with CA, the acceptable rate for EA is ⱖ90%.
CA discrepancies are subdivided into three types of error (Table S1), i.e., minor errors (mEs), major errors (MEs), and very major errors (VMEs). These errors are based on discrepancies in the MIC values from the reference method and the AST method under evaluation that lead to an interpretative or categorical change, and error rates are reported as percentages. Acceptable mE rates areⱕ10%, and it is valuable to determine the direction of mEs observed (i.e., the tendency of the AST method to read high or low, in comparison to BMD). Acceptable ME and VME rates are typically ⬍3% of the susceptible and resistant isolates tested, respectively. Because VMEs are of the greatest concern (i.e., false susceptibility), the FDA requires⬍1.5% of resistant isolates evaluated to yield VMEs.
In some cases, precision is evaluated for cASTs. Precision is defined as the ability of a test system to provide the same value when the same isolate is tested repeatedly. A cAST method is considered precise if the MIC values obtained for bacterial isolates are within 3 log2 dilutions of each other upon replicate testing. However, recent data
compiled by the CLSI (unpublished data) demonstrate that even reference BMD may not be precise within this range, as some isolates may be inhibited by an antibiotic range ofⱖ4 dilutions, even when tested using the same lot of BMD plates, by the same individual, on the same day. For this reason, any discrepancies observed between the reference method and the AST under evaluation should be carefully evaluated, as they may reflect the natural MIC variability of a challenging isolate.
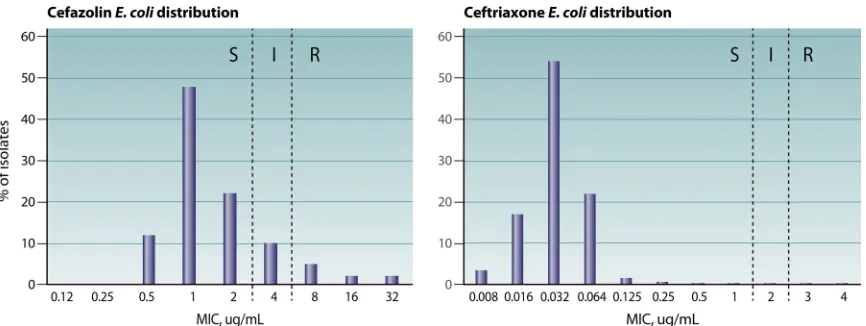
Special considerations for evaluation of AST performance with bacterial pop-ulations enriched with non-wild-type isolates.The emergence and spread of anti-microbial resistance, coupled with more robust methods to establish and to reset breakpoints, invariably result in testing issues that are difficult to resolve for both cAST manufacturers and clinical laboratories. Evaluation of cAST methods in challenging scenarios such as those involving new and emerging resistance mechanisms or break-points that intersect the wild-type population (e.g., as is the case for cefazolin and
Enterobacteriaceae) is paramount. However, such evaluations often result in error rates that are considered unacceptable, if the methods are evaluated using standards designed to assess a population of bacteria in which the wild type predominates and for which the susceptible breakpoint is several dilutions away from the wild-type MIC mode (Fig. 1). There is a directly proportional relationship between the categorical error rate and the percentage of isolates that hover around the intermediate MIC breakpoint by 1 log2 dilution (i.e., intermediate MIC plus 1 log2 dilution and intermediate MIC
minus 1 log2 dilution) or the susceptible/resistant breakpoint (if no intermediate
category is recognized). Therefore, any evaluation of a collection of isolates that differ significantly from the normal distribution of MICs should be carefully assessed using methods that account for the MIC distribution of the isolates evaluated, such as the error-rate-bound method described below. Assessment of whether a collection of isolates reflects the population at large can be made by comparing reference BMD MICs of the isolates evaluated to those published in surveillance studies available from the drug manufacturer or those published at the EUCAST MIC distribution website, if available. If⬎20% of the isolates tested are within 1 log2dilution of the breakpoint(s),
then calculations should be performed using the error-rate-bound method.
Linear regression by the error-rate-bound method is the main approach by which to evaluate AST performance when the population of bacteria tested is enriched with a non-wild-type population (12, 13). Alternatively, more creative methods, such as that
on May 16, 2020 by guest
http://jcm.asm.org/
described by DePalma et al. (14) for DD, whereby a fitted model is used to take into account the proportion of isolates at each MIC, may be used. This method is robust enough that enhancement of the study population with resistant organisms is accounted for in the model and errors caused by this special population are minimized.
The CLSI-endorsed error-rate-bound method that is traditionally used to evaluate disk breakpoints should be considered when the bacterial population evaluated is not binomial. The calculation is performed by dividing the number of errors (mEs, MEs, or VMEs) by the total number of isolates with MICs that are interpreted as intermediate plus isolates with MICs that are 1 log2 dilution higher than the intermediate MIC
(intermediate plus 1) and isolates with MICs that are 1 log2dilution lower than the
intermediate MIC (intermediate minus 1). If the intermediate breakpoint consists of a single MIC value (e.g., MIC of 4g/ml), then the denominator for calculating error rates by the error-rate-bound method would be the total of isolates with MICs of 2, 4, and 8g/ml. If the intermediate breakpoint is a range of MIC values (e.g., MIC of 2 to 4 g/ml), then the denominator for calculating error rates by this method would be the total number of isolates with MIC values of 1, 2, 4, and 8g/ml. For these evaluations, acceptance rates for isolates that yield MIC values interpreted as intermediate differ from the typical accepted error rates (Table S2). If there is no intermediate breakpoint (i.e., only susceptible and resistant interpretative criteria are defined), then the calcu-lation of errors is similar except that the cutoff values between susceptible and resistant are used to allow variations of 1 log2dilution (Table S3).
Investigation of errors.Discrepant results with an AST method versus the refer-ence method can be observed even under ideal conditions (15). Common sources of discrepancies are transcriptional errors, and these should always be evaluated. When discrepancies persist after checking for transcriptional errors, testing should be re-peated for the isolates displaying discordant results (generally only for isolates that yielded VMEs or MEs). Repeat testing is to be performed in duplicate or triplicate by repeating the reference BMD and the AST under evaluation in parallel, with a newly prepared inoculum that is used for both tests (7). While it could be argued that the reference value is “truth,” significant uncontrollable variability exists with the reference BMD method. For example, Bobenchik et al. (16) demonstrated that, in testing of
StaphylococcusandEnterococcusspecies, 38 (84%) of 45 errors observed for the Vitek 2 system, compared to BMD, were due to the initial reference BMD result and were resolved in favor of the Vitek 2 system in repeat testing. In contrast, in testing of
Enterobacteriaceae, the same authors observed that only 6 (29%) of 21 errors were due
FIG 1Cefazolin (left) and ceftriaxone (right) MIC distributions forEscherichia coli(https://mic.eucast.org/Eucast2/SearchController/search .jsp?action⫽performSearch&BeginIndex⫽0&Micdif⫽mic&NumberIndex⫽50&Antib⫽-1&Specium⫽162). Categorical agreement rates are expected to be lower for cefazolin, because the breakpoints bisect the wild-type MIC distribution. S, susceptible; I, intermediate; R, resistant.
on May 16, 2020 by guest
http://jcm.asm.org/
[image:7.585.43.476.70.233.2]to the BMD reference method (17). These results demonstrate the critical need to repeat both the reference and test methods.
When repeat testing resolves the error, the repeat result should be kept as final, as shown in example 1 in Table S4. Similarly, if repeat MIC values are within ⫾1 log2
dilution but a categorical error remains, this should be noted in the results and the error stand. This scenario occurs more often when there is no intermediate breakpoint and/or resistance mechanisms yield MIC values near the breakpoint by the BMD method. These errors should be viewed as less critical, as the test is performing as expected, given the limitations of phenotypic ASTs. If the two repeat MIC results are distinct but one is the same or within⫾1 dilution of the original result, then that value should be selected, as displayed in example 2 in Table S4. Variability such as that observed in example 3 in Table S4 is particularly problematic to resolve, as the exact MIC result is not clearly defined, and this might be a characteristic of the isolate under evaluation when it is tested against a given antimicrobial agent or class. Such variability is more often than not a characteristic of an antimicrobial agent-isolate combination, and such performance issues may represent not a systematic problem with the AST but rather a problem with the isolate under investigation. Triplicate testing can be used; in this case, the MIC is the predominant MIC (2 of 3 values) or the mode.
When discrepant results are due to one result being very distinct from the others, such as in example 4 in Table S4, it is important to ensure that the isolate is in pure culture, by subculturing the growth directly from the AST panel or plate to identify possible contaminants. Confirmatory identification of the subcultured isolate organisms may be necessary.
As noted, if the results from repeat testing are the same (⫾1 log2dilution from the
initial result), then the error stands (Table S4, example 5). However, additional analysis to understand the reason for the discrepancy is advised. In instances in which most errors occur within the same bacterial species, molecular typing methods could be used to investigate whether a particular genetic profile (clone) is responsible for the discor-dant results. Similarly, isolates with the same resistance phenotype should be evaluated for the presence of specific resistance mechanisms that could be at the root of the error. One example is the presence of substitutions in porins that impair the growth of certain strains in broth but not on agar, resulting in a phenotype that appears more resistant with agar-based methods (JMI Laboratories, unpublished data). In all cases, the dis-crepant data should be summarized as part of the study analysis, and consistent application of the rules for the decision within the study is highly advisable.
QUALITY CONTROL
Performing quality control (QC) during a cAST evaluation is just as important as performing QC during patient testing. QC ensures that the reported results accurately reflect the performance of the cAST under evaluation. QC should be performed for both the cAST method and the reference method. QC for AST involves testing a character-ized set of organisms with the AST system to ensure appropriate performance. For cAST systems, the QC procedures and the strains to be used for testing are outlined by the manufacturer. For reference methods, the protocols and strains used for QC should follow CLSI guidelines (6). The QC strains used should be appropriate for the panel or antimicrobial agent being evaluated in the study.
Prior to the start of the evaluation, the new cAST method and the comparator method should pass QC. For commercial systems, a minimum of three replicates (of each QC strain, if applicable) should be tested according to the manufacturer’s recom-mended QC methods. For reference methods, up to nine replicates (of each QC strain, if applicable) should be tested, including at least one QC organism with dilutions on scale with respect to those tested in the study. This is to control for the additional variable of the manufacturing of the BMD panel itself, in addition to the performance of the test. All QC results should be in range before the AST evaluation is performed. If any results are out of range, then additional replicate tests should be performed until
on May 16, 2020 by guest
http://jcm.asm.org/
95% of results are in range. During the AST evaluation, QC frequency is dependent on the length of the evaluation. For evaluation studies lasting less than 3 days, the initial QC testing is sufficient, provided that the study begins immediately following the initial QC testing. For studies lasting longer than 3 days, some form of QC should be performed on each day of testing for all test systems, ensuring at least one on-scale QC value for each antimicrobial tested for each day of testing. Streamlined QC (i.e., QC testing performed weekly instead of daily), as outlined in CLSI documents M02, M07, and M100 or as justified by an individualized QC plan, is generally not appropriate for evaluation studies.
The QC ranges to be used to determine whether QC passes or fails are those defined by cAST manufacturers or the CLSI. A single day of out-of-range results for a given antibiotic does not invalidate the results for the test isolates under evaluation. However, 2 consecutive days of out-of-range results on any test system invalidate the results for those 2 days of testing. If this occurs, an investigation should be initiated to determine the root cause of the issue before the study is restarted. Once the issue is resolved, QC testing and study isolate testing can be resumed. If multiple antibiotics are being evaluated, then only the results for the antibiotic with the QC failure are invalidated. Overall, all QC results should be in range 95% of the time, with no consecutive days being out of range.
When a cAST evaluation is published, the QC methods used for each test system should be outlined in Materials and Methods. It is not necessary to incorporate the QC results in Results for the study; however, an outline of acceptable QC criteria should be included. When study evaluation results are being interpreted, skews (high or low trends) observed in QC results that are in range should not be used to explain biases related to issues such as variability in lots of media, drug concentrations, and other factors; such issues should be studied independently. Any apparent bias in QC results should not be used to explain an overall system bias as long as the QC results are within range at least 95% of the time.
SUMMARY
This document provides a baseline of considerations for evaluating AST devices for publication. As indicated, we caution that this document serves not as guidance for in-house verification studies performed by laboratories prior to implementing the tests but rather as a standard for the quality of evidence required for evaluating the performance characteristics of cASTs. Such evaluations are critical for patient care, as the current regulatory classification of ASTs (class II devices) does not require postmarket review of performance specifications for such devices. While many investigators have evaluated the performance of cASTs for new antimicrobi-als, it is rare that systematic evaluations of the performance of these systems as a whole are performed. Many cASTs were developed years ago, using populations of bacteria that do not reflect the currently circulating strains; therefore, the ahWG encourages the microbiology community to perform and to publish such evalua-tions. Strict adherence to careful study design and results interpretation, as outlined in this document, should serve to make the assessments even more meaningful.
SUPPLEMENTAL MATERIAL
Supplemental material for this article may be found athttps://doi.org/10.1128/JCM .01934-17.
SUPPLEMENTAL FILE 1,PDF file, 0.3 MB.
ACKNOWLEDGMENTS
We thank members of the CLSI Methods Development and Standardization Working Group for critical review. The working group members are Dwight Hardy, Barbara Zimmer, Susan Butler-Wu, Jennifer Dien Bard, Bill Brasso, Ribhi Shawar, Tanis Dingle, Romney Humphries, Katherine Sei, and Laura Koeth.
on May 16, 2020 by guest
http://jcm.asm.org/
REFERENCES
1. Humphries RM, Hindler JA, Epson E, Horwich-Scholefield S, Miller LG, Mendez J, Martinez JB, Sinkowitz J, Sinkowtiz D, Hershey C, Marquez P, Bhaurla S, Moran M, Pandes L, Terashita D, McKinnell JA. 2017. Carbapenem-resistant Enterobacteriaceae detection practices in California: what are we missing? Clin Infect Dis.https://doi.org/10.1093/ cid/cix942.
2. Bartsch SM, Huang SS, Wong KF, Slayton RB, McKinnell JA, Sahm DF, Kazmierczak K, Mueller LE, Jernigan JA, Lee BY. 2016. Impact of delays between Clinical and Laboratory Standards Institute and Food and Drug Administration revisions of interpretive criteria for carbapenem-resistant Enterobacteriaceae. J Clin Microbiol 54:2757–2762. https://doi.org/10 .1128/JCM.00635-16.
3. Clinical and Laboratory Standards Institute. 2016. Verification of com-mercial microbial identification and susceptibility test systems. M52. Clinical and Laboratory Standards Institute, Wayne, PA.
4. Clinical and Laboratory Standards Institute. 2018. Methods for dilution antimicrobial susceptibility tests for bacteria that grow aerobically; ap-proved standard—10th ed. M07-A11. Clinical and Laboratory Standards Institute, Wayne, PA.
5. Clinical and Laboratory Standards Institute. 2018. Performance standards for antimicrobial disk susceptibility tests; approved standard—12th ed. M02-A13. Clinical and Laboratory Standards Institute, Wayne, PA. 6. Clinical and Laboratory Standards Institute. 2018. Performance standards
for antimicrobial susceptibility testing; 27th informational supplement. M100-S28. Clinical and Laboratory Standards Institute, Wayne, PA. 7. Clinical and Laboratory Standards Institute. 2016. Development ofin
vitrosusceptibility testing criteria and quality control parameters— 4th ed. M23-A4. Clinical and Laboratory Standards Institute, Wayne, PA. 8. Hindler JA, Humphries RM. 2013. Colistin MIC variability by method for
contemporary clinical isolates of multidrug-resistant Gram-negative bacilli. J Clin Microbiol 51:1678 –1684.https://doi.org/10.1128/JCM.03385-12. 9. Charlton CL, Hindler JA, Turnidge J, Humphries RM. 2014. Precision of
vancomycin and daptomycin MICs for methicillin-resistant Staphylococ-cus aureusand effect of subculture and storage. J Clin Microbiol 52: 3898 –3905.https://doi.org/10.1128/JCM.01571-14.
10. Nakashima H, Takahashi H, Kameko M, Saito H. 2012. Daptomycin Etest
MICs for methicillin-resistantStaphylococcus aureusvary among different media. J Infect Chemother 18:970 –972.https://doi.org/10.1007/s10156 -012-0424-5.
11. Miller SA, Karichu J, Kohner P, Cole N, Hindler JA, Patel R, Richter S, Humphries RM. 2017. Multicenter evaluation of a modified cefoxitin disk diffusion method and PBP2a testing to predictmecA-mediated oxacillin resistance in atypicalStaphylococcus aureus. J Clin Microbiol 55:485– 494.
https://doi.org/10.1128/JCM.02211-16.
12. Metzler CM, DeHaan RM. 1974. Susceptibility tests of anaerobic bacteria: statistical and clinical considerations. J Infect Dis 130:588 –594.https:// doi.org/10.1093/infdis/130.6.588.
13. Brunden MN, Zurenko GE, Kapik B. 1992. Modification of the error-rate bounded classification scheme for use with two MIC break points. Diagn Microbiol Infect Dis 15:135–140. https://doi.org/10 .1016/0732-8893(92)90037-T.
14. DePalma G, Turnidge J, Craig BA. 2017. Determination of disk diffusion susceptibility testing interpretive criteria using model-based analysis: development and implementation. Diagn Microbiol Infect Dis 87: 143–149.https://doi.org/10.1016/j.diagmicrobio.2016.03.004.
15. Annis DH, Craig BA. 2005. The effect of interlaboratory variability on antimicrobial susceptibility determination. Diagn Microbiol Infect Dis 53:61– 64.https://doi.org/10.1016/j.diagmicrobio.2005.03.012. 16. Bobenchik AM, Deak E, Hindler JA, Charlton CL, Humphries RM. 2017.
Performance of Vitek 2 for antimicrobial susceptibility testing of Acin-etobacter baumannii,Pseudomonas aeruginosa, andStenotrophomonas maltophiliawith Vitek 2 (2009 FDA) and CLSI M100S 26th edition break-points. J Clin Microbiol 55:450 – 456.https://doi.org/10.1128/JCM.01859 -16.
17. Bobenchik AM, Deak E, Hindler JA, Charlton CL, Humphries RM. 2015. Performance of Vitek 2 for antimicrobial susceptibility testing of Enter-obacteriaceaewith Vitek 2 (2009 FDA) and 2014 CLSI breakpoints. J Clin Microbiol 53:816 – 823.https://doi.org/10.1128/JCM.02697-14. 18. International Organization for Standardization. 2016. Clinical laboratory
testing: criteria for acceptable lots of dehydrated Mueller-Hinton agar and broth for antimicrobial susceptibility testing. ISO/TS 16782:2016. International Organization for Standardization, Geneva, Switzerland.