534
OPTICAL METHODS OF IDENTIFYING THE VARIETIES OF
THE COMPONENTS OF GRAIN MIXTURES BASED ON
US-ING ARTIFCIAL NEURAL NETWORKS FOR DATA
ANALYSIS
1ARTEM O. DONSKIKH, 2DMITRY A. MINAKOV, 3ALEXANDER A. SIROTA
1,2,3Voronezh State University, Faculty of Computer Sciences, Department of Information Processing and
Security, 1 Universitetskaya pl., 394006, Voronezh, Russian Federation
ABSTRACT
The article considers methods of identifying the varieties of the components of grain mixtures based on the spectral analysis in the visible and near-infrared wavelength ranges. Various measurement approaches - reflection, transmission and combined spectrum methods - are used. The results of the spectral measure-ment are processed using neural network based classification algorithms combined with data dimensionali-ty reduction techniques. The probabilities of incorrect recognition for various numbers of features and combinations of spectral methods are estimated for mixtures of wheat grains. Combined use of spectral methods allowed to reduce the classification error by about ten times and bring its absolute value to 0.01...0.001.
Keywords: Spectral Analysis, Grain Mixtures, Wheat, Pattern Recognition, Neural Networks
1.INTRODUCTION
Advancement in agricultural production depends heavily on the adoption of new high-quality varie-ties and hybrids with significant genetic distinctions from the existing ones [1]. Usage of these varieties and hybrids can only be beneficial, if there are no mechanical or genetic impurities occurring in the process of seed production. However, seed contam-ination occurs frequently at the stage of seed har-vesting, processing and storage, and it is, therefore, crucial to remove foreign seeds from the mixture.
Seed production is often faced with difficulties in preventing intervarietal contamination of some crops. For example, contamination of hard wheat seeds with soft wheat is utterly undesirable, since soft wheat has higher multiplication ratio and dra-matically decreases varietal purity of hard wheat during reproduction. Thus, the quality of the seeds is determined not only by their variety characteris-tics, but also by the varietal purity and the degree of contamination with weed seeds, seeds of other crops, and diseased grains.
There are a number of methods for testing the va-rietal purity and uniformity of self-pollinated and crossbred crops, including approbation, soil testing
and laboratory varietal testing [2]. Visual assess-ment of the morphological features of seeds is often problematic and not timely, since it does not pro-vide an opportunity to analyze the seeds before they are planted. Laboratory testing has proved to be effective in the field of selection and seed produc-tion, where chemical methods are usually applied. One of the most effective methods is the molecular marker method based on studying polymorphism of proteins (reserve proteins in the first place) and nuclear acids of the seeds. Using reserve proteins as molecular markers resulted in significant advances in seed identification, as well as in registering the varieties crucial for seed production and control [3-5]. To analyze the biological value and viability of the seeds, molecular markers and other standard chemical methods are usually used [6-7].
clas-535 sification is of great technical and economic im-portance in the agricultural sector.
An alternative way is based on using optical spectroscopy methods, which are now applied widely in the sphere of agriculture and food quality control. Furthermore, as demonstrated in [8-12], these methods can be used to produce real-time sensors for high-performance optical grain sorters designed for real-time sorting of large amounts of seeds.
Machine vision technology is successfully ap-plied for creating rapid analyzers of the varietal purity based on assessing the morphological fea-tures of the seeds [13-15]. To identify the seeds, such features as shape, size, color and texture are usually used. However, different seeds may some-times have similar morphological features, and in these cases spectral analysis methods prove to be the most effective.
These methods are not destructive, and at the same time, they are relatively inexpensive.
A large number of papers consider the applica-tion of the near-infrared spectroscopy methods for estimating the varietal purity and quality of grains or for detecting diseased or defective grains [16-30]. A wide range of near-infrared analyzers [31-35] has appeared on the market as a result of the successful application of the spectroscopy methods for solving these problems. These methods are ef-fective due to the uniqueness of the biomolecular structure and composition of seeds and grains of different varieties, since each variety has its unique ratio between biologically significant indicators, such as protein, gluten, fat, carbohydrate content, humidity, etc. [17]. Each of these elements contrib-utes to the reflection, scattering and luminescence spectra.
For nondestructive analysis of the components of grain mixtures the diffuse reflection method is most widely used. For further computer processing of the spectral measurement data, various machine learn-ing algorithms are used: partial least squares dis-criminant analysis (PLS-DA), soft independent modelling of class analogy, К-nearest neighbors, least squares support vector machines (LS-SVM), artificial neural networks, principal component analysis (PCA), etc. For instance, Delwiche et al. [18] examined four classification algorithms used to identify the varieties of hard winter and spring wheat by near-infrared (1100-2498 nm) diffuse reflection spectra: multiple linear regression (MLR), principal component analysis with Ma-halanobis distance (PCA/MD), partial least squares (PLS) analysis, and artificial neural networks (ANN). The accuracy of all the four algorithms was
over 88%. However, the ANN algorithm demon-strated the highest result of 95-98%. The authors also studied the effect of the number of ANN input variables on the classification accuracy. It was demonstrated that reducing the number of input nodes from 223 to 111 resulted only in an insignifi-cant decrease in accuracy. However, reflection spectra were collected from bulk samples, and not from single grains, which made the method de-scribed in [18] inapplicable to the analysis of grain mixtures.
Wu et al. [19] used the LS-SVM method for identification of six varieties of Chinese cabbage seeds by analyzing reflection spectra in the range from 400 nm to 1000 nm, and achieved 98% classi-fication accuracy. However, only 20 samples of each class were used for the analysis, which is not enough for proper evaluation of classification accu-racy. Lee et al. [20] studied the application of near-infrared reflectance spectroscopy combined with PLS-DA and PCA for determining herbicide-resistant genetically modified soybean seeds. Infra-red spectroscopy can also be used to detect fumonisins content in maize [21,22], determine various qualitative characteristics of barley endo-sperm, discriminate paddy seeds of different stor-age stor-age [24] and detect defective soybeans [25]. In [21], reflection spectra were collected from single maize seeds, which is very important for plant breeding. Infrared spectroscopy methods can be used not only for seed identification and classifica-tion, but also for quantitative determination of their chemical composition [26-28]. However, to solve the most challenging tasks, such as classification of seeds of different varieties with similar chemical composition, or breeding new varieties and hybrids, new approaches are required. For example, Wang et al. [29] discovered that classification accuracy of hard wheat grains may be significantly reduced depending on the presence of bleached grains in the analyzed sample. Agelet et al. [30] achieved 99% accuracy in the identification of damaged corn ker-nels using partial least squares discriminant analy-sis method. It was impossible, however, to identify the non-viable kernels.
In our opinion, the informative value of the anal-ysis of grain mixtures and varietal purity testing can be further increased by analyzing data obtained simultaneously by means of multiple spectral methods, for example reflection and transmission spectroscopy methods.
536 used for processing multispectral data in order to identify the varieties of the components of grain mixtures. We also compare these results with the results obtained when the spectral methods were used separately. In this paper, we also study the effect of the training set size and the number of classification features (spectral parts) on the classi-fication accuracy.
2.MATERIALS AND METHODS
2.1 Research Materials And Spectrum Meas-urement Techniques
As a material for our research, we selected four varieties of wheat: “Voronezhskaya 11”, “Voro-nezhskaya 14”, “Svetlana” and “Cherno-zemnouralskaya”. The seeds were cultivated, and kindly provided to the authors by Dokuchaev Agri-cultural Research Institute.
We used molecular markers to specify the refer-ence groups of each variety by registering the elec-trophoretic spectra of the reserve proteins. It should be noted, that the seeds of each variety are similar in shape and color.
To identify the seeds’ variety, reflection and transmission spectroscopy methods in visible and near-infrared wavelength ranges were used. Reflec-tion and transmission spectra in visible and near-infrared light were measured using experimental measuring units based on optical fiber spectrome-ters USB4000-VIS-NIR and NirQuest512 (Ocean Optics).
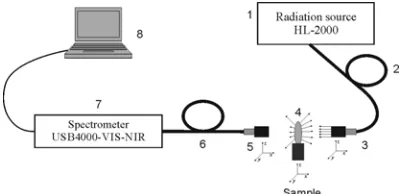
The reflection spectra were measured using the experimental unit shown in Figure 1. Light from the HL-2000 (Ocean Optics) light source 1 passes through the light guide 2 into the ISP-50-8-R-GT (Ocean Optics) integrating sphere 3 at the angle of 8°. Numerical aperture (NA) of the optical fiber is 0.22. The light reflected from the sample 4 at the angle of 90° emerges from the integrating sphere and passes through the light guide 5 to the spec-trometer 6, connected to the computer 7. WS-1 re-flection standard served as the source of reference signal. To measure the near-infrared spectra (up to 2100 nm), we replaced USB4000-VIS-NIR spec-trometer with a NirQuest512 specspec-trometer. We also used the ISP-REF integrating sphere with a built-in light source.
[image:3.612.314.530.53.197.2]Figure 1: Experimental unit for measuring the reflection
spectra
Collimated transmission spectra were measured using the experimental unit shown in Figure 2. Light coming from the HL-2000 (Ocean Optics) light source 1 passes through the light guide 2 to the collimator 3. Numerical aperture of the optical fiber is 0.22. Collimator 3 contains an aspherical lens element with NA=0.51. The quasi-collimated light beam is then directed to the sample 4. The light beam diameter (around 1.5 mm) is about one-half of the average thickness of the analyzed grains (around 3 mm). The collimator 5 collects the transmitted light and passes it through the output light guide 6 (NA=0.5) to the spectrometer 7, con-nected to the computer 8. Collimator 3 contains an aspherical lens element with NA=0.51. The dis-tance between the collimator 5 and the grain is around 3 mm. Specialized triaxial supports (Thorlabs) are used to arrange the optical axes of the collimators on the same line with the sample. An additional iris diaphragm can be placed after the collimator 3 to increase the dynamic range of the device. To measure the near-infrared (up to 2100 nm) collimated transmission spectra, we replaced the USB4000-VIS-NIR spectrometer with a NirQuest512 spectrometer.
Figure 2: Experimental unit for measuring the
transmis-sion spectra
[image:3.612.317.518.508.605.2]537 2.2. Spectral Data Processing Methods
Similar research [8-10] have already studied var-ious machine learning methods, particularly artifi-cial neural networks, principal component analysis and support vector machines. In our research, we also applied the k-nearest neighbors algorithm. Our study has shown that ANN-based algorithms are more robust to variations in spectral properties caused by natural variability of the samples. The same conclusion was made in [19].
Considering that neural networks method has demonstrated better results, as well as the theoreti-cal optimal generalization ability of neural net-works, in this paper we will focus on the multi-layer perceptron (MLP) neural networks based learning methods combined with data dimensionali-ty reduction techniques.
The initial measurement data contained 2520
N spectral components for each measured reflection or transmission spectrum in the visible range and N512 spectral components for each
reflection or transmission spectrum in the near-infrared range. However, such a large number of spectral components proved to be impractical for the problem under consideration.
Therefore, additional studies were carried out to analyze the possibility of reducing the initial feature space dimensionality. Two different approaches were considered.
The first approach to reducing the dimensionality of the initial data from Nspectral components to
n
spectral parts was based on averaging
neighbor-ing spectral components for each spectrum:
1 , , 1 ' ~ i i t j t j i s
s , i1,N , j1,L ,
N n
floor /
,
where
s
is the matrix of measured values of the spectral components, N is the number of the spec-tral components, L is the number of the measured grains of the same variety, nNis the total number of spectral parts and floor() is the operation of rounding down. After that, the rows of the matrix' ~
s were “subsampled” to get a matrix of averaged spectral components s~ with dimensions nL:
j ind j
k s
s , ~' ,
~ , k1,n , j1,L ,
1 * ) 1 ( n N floor k ind .
The second approach to reducing the dimension-ality of the initial data was based on applying prin-cipal component analysis (PCA) to the initial spec-tral data vectors. After keeping only the first n N
principal components, the resulting data matrix
j k s ,
~ ,k1,n, j1,L was obtained.
To solve the problem of recognizing the objects of grain mixtures, we used a neural network of the MLP (multilayer perceptron) class. Two layers of neurons were used in the network: the hidden layer with a sigmoid activation function and the output with a linear activation function.
The number of input contacts corresponds to the number of features
n
. The number of neurons in the output layerm
2 corresponds to the number ofthe seed varieties (
m
2
4
), where values “1” and“0” mean that the seed belongs or does not belong to the corresponding variety respectively. The number of neurons in the hidden layer
m
1 was selected from the range of values1
2
1
m
n
n
. The network was created and tested using MATLAB environment. Levenberg-Marquardt algorithm was used for training.To ensure the invariance of the initial data (the measured reflection and transmission spectra) pro-cessing, it was first normalized by mapping each component’s means to 0 and deviations to 1.
To evaluate the classification effectiveness, measurements for 500 samples of each class were made using the experimental measuring units, so the total of L2000 reflection and transmission spectra were measured. Cross-validation technique was used for testing. During each cross-validation round we selected 5 samples of each class from the initial dataset as testing samples and used the other samples as training samples. This operation was repeated 100 times for different samples and the resulting performance estimate was calculated by averaging the results.
3.RESULTS AND DISCUSSION
3.1. Results Of The Spectral Analysis.
538 (a)
(b)
Figure 3: Average reflection spectra of “Voronezhskaya 11” (curve 1), “Voronezhskaya 14” (curve 2), “Svet-lana” (curve 3) and “Chernozemnouralskaya” (curve 4)
wheat seeds
Figure 3a demonstrates that reflection spectra of all the four wheat varieties are very close in the visible region and are of similar shape. In the near-infrared region the spectrum curves are close as well (Figure 3b). They have a complex structure resulting from the multicomponent chemical com-position of wheat seeds. The shape of the curves is almost the same in the whole region, but different varieties have different reflection coefficients. The spectral curve of “Svetlana” seeds lies below the curve of “Chernozemnouralskaya” in the range of up to 1400 nm, and below the curve of “Voronezh-skaya 11” in the range of up to 2100 nm.
Fig. 4a and 4b show the averaged collimated transmission spectra of each class of the samples in the visible and near-infrared regions.
(a)
[image:5.612.93.533.53.373.2](b)
Figure 4: Average transmission spectra of “Voronezh-skaya 11” (curve 1), “Voronezh“Voronezh-skaya 14” (curve 2), “Svetlana” (curve 3) and “Chernozemnouralskaya”
(curve 4) wheat seeds
Fig. 4 demonstrates that soft wheat varieties (“Chernozemnouralskaya” and “Voronezhskaya 14”) have very similar curves, but they differ sig-nificantly from the curves of hard wheat varieties (“Svetlana” and “Voronezhskaya 11”). Vitreous seeds of wheat have higher transmission in the visi-ble and near-infrared range (up to 750 nm). In the range from 750 nm the transmitted radiation inten-sity decreases for all the varieties of wheat.
Complex shapes of the reflection and transmis-sion spectra curves result from the response of wa-ter molecules, proteins, fats, carbohydrates and oth-er components. Watoth-er, for example, has high ab-sorption rate in the infrared region causing dips on the reflection and transmission spectra graphs (Fig. 3b and 4b) at 1.19 μm, 1.45 μm, and 1.94 μm.
Carbohydrates (starches, sugars) show high ab-sorption level in the near-infrared region at 1150 nm and 1190 - 1225 nm [30]. Proteins are charac-terized by absorption at 970-1050 nm, 1550 nm [29] and 770-970 nm. The С-Н bonds influence appears at wavelengths 1215 nm, 1345 nm and 1600 nm.
Visual analysis of the results shows that spectral classification of wheat seeds is a difficult task. However, seed classification effectiveness can be increased by combining various spectral methods. Apparently, combined usage of transmission and reflection spectroscopy methods may reduce the classification error probability.
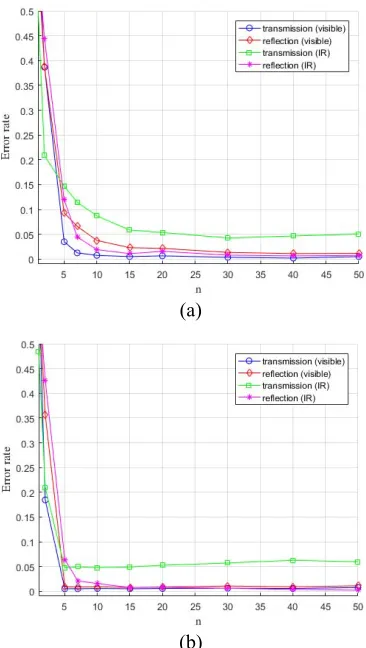
3.2. Results Of Classification Based On Single Spectral Methods
[image:5.612.94.308.71.372.2] [image:5.612.94.296.602.724.2]prob-539 ability decreases significantly. When the threshold
15
,...,
10
n
is exceeded, the probability of error becomes sufficiently low and is not reduced when increasing n further.(a)
[image:6.612.99.282.150.474.2](b)
Figure 5: Probabilities of incorrect recognition of the wheat seeds variety depending on a) the number of the analyzed spectral parts; b) the number of the analyzed
principal components
When principal components analysis is applied, the error probability initially decreases faster and approaches the limit of 0.05 when
n
5
principal components are used. However, the results obtained when using averaging of neighboring spectral com-ponents to reduce the dimensionality of the initial data are of greater practical interest, since they demonstrate that a measurement unit can be con-structed using simpler sensors that register only a few spectral parts. It may be crucial for designing high-performance video spectrum analyzers capable of operating in real-time mode. Taking this into account, in subsequent experiments, dimensionality reduction of the initial data was performed by aver-aging the spectral components.Furthermore, we studied the dependency be-tween the training set size and the classifier per-formance to ensure that the dataset used is large
[image:6.612.327.499.217.347.2]enough to provide reliable results. For each training set size (from 200 to 1800 samples), 100 tests were performed using bootstrapping: training samples for each test were selected at random from the initial dataset, and the remaining samples were used for testing. The aggregated result for each dataset size was calculated by averaging the results for each test. Figure 6 shows the probabilities of incorrect recognition of the wheat seeds variety depending on the training set size.
Figure 6: Probabilities of incorrect recognition of the
wheat seeds variety depending on the training set size L
for
n
10
analyzed spectral partsFigure 6 demonstrates that when the training set size of 1200 samples is exceeded, the probability of error is not reduced significantly with the increased size of the training set, and converges to the fixed value.
3.3. Results Of Classification Based On The Combined Use Of Spectral Methods
To increase the classification accuracy, we pro-pose the combined use of several spectral analysis methods. In this case, the input of the neural net-work contains n measured spectral components for each reflection and transmission spectra measure-ment method implemeasure-mented (2n features in total when two methods are used simultaneously and
n
540 (a)
(b)
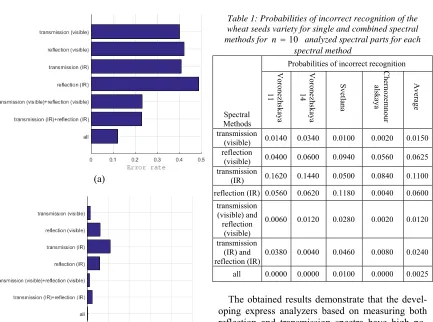
Figure 7: Probabilities of incorrect recognition of the wheat seeds variety for single and combined spectral
methods for
n
2
(Figure 7a) andn
10
(Figure7b) analyzed spectral parts for each spectrum
Figure 7 shows that combined use of spectral analysis methods provides noticeably higher classi-fication accuracy compared to using a single meth-od even when
n
2
spectral parts are analyzed. The error rate for transmission and reflection spec-tra when used separately is more than 40% for each method, for both combinations of two methods it is around 23% and for combination of all for methods it is only 12.1%. [image:7.612.95.528.92.414.2]The results for
n
10
spectral parts are similar. In the visible range, the error rate is 1.5% for transmission spectra and 6.25% for reflection spec-tra, whereas their combined usage gives a result of 1.2%. In the near-infrared range the error rates for transmission and reflection spectra are 11% and 6% accordingly, and for their combination the error rate is 2.4%. Combined use of all the four methods al-lows to achieve the error rate of 0.25%. More de-tails for each variety are given in Table 1.Table 1: Probabilities of incorrect recognition of the wheat seeds variety for single and combined spectral
methods for n 10 analyzed spectral parts for each
spectral method
Spectral Methods
Probabilities of incorrect recognition
Voronezhskaya
11
Voronezhskaya
14
S
vetlana
C
her
nozem
nou
r
alskaya Average
transmission
(visible) 0.0140 0.0340 0.0100 0.0020 0.0150 reflection
(visible) 0.0400 0.0600 0.0940 0.0560 0.0625 transmission
(IR) 0.1620 0.1440 0.0500 0.0840 0.1100 reflection (IR) 0.0560 0.0620 0.1180 0.0040 0.0600
transmission (visible) and reflection
(visible)
0.0060 0.0120 0.0280 0.0020 0.0120
transmission (IR) and reflection (IR)
0.0380 0.0040 0.0460 0.0080 0.0240
all 0.0000 0.0000 0.0100 0.0000 0.0025
The obtained results demonstrate that the devel-oping express analyzers based on measuring both reflection and transmission spectra have high po-tential that can be used to identify the varieties of the components of grain mixtures, to detect infected seeds or to increase the accuracy of the estimation of the biological value of seeds. This is the main novelty of this work compared to the previous re-search [16-30].
It should also be noted that the existing analyzers [31-35] perform the analysis of grains using only one spectral method (for example, reflection spec-troscopy). Moreover, the spectra are collected from bulk samples instead of single grains, which make it impossible to identify and separate grains of dif-ferent varieties with similar biological composition. The accuracy of bulk methods also decreases sig-nificantly when the classes in the mixture are une-venly distributed, whereas the analysis of individual grains does not have such disadvantage.
The study of the dependence of classification ac-curacy on the number of spectral parts has shown that 10 spectral parts are enough to perform the multispectral analysis of the grains without losing accuracy. This means that it is possible to perform real-time analysis of individual grains to solve the problems of seed industry, varietal purity control and high-performance grain separation.
541 study of the influence that destabilizing factors have on the measuring of grain spectra in real-time mode. Second, it is necessary to study the possibil-ity of reducing the number of spectral parts or using selected spectral regions without significant loss of accuracy in order to further improve the overall performance of the analysis. This would make it possible to replace spectrometers with high-speed multispectral cameras, which is essential for creat-ing high-performance separators.
4.CONCLUSION
In terms of the research objectives, the obtained results prove that the combined use of methods of spectral analysis allows for a significant increase in classification accuracy of the elements of grain mixtures. It has been demonstrated that combined use of reflection and transmission spectra in visible and near-infrared ranges results in reduction of the classification error for wheat grains by about ten times and brings its absolute value to 0.01...0.001. Such comparative studies have not yet been per-formed in the existing literature.
It has also been shown that using 10-15 spectral parts obtained by averaging neighboring spectral components is sufficient for classification of grains without noticeable accuracy loss. A pretrained MLP neural network with 1 hidden and 1 output layer can be used as a high-performance classification algorithm.
The obtained results demonstrate high potential of developing spectral sensors capable of measur-ing both reflected and transmitted light in different wavelength ranges. The conducted research allows us to determine the principles of construction of high-performance analyzers and separators analyz-ing a relatively small number of spectral parts. The performance of such analyzers should be restricted only by the speed of registration and processing of multi-spectral information.
5.ACKNOWLEDGMENTS:
The presented study was supported by the Rus-sian Ministry of Education and Science (project № 8.3844.2017/4.6 “Development of facilities for ex-press analysis and classification of the components of nonuniform grain mixtures with pathologies based on the integration between spectral analysis methods and machine learning”).
REFERENCES:
[1] Guzhov Y.L., Fuchs A., Valicek P., “Selection, and Seed Farming of the Cultivated Plants”, Moscow: Mir, 2003 (in Russian).
[2] Krestnikov I.S., “Modern methods of varietal control of seeds of agricultural crops”, Izvesti-ya VUZov, Food technology, 1992, № 5-6. pp. 79-81 (in Russian).
[3] Konarev A.V., Konarev V.G., Gubareva N.K., Peneva T.I., “Seed proteins as markers in solving the problems of genetic plant re-sources, selection and seed production”, Cytol-ogy and Genetics, 2000, Vol. 34, №2, pp. 91-104 (in Russian).
[4] Romanova, Iu.A., Gubareva, N.K., Konarev, A.V., Mitrofanova, O.P., Liapunova, O.A., An-filova, N.A., Strel’chenko P.P., “Study of a collection of Triticum spelta L. wheat species using gliadin polymorphism”, Genetics, 2001, Vol. 37, № 9, pp. 1258-1265 (in Russian). [5] Alpatieva N.V., Gubareva N.K.,
“Characteris-tics of Ancient Local Varieties of Soft Winter Wheat Based on Electrophoresis Spectra of High-Molecular Glutenin”, Agricultural Rus-sia, 2002, Vol. 3, pp. 24-28 (in Russian). [6] Korenmann Ya.I., Lisitskaya R.P., “Study
guide in analytical chemistry. Food analysis”, Voronezh State University of Engineering Technologies, Voronezh, 2002, 408 p. (in Rus-sian).
[7] Ermakov A.I., “Methods of biochemical stud-ies of plants”, Kolos, Moscow, 1972, 455 p. (in Russian).
[8] Algazinov E.К., Dryuchenko М.А., Minakov D.А., Sirota А.А., Shul’gin V.А., “Methods of measuring the spectral characteristics and iden-tifying the components of grain mixtures in re-al-time separation systems”, Measurement Techniques, Vol. 57, No. 1, 2014, pp.54-61. [9] Algazinov E.К., Dryuchenko М.А., Minakov
D.А., Sirota А.А., Shul’gin V.А., “Hardware– software complex for the analysis of a nonuni-form flow of objects in real-time optical sorting systems”, Measurement Techniques, Vol. 57, No. 5, 2014, pp.509-518.
[10] Algazinov E.К., Dryuchenko М.А., Minakov D.А., Sirota А.А., Shul’gin V.А., “Methods of identification elements grain mixtures by measuring spectral characteristics in real-time separation systems”, Bulletin of the Voronezh State University. Series: systems analysis and information technology,. №2, 2013, pp. 9-19 (in Russian).
542 [13] Dubey B.P., Bhagwat S.G., Shouche S.P.,
Sainis J.K., “Potential of artificial neural net-works in varietal identification using mor-phometry of wheat grains”, Biosystems Engi-neering, Vol.95, 2006, pp.61-67.
[14] Nasirahmadi A., Behroozi-Khazaei N., “Identi-fication of bean varieties according to color features using artificial neural network”, Span-ish Journal of Agricultural Research, Vol.11, 2013, pp.670-677.
[15] Arefi A., Motlagh A.M., Teimourlou R.F., “Wheat class identification using computer vi-sion system and artificial neural networks”, In-ternational Agrophysics, Vol.25, 2011, pp.319-325.
[16] Huang M., Wang Q.G., Zhu Q.B., Qin J.W., Huang G., “Review of seed quality and safety tests using optical sensing technologies”, Seed Sci. & Technol., Vol.43, 2015, pp.337-366. [17] Bayea T.M., Pearson T.C., Settles A.M.,
“De-velopment of a calibration to predict maize seed composition using single kernel near in-frared spectroscopy”, Journal of Cereal Sci-ence, Vol. 43, 2006, pp. 236–243.
[18] Delwiche S.R., Chen Yud-Ren, Hruschka W.R., “Differentiation of Hard Red Wheat by Near-Infrared Analysis of Bulk Samples”, Ce-real chem., Vol. 72 №3, 1995, pp. 243—247. [19] Wu D., Feng L., He Y., Bao Y., “Variety
iden-tification of Chinese cabbage seeds using visi-ble and near-infrared spectroscopy”, Transac-tions of the ASABE, Vol. 51, 2008, pp. 2193-2199.
[20] Lee J.H., Choung M.-G., “Nondestructive de-termination of herbicide-resistant genetically modified soybean seeds using near-infrared re-flectance spectroscopy”, Food Chemistry, Vol. 126, 2011, pp. 368-373.
[21] Tallada J.G., Palacios-Rojas N., Armstrong P.R., “Prediction of maize seed attributes using a rapid single kernel near infrared instrument”, Journal of Cereal Science, Vol. 50, 2009, pp. 381-387.
[22] Giacomo D., Stefania dZ., “A multivariate re-gression model for detection of fumonisins content in maize from near infrared spectra”, Food Chemistry, Vol. 141, 2013, pp. 4289-4294.
[23] Cozzolino D., Roumeliotis S., Eglinton J., “Feasibility study on the use of attenuated total reflectance infrared spectroscopy as high throughput screening tool to phenotype single barley seeds (Hordeum vulgare L.)”, Biosys-tems Engineering, Vol. 116, 2013, pp. 379-384.
[24] Li X., He Y., Wu C., “Non-destructive discrim-ination of paddy seeds of different storage age based on Vis/NIR spectroscopy”, Journal of Stored Products Research, Vol. 44, 2008, pp. 264-268.
[25] Sirisomboon P., Hashimoto Y., Tanaka M., “Study on non-destructive evaluation methods for defect pods for green soybean processing by near-infrared spectroscopy”, Journal of Food Engineering, Vol. 93, 2009, pp. 502-512. [26] Cantarelli M.A., Funes I.G., Marchevsky E.J.,
Camina J.M., “Determination of oleic acid in sunflower seeds by infrared spectroscopy and multivariate calibration method”, Talanta, Vol. 80, 2009, pp. 489-492.
[27] Fernández-Ibañez V., Soldado A., Martínez-Fernández A., de la Roza-Delgado B., “Appli-cation of near infrared spectroscopy for rapid detection of aflatoxin B1 in maize and barley as analytical quality assessment”, Food Chem-istry, Vol. 113, 2009, pp. 629-634.;
[28] Lee J.-D., Shannon J.G., Choung M.-G., “Se-lection for protein content in soybean from sin-gle F2 seed by near infrared reflectance spec-troscopy”, Euphytica, Vol. 172, 2010, pp. 117-123.
[29] Wang D., Dowell F. E., Dempster R., “Deter-mining Vitreous Subclasses of Hard Red Spring Wheat Using Visible/Near-Infrared Spectroscopy”, Cereal Chem., Vol. 79, №3, 2002, pp. 418–422.
[30] Agelet L.E., Ellis D.D., Duvick D., Goggi A.S., Hurburgh C.R., Gardner C.A., “Feasibil-ity of near infrared spectroscopy for analyzing corn kernel damage and viability of soybean and corn kernels”, Journal of Cereal Science, Vol. 55, 2012, pp. 160-165.
[31] http://www.perten.com [32] http://www.foss.dk