Optimal Solution of Combined Economic Emission
Load Dispatch using Genetic Algorithm
Naveen Kumar
M. Tech, Department of ElectricalEngineering
DCRUST, Murthal, Sonepat, Haryana-131039, India
K. P. Singh Parmar
Assistant Director (Technical), National Power Training Institute, Faridabad, Haryana-121003, IndiaSurender Dahiya
Associate Professor, Department ofElectrical Engineering, DCRUST, Murthal, Sonepat,
Haryana-1310039, India
ABSTRACT
In this paper, a genetic algorithm (GA) approach is presented for optimal solution of combined economic emission load dispatch (CEELD) problem. Fuel cost and emission are considered to formulate the multi-objective optimization problem. An optimal trade-off between fuel cost and emission is obtained using genetic algorithm. Two test systems are considered to show the effectiveness of the GA approach. An extensive analysis is done by presenting a short term thermal generation scheduling for the Test system-1.
Keywords
Economic load dispatch, Combined economic emission Load dispatch, Genetic algorithm.
1.
INTRODUCTION
The main objective of economic load dispatch (ELD) is to schedule the committed generating units output to meet the load demand at minimum operating cost [1] .However, with the increasing public awareness of the environment protection and the passage of the Clean Air Act Amendment of 1990, we need to reduce the pollution and atmospheric emissions of the thermal power plants [2]. Economy in cost is not enough so emission is also considered along with the cost. The most important objectives which are to be satisfied simultaneously are economic operation, minimal impact on environment, reliability and security [3].
Several strategies to reduce the emission have been proposed and discussed [4-6]. These include some pollution cleaning equipments. The emission dispatching option is an attractive short term alternative in which the emission in addition to the fuel cost that is combined economic emission load dispatch (CEELD) is to be minimized [7]. The economic dispatch problem can be handled as a multi-objective optimization problem with non-commensurable and conflicting objectives. In recent years, this option has received much attention since it requires only small modification to ED to include emissions [8].
Various techniques such as direct NR method based on alternative jacobian matrix [8], a recursive approach based on dynamic programming [9], a simplified recursive process, a progressive articulation of preference information based optimization technique[10] and an analytical strategy based on mathematical modeling [11] have been presented to handle combined economic emission dispatch problems.
In recent years evolutionary approaches such as interactive fuzzy satisfying based simulated annealing technique, particle swarm optimization, a multi-objective genetic algorithm and a fuzzified multi-objective particle swarm optimization
algorithm [12] have been extensively articulated to obtain the global optimal solution. The problem has been reduced to a single objective problem by treating the emission as a constraint [13]. This formulation has some difficulty in getting the trade off relations between cost and emission. Then minimizing the emission has been handled as another objective in addition to the cost. Recently, the studies on evolutionary algorithms have shows that these methods can be efficiently used to eliminate the most of the difficulty of classical methods [14, 15]. Various solutions of ELD and CEELD have been reported recently in the literature [19-20].
GA has been applied on a three generator test system considering CEELD [16]. Further in this paper GA has been extended on two different standard test systems and extensive analysis is done by presenting a short term thermal generation scheduling for the test system-1.
In this paper genetic algorithm [16] is applied to solve the CEELD. CEELD problem is considered as an optimization problem where the fuel cost and emission are treated as competing objectives. The presented GA is applied on the two standard test systems. Test system-1 comprises a three generator system [17]. Test system-2 comprises a standard six generator (IEEE 30 bus system) [18]. Short term optimal generation scheduling is done on Test system-1.
2. PROBLEM FORMULATION
CEELD Problem is formulated as an optimization problem in which fuel cost and emission are minimized simultaneously for the prescribed schedule of load. Multi-objective optimization problem of Fuel cost and emission are converted into single objective problem using penalty factor [16].
2.1 Economic Dispatch
Mathematically the objective function or fuel cost function [1] is written as
𝐹𝑖 𝑃𝑔𝑖 = 𝑎𝑖𝑃𝑔𝑖2 + 𝑏𝑖𝑃𝑔𝑖+ 𝑐𝑖 Rs/h (1)
𝑤𝑒𝑟𝑒,
F(𝑃𝑔𝑖) = total fuel cost
𝑎𝑖, 𝑏𝑖, 𝑐𝑖 = cost coefficients of ith generating units
2.2 Emission dispatch
Harmful pollutants like oxides of nitrogen (𝑁𝑂𝑥), oxides of
sulphur (SOx) and carbon monoxide (CO) are emitted due to
shows the emission function to be minimize while satisfying the constraints as per equation (7) and equation (8).
𝐸(𝑃𝑔𝑖) = 𝑑𝑖𝑃𝑔𝑖2 + 𝑒𝑖𝑃𝑔𝑖+ 𝑓𝑖 Kg/h (2)
𝑑𝑖, 𝑒𝑖, 𝑓𝑖 = emission coefficients of 𝑖𝑡generating unit
2.3 Combined economic emission dispatch
Fuel cost and emission are two conflicting objectives to be attained. When the fuel cost is minimized, emission increases and cost increases when emission is minimized. So the cost and emission are reduced simultaneously while satisfying the constraints imposed as per equation (7) and equation (8). Both objectives fuel cost and emission are converted into a single objective function [16] with the help of penalty factor using equation as
Minimize 𝐹𝑖 𝑃𝑔𝑖 + 𝑃𝑓𝐸(𝑃𝑔𝑖) Rs/h (3)
Where,
𝑃𝑓 = Penalty factor
2.3.1 Steps to determine Penalty factor
Penalty factor is determined using following procedure [16].
(1)Fuel cost at maximum power output for every generator is determined
𝐹𝑖 𝑃𝑔𝑖(𝑚𝑎𝑥 ) = 𝑎𝑖𝑃𝑔𝑖(𝑚𝑎𝑥 )2 + 𝑏𝑖𝑃𝑔𝑖(𝑚𝑎𝑥 )+ 𝑐𝑖 (4)
𝟐 Emission at maximum power output for every generator is determined as
𝐸 𝑃𝑔𝑖 max = 𝑑𝑖𝑃𝑔𝑖 max 2 + 𝑒𝑖𝑃𝑔𝑖 max + 𝑓𝑖 (5)
(3)Penalty factor form each generator is determined
𝑃𝑓𝑖 = 𝐹𝑖 𝑃𝑔𝑖(𝑚𝑎𝑥 ) /𝐸 𝑃𝑔𝑖 max (6)
(4) Penalty factor are arranged in ascending order.
(5) Maximum capacity of each generator is added one at a time, starting from the lowest penalty factor unit until
𝑃𝑔𝑖(max )≥ 𝑃𝑑
(6) Penalty factor with the last unit in this process is the price penalty factor.
2.4 Constraints
Constraints imposed on CEELD problem are given as:
2.4.1) Equality Constraint (Energy balance
equation)
Total generated power is equal to the total demand plus the transmission loss. Equality constraint [1] is given in equation (2)
𝑃𝑔𝑖 𝑁𝐺
𝑖=1 =𝑃𝑑+ 𝑃𝐿 (7)
𝑃𝑔𝑖 = real power output of the ith generating unit
𝑃𝐿 = total power transmission losses
𝑃𝑑 = total demand
This equation denotes that the total generation is equal to the total demand when transmission losses are considered.
2.4.2) Inequality constraints (Generating capacity
limit constraints):
The generation output of each unit should be between its maximum and minimum limits. Inequality constraints [1] is written as
𝑃𝑔𝑖𝑚𝑖𝑛 ≤ 𝑃𝑔𝑖≤ 𝑃𝑔𝑖𝑚𝑎𝑥 (8)
𝑃𝑔𝑖𝑚𝑖𝑛 = minimum power output of the ith generating unit
𝑃𝑔𝑖𝑚𝑎𝑥 = maximum power output of the ith generating unit
To achieve true CEELD transmission loss must be taken into account. Using B-coefficients method, the network losses are expressed using George‟s formula [1]
𝑃𝐿𝑜𝑠𝑠 = 𝑁𝐺𝑖−1𝑃𝑔𝑖 𝑁𝐺𝑗 =1𝑃𝑔𝑗𝐵𝑖𝑗 (9)
𝐵𝑖𝑗are constant called B-coefficients or loss coefficients.
The exact value of the system losses can only be determined by power flow solution. Kron‟s formula is used to find thelosses and appropriates the losses as a function of the output level of the system generators. Kron‟s formula [1] is expressed as
𝑃𝐿𝑜𝑠𝑠= 𝑁𝐺𝑖=1𝑃𝑔𝑖 𝑁𝐺𝑗 =1𝑃𝑔𝑗𝐵𝑖𝑗+ 𝑁𝐺𝑖=1𝑃𝑔𝑖𝐵𝑖0+𝐵00 (10)
3.
OVERVIEW OF GENETIC
ALGORITHM
GA was developed by John Holland and finally popularized by one of his student, David Goldberg [14]. GA is a stochastic searching algorithm. It is a genetics search algorithm based on the principles of natural selection and natural genetics. It is based on the „Darwinian survival of the fittest‟ principle [1].
The attractive property of GA is that it searches for many optimum points in parallel. GA searches through many points in the solution space at one time which is other important advantage of GA as compared to other techniques.
The GA begins with a collection of chromosome known as the population. The population has L chromosomes called population size.
3.1 Genetic operator
A simple genetic algorithm consists of three basic operators: Elitism, Crossover and Mutation. The copying of best population to the next population is called “Elitism”. If the probability is high, then the convergence rate increases. But it will not be too high to get good result
number is generated between 0 and 1, and compared with the crossover probability. If it is less than crossover probability then crossover is performed otherwise as it is passed. The crossover probability is defined before solving the problem. Mutation is the process of random modification of the value of a string position with a small probability .It is taken as very small.
3.2 Fitness function and parent selection
Implementation of power dispatch problem in GA is realized with the fitness function. Since the proposed approach uses the equal incremental cost criterion as its basic the constraint equation (2) can be written as
𝜀𝑗 = │ 𝑃 𝑔𝑖 𝑁𝐺
𝑖=1 - (𝑃𝑑 +𝑃𝐿) │ (11)
Then the convergence rule is when error (ε) decreases with in a particular value. For the purpose of emphasizing the best chromosome and speed up convergence of the iteration procedure, fitness is normalized between 0 and 1[13]. The fitness function used is:
𝑓𝑗 = 1/1+𝛼(𝜀𝑗/𝑃
𝑑) (j=1,2...L) (12)
L= Population size
𝛼 = scaling constant
The equivalent decimal integer of binary string λ is obtained as
𝑦𝑗 = 𝑙 2𝑖−1
𝑖=1 𝑏𝑖𝑗( j=1,2,...L) (13)
𝑏𝑖𝑗is ith binary digit of the jth string
l is the length of the string
L is the population size.
The continuous variable λ can be obtained to represent a point in the search space according to a fixed mapping rule, i.e
𝜆𝑗= 𝜆𝑚𝑖𝑛+ (𝜆𝑚𝑎𝑥-𝜆𝑚𝑖𝑛) ∗ 𝑦𝑗/2𝑙-1 (14)
𝑦𝑗is the binary coded value of the string
𝜆𝑚𝑖𝑛is the minimum value of variable, λ
𝜆𝑚𝑎𝑥is the maximum value of the string
4.
COMBINED ECONOMIC EMISSION
DISPATCH USING GENETIC
ALGORITHM
The step-wise procedure [1, 19] is outlined below for a quick reference.
1. Read data, namely cost coefficients, emission coefficients, B-coefficients, maximum allowed iterations, ITMAX, L population size, probability of crossover and
mutation,𝜆𝑚𝑖𝑛and 𝜆𝑚𝑎𝑥.
2. Compute the price penalty factor𝑃𝑓 from equation (8).
3. Convert the multi-objective problem into singleobjective.
4. Generate an array of random numbers. Generate the population 𝜆𝑗(j=1,2....L)
by flipping the coin .The bit is set according to the coin flip as
𝑏𝑖𝑗 = 1 if p=1or random 0≤p
= 0 Otherwise
Where p is the probability (0.5)
5. Set generation counter, k=0, 𝑓𝑚𝑖𝑛 =1and 𝑓𝑚𝑖𝑛=0.
6. Increment the generation counter, k=k+1 and set the population counter, j=0.
7. Increment population counter, j=j+1
8. Decode the string.
9. Using Gauss elimination method, find 𝑃𝐼𝐽
10. Calculate transmission losses.
11. Find 𝜀𝑗 and check if 𝜀𝑗<BIG, then set BIG = 𝜀𝑗
12. Find fitness from eq. (7)
If (𝑓𝑗>𝑓𝑗) then 𝑓𝑗=𝑓𝑗 and if 𝑓𝑗<𝑓𝑗 then set 𝑓𝑗=𝑓𝑗
13. If (j<L) then go to step 5 and repeated
14. If (BIG<error) then go to step 17.
15. Find population with maximum and average fitness of the population.
16. Select the parents for crossover and perform crossover
17. Perform mutations
18. If (k<ITMAX) then go to step 4 and repeat.
19. Calculate fuel cost, emission release and emission cost etc. print the results
20 stop
5. RESULTS AND DISCUSSION
Genetic algorithm is applied on two different test systems. A short term optimal generation scheduling is done on Test system-1[17]. Test system-2 [18] is a standard IEEE 30-bus (six generator system).. Genetic algorithm parameter used are
Population size = 50
Generation = 500
Crossover probability = 0 .9
Mutation probability =0.01
5.1 Results of Test system-1
Table-1 : Best fuel cost (Test system-1)
Power Output GA
P1(MW) 105.9407
P2(MW) 212.9017
P3(MW) 193.0709
Best Fuel Cost(Rs/hour) 25465.47
NOx Emission(Kg/hour) 318.0288
Losses(MW) 11.9133
Table-2: Best emission (Test system-1)
Power Output GA
P1(MW) 130.6004
P2(MW) 190.6617
P3(MW) 190.4190
Best NOx Emission(Kg/hour) 311.0869
Fuel Cost(Rs/hour) 25504.2
Losses(MW) 11.6811
Table-3: Compromised solution (Test system-1)
Power Output GA
P1(MW) 128.5918
P2(MW) 192.7516
P3(MW) 190.3522
Best Fuel Cost(Rs/hour) 25494
Best NOx Emission(Kg/hour) 311.1685
Losses(MW) 11.6956
Price Penalty Factor(Rs/Kg) 44.8063
[image:4.595.67.532.422.763.2]Total Cost(Rs/hour) 39436.46
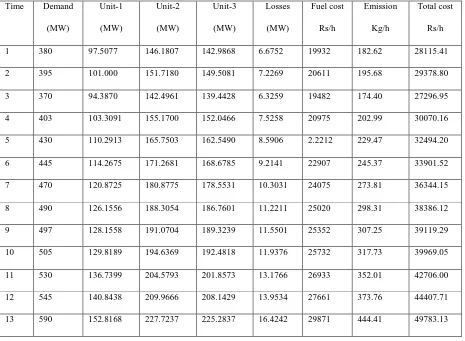
Table-4: Short term Thermal generation scheduling (Test system-1)
Time Demand
(MW)
Unit-1
(MW)
Unit-2
(MW)
Unit-3
(MW)
Losses
(MW)
Fuel cost
Rs/h
Emission
Kg/h
Total cost
Rs/h
1 380 97.5077 146.1807 142.9868 6.6752 19932 182.62 28115.41
2 395 101.000 151.7180 149.5081 7.2269 20611 195.68 29378.80
3 370 94.3870 142.4961 139.4428 6.3259 19482 174.40 27296.95
4 403 103.3091 155.1700 152.0466 7.5258 20975 202.99 30070.16
5 430 110.2913 165.7503 162.5490 8.5906 2.2212 229.47 32494.20
6 445 114.2675 171.2681 168.6785 9.2141 22907 245.37 33901.52
7 470 120.8725 180.8775 178.5531 10.3031 24075 273.81 36344.15
8 490 126.1556 188.3054 186.7601 11.2211 25020 298.31 38386.12
9 497 128.1558 191.0704 189.3239 11.5501 25352 307.25 39119.29
10 505 129.8189 194.6369 192.4818 11.9376 25732 317.73 39969.05
11 530 136.7399 204.5793 201.8573 13.1766 26933 352.01 42706.00
12 545 140.8438 209.9666 208.1429 13.9534 27661 373.76 44407.71
14 600 155.4948 231.6052 229.9023 17.0023 30368 461.21 51033.11
15 614 159.1757 237.0117 235.6432 17.8306 31068 485.41 52817.20
16 628 162.9241 242.9021 240.8510 18.6772 31772 510.40 54641.14
17 640 166.0570 248.0730 245.2902 19.4201 32378 532.47 56236.56
18 730 190.7282 283.2039 281.5558 25.4879 37037 716.73 71313.10
19 628 162.9241 242.9021 240.8510 18.6772 31772 510.40 54641.14
20 590 152.8168 227.7237 225.2837 16.4242 29871 444.41 49783.13
21 505 129.8189 194.6369 192.4818 11.9376 25732 317.73 39969.05
22 470 120.8725 180.8775 178.5531 10.3031 24075 273.81 36344.15
23 400 102.4874 153.5402 151.3857 7.4133 20838 200.21 29809.45
[image:5.595.68.534.74.512.2]24 395 101.000 151.7180 149.5081 7.2269 20611 195.68 29378.80
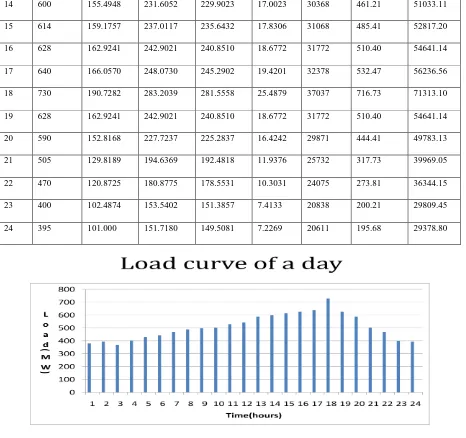
Figure 1: Load profile of a day
5.2 Results of Test system-2
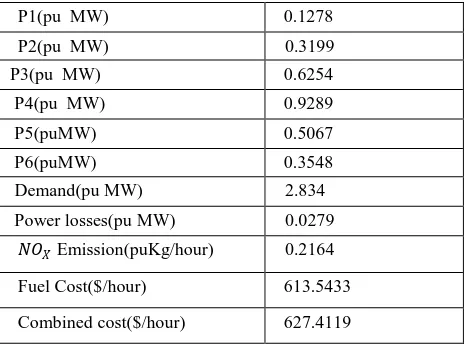
Results of Test system-2 are shown in Tables 5-7. The results for best fuel cost are shown in Table 5 and the results for best emission are shown in Table 6. Best compromised solution between fuel cost and emission is shown in Table 7. Power demand is taken as 2.834 pu at a base load of 100 MVA. The best combined cost is 627.4119 $/h and transmission losses are 0.0279pu MW.
Table-5: Best fuel cost (Test system-2)
P1(pu MW) 0.1100
P2(pu MW) 0.3104
P3(pu MW) 0.6373
P4(pu MW) 0.9517
P5(pu MW) 0.5177
P6(pu MW) 0.3413
Demand(pu MW) 2.834
Power losses(pu MW) 0.0287
Fuel Cost($/hour) 608.48
[image:5.595.310.542.602.759.2]NOx Emission(puKg/hour) 0.2258
Table-6: Best 𝑵𝑶𝑿 emission (Test system-2)
P1(pu MW) 0.3073
P2(pu MW) 0.4986
P3(pu MW) 0.4619
P4(pu MW) 0.4410
P5(puMW) 0.6067
P6(puMW) 0.5526
Demand(pu MW) 2.834
Power losses(pu MW) 0.0281
𝑁𝑂𝑋 Emission(puKg/hour) 0.2014
[image:5.595.48.284.648.770.2]Table-7: Best Compromised Solution (Test system-2)
P1(pu MW) 0.1278
P2(pu MW) 0.3199
P3(pu MW) 0.6254
P4(pu MW) 0.9289
P5(puMW) 0.5067
P6(puMW) 0.3548
Demand(pu MW) 2.834
Power losses(pu MW) 0.0279
𝑁𝑂𝑋 Emission(puKg/hour) 0.2164
Fuel Cost($/hour) 613.5433
Combined cost($/hour) 627.4119
6.
CONCLUSION
An extensive study of GA based CEELD is presented in this paper. The proposed genetic algorithm (GA) applied on two standard test systems. A short term thermal generation scheduling is presented for Test system-1. Compromised solution is obtained for both test systems. Improved version or the hybrid GA may be used in future to solve CEELD problems. In this paper the oxides of nitrogen is used as an emission objective. Oxides of sulphur, Oxides of carbon or their combination may be used in future as an emission objective.
7.
REFERENCES
[1] D.P. Kothari, and J.S. Dhillion , Power system optimization‟‟, 2nd edition, PHI,2011,INDIA
[2] Yee Ming Chen and Wen-Shiang Wang, “ A particle swarm approach to solve the environmental/economic dispatch problem.‟‟ International journal of Industrial Engineering computation 1(2010)157-172
[3] D.P.Kothari and K.P.SinghParmar, A Noval Approach for Eco-friendly and Economic Power Dispatch using MATLAB,IEEE Conference. PEDES,2006, New Delhi, INDIA.
[4] EI-Keib AA, Ma H, Hart JL. Economic dispatch in view of the clean air act of 1990. IEEE Trans Power Syst 1994;9(2):972-8.
[5] Talaq JH, EI-Hawary ME. A summary of environmental/economic dispatch algorithms. IEEE Trans power syst 1994;9(3):1508-16
[6] Helsin JS, Hobbs BF. A multiobjective production costing model for analyzing emission dispatching and fuel switching. IEEE Trans Power syst 1989;4(3):836-842
[7] Dhillion J.S, Parti SC, Kothari DP. Stochastic economic emission load dispatch. Electr Power Syst Res 1993; 26:179-86.
[8] Shin-Der Chan and Jiann-Fuh Chen. (2003). A direct Newton-Raphson economic dispatch,Electrical power and Energy Systems,25,411-417.
[9] Muralidharan. S, Srikrishna. K and Subramanian, (2006). Emission constrained economic dispatch-a new recursive approach, Electric power components and systems, 34, 343-353.
[10] Tankut. Y and Onur.K. (2007). A multiobjective optimization method to environmental economic dispatch, Electrical Power and Energy Systems, 29,42-50
[11] Balamurugan. R and Subramanian.S. (2008). A simplified recursive approach to combined economic emission dispatch, Electrical power components and systems, 36(1),17-27
[12] Osman. M.S, Abo-sinna.M.A and Mousa. A.A.(2009). An ε-dominance-based multiobjective genetic algorithm for economic emission load dispatch optimization problem, Electric power systems Research, 79(11), pp. 1561-67
[13] BrodeskySF,Hahn RW. Assessing the influence of power pools on emission constrained economic dispatch and fualswitching.IEEE Trans Power Syst 1986;(1):57-62
[14] Goldberg DE. Genetic algorithm for search , optimization, and machine learning. Reading, MA: Addision-Wesley; 1989
[15] Fonseca CM,Fleming PJ. An overview of evolutionary algorithms in multiobjective optimization.EvolComput 1995;3(1):1-16.
[16] A.Lakshmi Devi and O. Vamsi Krishna, „Combined economic and emission dispatch using evolutionary algorithms-a case study‟. ARPN Journal of Engineering and Applied Sciences.VOL.3, NO.6, DECEMBER, 2008
[17] Yee Ming Chen and Wen-Shiang Wang, „A Particle swarm approach to solve environmental/economic dispatch problem‟ . International Journal of Industrial Engineering Computation1 (2010)157-172.
[18] S. Hemamalini and S. P. Simon, Emission constrained economic dispatch with valve point loading effect using particle swarm optimization , IEEE Region 10 conference TENCON 2008, pp.1-6, 2008.
[19] M.Sailaja Kumari and M.Sydulu, A Fast Computational Genetic Algorithm for Economic Load Dispatch‟ International Journal of Recent Trends in Engineering Vol. 1, No. 1, May 2009.