Visual Spatial Attention Tracking Using
High-Density SSVEP Data for Independent
Brain–Computer Communication
Simon P. Kelly
, Member, IEEE
, Edmund C. Lalor
, Member, IEEE
, Richard B. Reilly
, Senior Member, IEEE
, and
John J. Foxe
Abstract—The steady-state visual evoked potential (SSVEP) has been employed successfully in brain–computer interface (BCI) research, but its use in a design entirely independent of eye movement has until recently not been reported. This paper presents strong evidence suggesting that the SSVEP can be used as an electrophysiological correlate of visual spatial attention that may be harnessed on its own or in conjunction with other correlates to achieve control in an independent BCI. In this study, 64-channel electroencephalography data were recorded from subjects who covertly attended to one of two bilateral flicker stimuli with superimposed letter sequences. Offline classification of left/right spatial attention was attempted by extracting SSVEPs at optimal channels selected for each subject on the basis of the scalp distribution of SSVEP magnitudes. This yielded an average accuracy of approximately 71% across ten subjects (highest 86%) comparable across two separate cases in which flicker frequencies were set within and outside the alpha range respectively. Further, combining SSVEP features with attention-dependent parieto-oc-cipital alpha band modulations resulted in an average accuracy of 79% (highest 87%).
Index Terms—Alpha, brain–computer interface (BCI), electro-encephalography (EEG), gating, spatial selective attention, steady-state visual evoked potential (SSVEP).
I. INTRODUCTION
F
OR SOME people with very severe disabilities (e.g., amyotrophic lateral sclerosis or brainstem stroke), a brain–computer interface (BCI) may be the only feasible channel for communicating with others and for environment control [1]. The most favorable brain imaging method employed in BCI’s is electroencephalography (EEG), in which electrical signals of high temporal resolution are recorded noninvasivelyManuscript received December 18, 2004; revised February 10, 2005; accepted February 21, 2005. This work was supported in part by a joint MLE/UCD Research Programme, as facilitated by the Higher Educational Authority. The laboratory at St. Vincent’s Hospital was supported by Merck Research Labs. The work of S. P. Kelly (in New York) was supported by Enterprise Ireland under an International Collaboration grant. The work of J. J. Foxe was supported by the National Institutes of Mental Health under Grant MH65350.
S. P. Kelly, E. C. Lalor, and R. B. Reilly are with the Department of Electronic and Electrical Engineering, University College Dublin, Dublin 4, Ireland, and also with the Cognitive Neurophysiology Laboratory, St. Vincent’s Hospital, Fairview, Dublin 3, Ireland (e-mail: [email protected]).
J. J. Foxe is with the Department of Psychology, City College, City Univer-sity of New York, New York, NY, 10031 USA, and with the Cognitive Neuro-physiology Laboratory, Nathan S. Kline Institute, Orangeburg, New York 10962 USA, and also with the Cognitive Neurophysiology Laboratory, St. Vincent’s Hospital, Fairview, Dublin 3, Ireland.
Digital Object Identifier 10.1109/TNSRE.2005.847369
from the scalp. The existing EEG-based BCI designs rely on a variety of EEG signal features, e.g., slow cortical potentials [2], oscillatory activity [3], [4], P300 potentials [5], motor-related potentials [6] and visual evoked potentials (VEPs) [7]–[9].
One BCI solution, which has had success in optimizing performance in terms of both speed and accuracy, relies on an involuntary response known as the steady-state visual evoked potential (SSVEP). This is a periodic response elicited by the repetitive presentation of a visual stimulus, at a rate of 6–8 Hz or more [10]. While the existing SSVEP-based BCIs are ex-ceptionally robust and convenient to implement [8], [9], most designs require reliable control of eye movement—the subject makes selections by shifting gaze direction. This unfortunately rules out applicability to those whose severe disabilities extend to impaired ocular motor control.
Though the specific underlying mechanisms of the SSVEP are as yet not well understood, there have been several accounts of its reactivity to cognitive variables such as attention, stim-ulus classification and memory search [11], [12]. Of particular interest are reports of the SSVEP behaving as an index of vi-sual-spatial selective attention[13], which is the mechanism by which the brain identifies and focuses on discrete locations in vi-sual space for preferential processing. This attentional selection can be performed independent of gaze direction, i.e., compo-nents in peripheral vision (covert attention) may be selected for processing just as those in foveal vision (overt attention) [14]. In [13], it was found that when subjects covertly attended to a flicker stimulus in one visual field the amplitude of the SSVEP resulting from that stimulus was enhanced by about a factor of two, compared to when the subject attended to the opposite vi-sual field.
Prompted by the aforementioned results [11], [13], a pilot ver-sion of the visual-spatial attention control (V-SAC) BCI was de-veloped [15]. In this study, the feasibility of making selections in real time by deploying visual spatial attention on cue was demonstrated using a basic paradigm with bilateral stimuli, and with the aid of feedback. Of 11 subjects, six succeeded in pro-ducing the required SSVEP modulations to achieve reasonable accuracy [15].
Operation of the real-time implementation of [15] was based on measurements from only two bilateral occipital electrodes. However, due to anatomical differences in the visual cortex, the spatial distribution and amplitude of electrophysiological re-sponses to covertly attended visual stimuli differ across individ-uals. Also, the scalp distribution of the SSVEP is influenced by
other factors such as frequency of stimulation and location in space [10].
Thus, the aim of this study was to use high-density (64-channel) EEG data to characterize the topography of SSVEP modulations, so that separability of features during covert attention to the left and right visual field could be optimized.
Further, in [15], flicker frequencies were set within the alpha band (8–14 Hz) due to the resulting high signal to noise ratio, but it is not clear whether this is advantageous over nonalpha band frequencies. Accordingly, a second aim of this study was to compare frequencies within and outside the alpha band. We address these critical issues by performing offline left/right clas-sification of SSVEP data. In addition, effects of behavioral per-formance on BCI accuracy are assessed.
Finally, the utility of using the SSVEP magnitude features in conjunction with attention-dependent alpha band activity was explored. Increases in parieto-occipital alpha have been reported to mark the disengagement of processing of visual input during a biased attentional state [16], [17]. In [17], this was found in the cue-stimulus interval of a visual spatial cueing paradigm in-volving bilateral stimuli. Focal increases of alpha band activity were seen over occipital cortex contralateral to the direction of the to-be-ignored stimulus, reflecting anticipatory biasing of vi-sual spatial attention. This effect was utilized in offline left/right classification for a BCI in [18], in which, alpha modulation fea-tures on their own provided an average accuracy of 73% using the data of the present study. It is predicted that combining these features with the SSVEP features will increase accuracy across a group of individuals.
II. EXPERIMENTALMETHODS
A. Subjects
Ten subjects aged between 22 and 30 participated in the study. All had normal or corrected-to-normal vision.
B. Experimental Setup
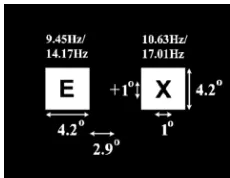
Subjects were seated 60 cm from a CRT monitor on which was displayed two white rectangular flicker stimuli situated 2.9 bilateral to a central fixation cross (centered on the horizontal meridian) on a black background, as shown in Fig. 1. The ac-tual refresh rate of this monitor, while on the 85-Hz setting, was measured as 85.05 Hz. Two stimulus settings were used in testing. For the first setting (ALPHA) the left rectangle was switched ON (white) for one frame and OFF (black) for eight frames giving a flicker rate of 9.45 Hz. The right rectangle was ON for one frame and OFF for seven giving a flicker rate of 10.63 Hz. For the second setting (NONALPHA), the left rec-tangle was flickered at 14.17 Hz and the right recrec-tangle was flickered at 17.01 Hz.
[image:2.594.368.483.63.152.2]Event-related potential (ERP) studies examining the static al-location of visual spatial attention normally involve the task of target detection. In the center of each of the white rectan-gles (4.2 4.2 of visual angle), letters from “A” through “H” (1 1 ) were presented in a random pattern, similar to the para-digm employed in [13]. Embedded in the sequence of letters was
Fig. 1. Stimulus display.
the target letter “X,” occurring with equal probability ( 0.11). Subjects were instructed to keep count of target presentations during each trial and report this number on completion of the trial. This provides a behavioral measure of spatial attention per-formance in terms of error rates and ensured that spatial atten-tion mechanisms are engaged in the correct way. The letter in each rectangle was changed after three flashes of the white rec-tangle on which it was superimposed.
Continuous EEG signals were recorded from 64 electrode positions referenced to location AFz, filtered over the range 0–134 Hz and digitized at a rate of 512 Hz using the BioSemi Active Two system. In addition, horizontal electrooculographic (EOG) data were recorded using two electrodes placed at the outer canthi of the eyes, with the left rereferenced to the right in the offline data.
C. Procedure
Each subject underwent a total of ten sessions, each lasting under 5 min. For five of the sessions the stimuli were flickered at the ALPHA setting, while the NONALPHA setting was used for the other five sessions, ordered alternately with the beginning setting counterbalanced across subjects. Each trial started with a red warning stimulus lasting 0.5 s, followed by a cue stimulus consisting of a white fixation cross of the same size with an arrow on the left or right arm, lasting 0.5 s. Depending on the direction of the arrow, the subject was instructed to covertly attend to the left or right rectangle while strictly maintaining fixation on the central fixation cross for 8 s. Following the attend period a green fixation cross was presented for 5 s, signifying a rest period. Each session consisted of 20 trials, with an equal number cued-left as cued-right, in random order.
In addition, six subjects underwent one session in which eye movement to the cued stimulus was permitted. This enabled a comparison of performance for overt versus covert attention.
III. ANALYSISMETHODS
A. Channel Selection
B. SSVEP Feature Extraction
From each 8-s attend period, three segments were extracted using rectangular windows starting at 0, 2, and 4 s, each of which counted as a single case for which the feature is derived. For the ALPHA sessions, these segments were 3.39 s long and for NONALPHA sessions, they were 3.52 s. These segment lengths where chosen so that they contained an integral number of cy-cles of the corresponding frequencies in order to minimize spec-tral leakage [19].
For ALPHA sessions, the power at 9.45 and 10.63 Hz was calculated for each of the preselected channels by multiplying each segment by sine and cosine functions at the corresponding frequencies and taking the root mean square of these two values. This is equivalent to performing a fast Fourier transform (FFT) at single frequencies. Similarly, the power at 14.17 and 17.01 Hz for preselected channels was calculated for NON-ALPHA sessions.
The following four-dimensional feature was then extracted for each case
(1)
where is the power at frequency at electrode loca-tionAfor case . This feature was extracted for 10 pairs of electrodesAandBfrom the subset identified for each subject in order to identify exactly which pair would yield the best perfor-mance for each subject.
C. Alpha Band Feature Extraction
For each segment extracted as detailed in the previous section, the FFT was calculated at two pairs of electrode locations, PO7 and O1 over the left hemisphere and PO8 and O2 over the right hemisphere. The mean power over the alpha range (8–14 Hz) was then calculated at each electrode location, and consequently averaged over each electrode pair providing a measure of alpha power for each hemisphere.
D. EOG Analysis
Given the nature of the study and its intended application, it is crucial to detect, examine, and quantify horizontal eye movements as the subjects performed the task. To facilitate this, two EOG calibration sessions were carried out in order to char-acterize EOG patterns indicative of eye movements potentially resulting in inappropriate facilitation of SSVEP modulation. During the first EOG calibration session, subjects performed brief cued eye movements to four displacement angles between the fixation cross and the cued stimulus. This enabled a map-ping from EOG amplitude ( V) to visual angle, assuming a linear relationship within the range of interest [20]. The angles used were 0.5 , 2.9 , 5 , and 7.1 corresponding to the end of the horizontal leg of the fixation cross, the inner edge, the center and the outer edge of the cued stimulus, respectively. On the basis of this mapping, prior to classification, any segments during which there was eye movement exceeding 1 visual angle were rejected. This resulted in a mean rejection rate of 5% for the ALPHA setting (range 3–53 out of 300 segments) and 7% for the NONALPHA setting (range 7–67).
The second EOG calibration session (GAZE-SHIFT) was an experimental session as described in the preceding sections but in this case the subject was instructed to shift gaze from the fix-ation cross to the centrally placed letters of the cued stimulus on every trial immediately following the cue, and hold for the dura-tion of the trial. To examine the specific effect of eye movements on SSVEP modulations, EOG amplitude within each segment was correlated with a one-dimensional (1-D) feature capturing [albeit to a slightly lesser extent than (1)] the attention-depen-dent separability
(2)
where electrodeAis the location of maximum modulation of the SSVEP of frequency , andBof frequency . These corre-lations are calculated for all covert attention sessions and com-pared to those obtained from the overt sessions.
E. Classification
Linear discriminants were used as the classifier model for this study, providing a parametric approximation to Bayes’ rule [21]. Optimization of the linear discriminant model is achieved through direct calculation and is very efficient thus lending it-self well to real-time applications.
Performance of the LDA classifier was assessed using ten-fold cross validation [21]. This scheme randomly divides the available data into ten approximately equal sized, mutually ex-clusive “folds.” For a ten-fold cross validation run, ten clas-sifiers are trained with a different fold used each time as the testing-set, while the other nine folds are used for the training data. Cross validation estimates are generally pessimistically bi-ased, as training is performed using a sub-sample of the avail-able data. For the OVERT session, due to the limited number of trials the LDA classifier performance was assessed using four-fold cross validation.
To assess performance using a combination of SSVEP and alpha band features, a six-dimensional feature vector was used, made up of the four SSVEP magnitude measures plus the alpha power for each hemisphere.
F. Information Transfer Rate
One objective measure of BCI performance is the bit rate, as defined by Wolpawet al.[22]. For a trial with possible sym-bols in which each symbol is equally probable, the probability ( ) that the symbol will be selected is the same for each symbol, and each error has the same probability, the bit rate can be cal-culated as follows:
(3)
(4)
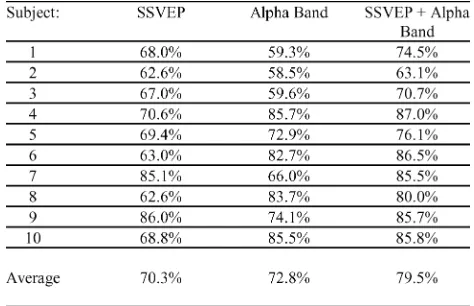
TABLE I
CLASSIFICATIONACCURACIES FORALLSUBJECTSOVER5 SESSIONS
USING THESSVEP FEATUREALONE. ALSOSHOWN ARE THE
OPTIMALELECTRODELOCATIONS FOREACHSUBJECT
TABLE II
CORRELATIONCOEFFICIENTSCALCULATED FOREOG AMPLITUDE AND
FEATUREF1d(n)INCLUDINGGAZE-SHIFTCALIBRATIONSESSION
IV. RESULTS
Table I shows the overall accuracies achieved by all ten sub-jects over five sessions for the SSVEP feature, as well as the optimal electrode locations for each subject. The highest accu-racy was 86% achieved by subject 9. The average performance is comparable across ALPHA and NONALPHA cases and re-duced considerably compared with results of overt attention ses-sions as expected. For further comparison, using O1 and O2 only as in [15] yields an average accuracy of 63%.
The correlation coefficients between mean EOG amplitude over each segment and the feature were calculated for each experimental session and these were averaged for each subject (Table II). Confirming that the feature captures SSVEP separability, the average accuracy using this feature was 67%. For comparison, the correlation coefficients for the GAZE-SHIFT EOG calibration sessions are 0.43 ( 0.001, ALPHA) and 0.81 ( 1 10 , NONALPHA).
Fig. 2. Topographic maps for the NONALPHA sessions of a representative subject (4). (a) Average 14-Hz (top) and 17-Hz (bottom) SSVEP magnitude. (b) Average alpha band power for attend-left and attend-right trials.
Example scalp maps plotting the modulations of the response to both stimulus frequencies can be seen in Fig. 2(a) for a repre-sentative subject for the NONALPHA setting. For this subject, the highest attentional modulation for the 14.17- and 17.01-Hz stimuli was seen at channels P5 and PO7.
To test the relationship between classification accuracy and behavioral performance on the task, correlations were carried out between the accuracies listed in Table I and the number of errors in counting during the experiments. Moderate nega-tive correlations were found, approaching significance (ALPHA
, ; NONALPHA , ).
TABLE III
CLASSIFICATIONACCURACIES FORNONALPHA SESSIONS FORALLSUBJECTS
USING THESSVEP FEATURE, ALPHABANDFEATURE ANDCOMBINATION
the ambiguity was removed from the behavioral measure, and indeed with more subjects, these negative correlations would reach significance.
Table III shows the classification accuracies using the SSVEP features alone (from Table I), the alpha band features alone (reported in [18]) and all features combined. Only the NON-ALPHA sessions were examined, in which the lack of spectral overlap ensures independence of the SSVEP amplitudes from alpha modulations. Fig. 2(b) shows the topography of alpha band power for attend-left and attend-right trials for Subject 4. Focal increases in alpha power can be seen located contralateral to the stimulus to be ignored, similar to the findings of Worden
et al.[17].
Average information transfer rates were calculated for all sub-jects across all sessions using (3) and (4). The average informa-tion transfer rate across subjects for the SSVEP features alone was 2.1 b/min, for the alpha band features it was 2.6 b/min, and for the combination it was 4.6 b/min. A peak information transfer rate of 7.5 b/min was achieved by subject 4 using the combination method.
V. DISCUSSION
The results of this study show that binary decision-making using covert attention to visual stimuli is indeed possible using electrophysiological correlates of spatial attention such as the steady-state visual evoked potential. With recent BCI research moving toward more invasive technologies and focusing more on signal processing, this represents a valuable new EEG-based approach that focuses on cognitive mechanisms that are devel-oped naturally through everyday life, and that are truly indepen-dent of neuromuscular function.
Direction of spatial attention can be classified using SSVEP magnitude alone with an accuracy of approximately 71%. Importantly, correlation coefficients calculated for accuracies and error rates are negative and marginally significant, sug-gesting that performance in producing the appropriate SSVEP modulations on cue by effectively deploying spatial attention hinges on compliance, i.e., high motivation leads to improved
performance. This is central to the success of any practical BCI systems employed by the disabled [1], [2].
The advantage in choosing subject-specific electrode loca-tions is demonstrated by the widely varying scalp sites iden-tified as optimal for each of the ten subjects. In [13], the au-thors report that, in general, attentional modulation of SSVEP’s is manifest mostly over the right hemisphere. However, in [11], higher stimulation frequencies are employed, and sites of max-imum modulation are identified on the hemisphere contralateral to the attended stimulus. As exemplified in Fig. 2(a), some indi-viduals participating in this study demonstrated greater modu-lations over the left hemisphere. Thus, subject-by-subject iden-tification of optimal locations appears to be needed in such a system as that proposed in this study.
The results of EOG post-processing highlight to what degree the performance in this study was indeed independent of pe-ripheral muscles and nerves. Detection of trials containing eye movements in excess of 1 resulted in 6% cases rejected overall. Also, correlation coefficients listed in Table II quantify the ef-fect of any eye movement measured in the EOG on the 1-D feature. Correlation values for the experimental sessions were much reduced in comparison with the correlation value for the GAZE-SHIFT EOG calibration run.
The results of using SSVEP features alone suggest that no ad-vantage is gained by using frequencies either within the alpha band or outside. Accuracy differed by at least 15% only for sub-jects 7 and 8, with the advantage apparent for the NONALPHA setting for subject 7 and the opposite seen for subject 8. This may reflect a tradeoff resulting from feature properties at dif-ferent frequencies. On one hand, the resonant properties of alpha [23] lead to enhanced SSVEP magnitudes on stimulation within the alpha band, and this results in clearly resolvable spectral peaks and thus a higher signal to noise ratio. This is of consider-able benefit in a real-time BCI scenario where a robust baseline SSVEP level is required at all times. On the other hand, it is possible that SSVEPs generated within the alpha band are sub-ject to the same modulations as those affecting the wider alpha band, of which there are many reports (e.g., [24]). In particular, attention-dependent increases of parieto-occipital alpha, as de-scribed in [16] and [17], may degrade performance if scalp lo-cations for SSVEP features coincide with these alpha modula-tions. However this depends on the degree to which instability in the wider alpha band affects a narrow-bandwidth SSVEP signal, which is unknown. This suggests that it is not only important to select channels on a subject-by-subject basis, but that the choice of stimulus frequencies should also be specific to indi-vidual subjects.
features. Combining the features however results in all six of these subjects achieving an accuracy of at least 80%. In other cases, the combination provides a significantly higher accuracy than either SSVEP or alpha band features alone.
VI. CONCLUSION
Utilizing a combination of electrophysiological correlates of visual spatial attention (SSVEP magnitudes and alpha band power modulations), binary selections can be made with an average accuracy of 79%. It is found in this study that careful selection of electrode locations on an individual basis leads to an advantage in optimizing separability of SSVEP magnitude features. It remains unclear as to whether an advantage can be gained in the selection of stimulation frequencies, however, stimulation outside the alpha band allows the alpha band to be used itself in improving accuracy. This provides a novel independent BCI design which relies in no way on the normal output pathways of peripheral muscles and nerves, and thus may have considerable impact on alternative communication and control technology for the disabled.
ACKNOWLEDGMENT
The authors would like to acknowledge C. Finucane and P. de Chazal for their valuable input to the study. The scalp maps of Fig. 2 were generated using the EEGLAB toolbox of Delorme & Makeig (http://sccn.ucsd.edu/eeglab/).
REFERENCES
[1] J. R. Wolpaw, N. Birbaumer, D. J. McFarland, G. Pfurtscheller, and T. M. Vaughan, “Brain–computer interfaces for communication and control,”
Clin. Neurophysiol., vol. 113, no. 6, pp. 767–791, 2002.
[2] N. Birbaumer, A. Kubler, N. Ghanayim, T. Hinterberger, J. Perelmouter, J. Kaiser, I. Iversen, B. Kotchoubey, N. Neumann, and H. Flor, “The thought translation device (TTD) for completely paralyzed patients,”
IEEE Trans. Neural Syst. Rehab. Eng., vol. 8, no. 2, pp. 190–193, Jun. 2000.
[3] G. Pfurtscheller and C. Neuper, “Motor imagery and direct brain–com-puter communication,”Proc. IEEE, vol. 89, no. 7, pp. 1123–1134, Jul. 2001.
[4] J. R. Wolpaw, D. J. McFarland, G. W. Neat, and C. A. Forneris, “An EEG-based brain–computer interface for cursor control,” Electroen-cephalogr. Clin. Neurophysiol., vol. 78, pp. 252–259, 1991.
[5] L. A. Farwell and E. Donchin, “Talking off the top of your head: Toward a mental prosthesis utilizing event-related brain potentials,” Electroen-cephalogr. Clin. Neurophysiol., vol. 70, no. 6, pp. 510–523, 1988. [6] D. Burke, S. P. Kelly, P. De Chazal, R. B. Reilly, and C. Finucane, “A
parametric feature extraction and classification strategy for brain–com-puter interfacing,”IEEE Trans. Neural Syst. Rehab. Eng., vol. 13, no. 1, pp. 12–17, Mar. 2005.
[7] E. E. Sutter, “The brain response interface: Communication through vi-sually induced electrical brain responses,”J. Microcomput. Applicat., vol. 15, pp. 31–45, 1992.
[8] M. Cheng, X. Gao, S. Gao, and D. Xu, “Design and implementation of a brain–computer interface with high transfer rates,”IEEE Trans. Biomed. Eng., vol. 49, no. 10, pp. 1181–1186, Oct. 2002.
[9] E. Lalor, S. P. Kelly, C. Finucane, R. Burke, R. B. Reilly, and G. Mc-Darby, “Brain computer interface based on the steady-state VEP for im-mersive gaming control,”Biomed. Tech., vol. 49, no. 1, pp. 63–64, 2004. [10] D. Regan, Human Brain Electrophysiology: Evoked Potentials and Evoked Magnetic Fields in Science and Medicine. New York: Else-vier, 1989.
[11] M. M. Muller, T. W. Picton, P. Valdes-Sosa, J. Riera, W. A. Teder-Sale-jarvi, and S. A. Hillyard, “Effects of spatial attention on the steady-state visual evoked potential in the 20–30 Hz range,”Cogn. Brain Res., vol. 6, pp. 249–261, 1998.
[12] R. B. Silberstein, J. Ciociari, and A. Pipingas, “Steady-state visually evoked potential topography during the Wisconsin Card sorting task,”
Electroencephalogr. Clin. Neurophys., vol. 96, pp. 24–35, 1995. [13] S. T. Morgan, J. C. Hansen, and S. A. Hillyard, “Selective attention to
stimulus location modulates the steady state visual evoked potential,” in
Proc. Natl. Acad. Sci., vol. 93, 1996, pp. 4770–4774.
[14] D. LaBerge, Attentional Processing—The Brain’s Art of Mindful-ness. Cambridge, MA: Harvard Univ. Press, 1995.
[15] S. P. Kelly, E. Lalor, C. Finucane, G. McDarby, and R. B. Reilly, “Visual spatial attention control in an independent brain–computer interface,”
IEEE Trans. Biomed. Eng., 2005, to be published.
[16] J. J. Foxe, G. V. Simpson, and S. P. Ahlfors, “Parieto-occipital10 Hz activity reflects anticipatory state of visual attention mechanisms,” Neu-roreport, vol. 9, pp. 3929–3933, 1998.
[17] M. S. Worden, J. J. Foxe, N. Wang, and G. V. Simpson, “Anticipa-tory biasing of visuospatial attention indexed by retinotopically specific alpha-band electroencephalography increases over occipital cortex,”J. Neurosci., vol. 20, no. 6, pp. RC63: 1–6, 2000.
[18] S. P. Kelly, E. Lalor, R. B. Reilly, and J. J. Foxe, “Independent brain com-puter interface control using visual spatial attention-dependent modula-tions of parieto-occipital alpha,” inProc. 2nd Int. IEEE Engineering in Medicine and Biology Soc. Conf. Neural Engineering, Mar. 2005, pp. 667–670.
[19] F. J. Harris, “On the use of windows for harmonic analysis with the discrete Fourier transform,”Proc. IEEE, vol. 66, pp. 51–83, 1978. [20] R. Barea, L. Boquete, and M. Mazo, “System for assisted mobility using
eye movements based on electrooculography,”IEEE Trans. Neural Syst. Rehab. Eng., vol. 10, no. 4, pp. 209–218, Dec. 2002.
[21] B. D. Ripley,Pattern Recognition and Neural Networks. Cambridge, U.K.: Cambridge Univ. Press, 1996.
[22] J. R. Wolpaw, H. Ramoser, D. J. McFarland, and G. Pfurtscheller, “EEG-based communication: Improved accuracy by response verifica-tion,”IEEE Trans. Neural Syst. Rehab. Eng., vol. 6, no. 3, pp. 326–333, Sep. 1998.
[23] G. R. Burkitt, R. B. Silberstein, P. J. Cadusch, and A. W. Wood, “Steady-state visual evoked potentials and travelling waves,”Clin. Neurophysiol., vol. 111, no. 2, pp. 246–258, 2000.
[24] W. Klimesch, “EEG alpha and theta oscillations reflect cognitive and memory performance: A review and analysis,”Brain Res. Rev., vol. 29, no. 2–3, pp. 169–195, 1999.
Simon P. Kelly(M’04) received the B.E. degree in electronic engineering in 2001 from University Col-lege Dublin, Dublin, Ireland, where he is currently working toward the Ph.D. degree in the Department of Electronic and Electrical Engineering.
His current research is centered on the human attention system, studied from both a cognitive neurophysiology and rehabilitation engineering perspective.
Edmund C. Lalor(M’05) received the B.E. degree in electronic engineering from University College Dublin, Dublin, Ireland, in 1998, and the M.Sc. degree in electrical engineering from the University of Southern California, Los Angeles, in 1999. He is currently working toward the Ph.D. degree in the De-partment of Electronic and Electrical Engineering, University College Dublin.
Richard B. Reilly(M’92–SM’04) received the B.E., M.Eng.Sc., and Ph.D. degrees, all in electronic en-gineering, from the National University of Ireland, Dublin, in 1987, 1989, and 1992, respectively.
In 1988, he joined Space Technology Ireland and the Department de Recherche Spatiale (CNRS group), Paris, France, developing DSP-based onboard experimentation for the NASA satellite WIND. In 1990, he joined the National Rehabil-itation Hospital, Dublin, and, in 1992, became a Postdoctoral Research Fellow with the University College Dublin, focusing on signal processing for speech and gesture recog-nition. Since 1996, he has been on the Academic Staff in the Department of Electronic and Electrical Engineering, University College, Dublin. He is currently a Senior Lecturer and researches into neurological signal processing and multimodal signal processing. He is a reviewer for theJournal of Applied Signal Processing and was Guest Editor for the mini issue on Multimedia Human-Computer Interface, September 2004.
Dr. Reilly is the Republic of Ireland representative on the Executive Com-mittee of the IEEE United Kingdom and Republic of Ireland Section. He is an Associate Editor for IEEE TRANSACTIONS ON MULTIMEDIA and also a reviewer for IEEE TRANSACTIONS ON BIOMEDICALENGINEERING, IEEE TRANSACTIONS ON NEURAL SYSTEMS AND REHABILITATION ENGINEERING, IEEE TRANSACTIONS ON INDUSTRIAL ELECTRONICS, IEEE TRANSACTIONS ONSIGNALPROCESSING, andIEE Proceedings Vision,Image and Signal Pro-cessing. He was the 1999/2001 Silvanus P. Thompson International Lecturer for the IEE. In 2004, he was awarded a U.S. Fulbright Award for research collaboration into multisensory integration with the Nathan Kline Institute for Psychiatric Research, Orangeburg, New York.
John J. Foxe received the B.Sc. degree in ex-perimental psychology from Iona College, New Rochelle, NY, in 1989, and the He received the M.Sc. and Ph.D. degrees from the Department of Neuroscience, Albert Einstein College of Medicine, New York, in 1996 and 1999, respectively.