Journal of Chemical and Pharmaceutical Research, 2014, 6(3):351-355
Research Article
CODEN(USA) : JCPRC5
ISSN : 0975-7384
The discussion and simulation for image edge detection techniques based on
wavelet transform algorithm
Guiyang He
Department of Culture Industry Management, Chongqing City Management College, Shapingba, Chongqing, China
_____________________________________________________________________________________________
ABSTRACT
Based on the characteristics of wavelet analysis, this paper designs the algorithm on the four steps of the image edge detection filtering, enhancement, detection and localization, gets the threshold with the best effect is 0.009, uses Matlab simulation, compares its simulation results with the classical simulation results, obtains that wavelet transform algorithm avoids the appearance of noise and false edge in image edge detection, and reflects the advantages of the algorithm in the application of this field.
Key words: Wavelet transforms, Matlab simulation, Edge detection
_____________________________________________________________________________________________
INTRODUCTION
The general appearance of the edge is related to the angle, surface texture, surface shape, and the perspective projection. By the method of finding the optimal value of the image’s one-order derivative, determine the maximum gradient direction. This maximum direction is defined as the boundary position of the image. Furthermore we can determine the borders by finding the second derivative zero crossing of the image. With the progress of the wavelet theory study, its applications have increasingly widely spread up, its advantages have gradually revealed in filtering, signal and image processing. The wavelet analysis adopts stepwise fine time domain and frequency domain sampling step on the high-frequency component, which can focus on any detail of the image [1-3]. Thus, the image edge detection algorithm based on wavelet transform has become a hot in the field of image processing [4].
Based on the previous study, this study designs a wavelet-based edge detection algorithm, embodies the superiority of the algorithm in order to develop this technology further.
CLASSIC EDGE DETECTION ANALYSIS
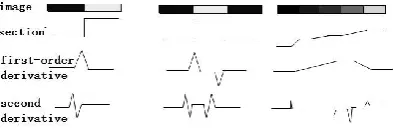
[image:1.595.209.406.669.734.2]In the digital image processing, edge detection is an important part of image analysis and pattern recognition. The edge of the image refers to the set of pixels where the image gray occurs space mutations. The gray mutation level reflects the change degree and change speed of the gray level with the position, and it is generally described with the derivative [5-7]. The common gradation mutations include phase step-shaped, slope-shaped and roof-shaped three categories, as shown in Figure 1:
Edge detection means using the template to conduct convolution operation on the image’s intensity matrix. The operator multiply each pixel of the image region with each corresponding element of the template gray matrix, the sum of the products is regarded as the new pixel value of the region center, as shown in the formula (1):
n convolutio 9 8 7 6 5 4 3 2 1 9 8 7 6 5 4 3 2 1 G G G G G G G G G G R R R R R R R R R R (1)
In Formula (1) the matrix
R
represents the image matrix of an area, the matrixG
represents the template matrix, and the convolution result is to replace the elementR
5 in matrixR
with a new value
9 1 i i iG R
. A continuous image
function is represented as f
x,y , and its one-order derivative is yf x f ,
, therefore generally we use two templates to conduct convolution operation on the image, and take the maximum value as the new pixel, this template is called the operator in Matlab [8].
WAVELET ANALYSIS
The wavelet transform this mathematical tool has been widely used in recent years; compared with the Fourier transform and window Fourier transform it can more effectively extract information from the signal.
Wavelet transform can conduct multi-scale decomposition to noisy histogram, can roughly identify the image’s segmentation threshold in the larger scale, and then gradually decreases the scale until precise positioning. The idea of the wavelet transform is to decompose the image histogram into wavelet coefficients at different levels by binary wavelet transform, then select threshold according to the given segmentation criteria and wavelet coefficients, and finally marks the edge point of the image by threshold.
Wavelet Transform
The image’s histogram can be implemented by using Matlab software, which can be seen as a one-dimensional signal; the mutation points on the histogram can reflect the characteristics of gradation change of image. By detecting the characteristics of singular point and regional extreme point of histogram wavelet transform, use the multi-scale features of wavelet transform to achieve the threshold segmentation of the image. When the generating function of the wavelet is a one-order derivative of a smooth function, the wavelet transform’s modulus of the signal can achieve maximum value at the mutation points in the signal; then use the high-frequency component of wavelet transform to conduct noise reduction to the mutation information and noise of the image, and get the edge image. With the increase of the wavelet transform scale, the maxima of the wavelet transform modulus caused by noise is decreasing sharply, but the filter module value of the image edge does not change with the transformation scale. Thus the wavelet transform can further reduce the signal to noise ratio and detect the image edges.
Define a two-dimensional wavelet function1
x,y,2 x,y , its expression is shown in formula (2) below:
y y x y x x y x y x , , , , 2 1 (2)In Formula (2)
x,y represents a two-dimensional halo function, the partial derivative in both directions ofy
x
,
can be used as the generating function of the two-dimensional wavelet transform. The wavelet generatingfunction of the two-dimensional wavelet transform in different scales of
is in formula (3) below:
2 2 2 2 1 1 , , , ,
y x y x y x y x (3)
x
y
______________________________________________________________________________
and smooth function
x
,
y
in different scales
, the smooth source image function can be obtained. The wavelet transform off
x
,
y
under scale
is as formula (4) below:
d y x x f y x f W dt y t x y t f y x f W , , , , , , 2 2 1 1 (4)When
2
j
, the gradient vector model and the argument expression of the image are in formula (5) below:
y x f W y x f W y x f A y x f W y x f W y x f M j j j j j j , , arctan , , , , 1 2 2 2 2 2 1 2 2 2 2 1 2 2 (5)In Formula (5)
M
2jf
x
,
y
represents the modulus of the gradient vector,A
2jf
x
,
y
represents the directionangle of vector the; detect only along the direction of the gradient vector
A
2jf
x
,
y
to find the maximum valuepoints of
M
2jf
x
,
y
, the pixel coordinates of these maximum value points are the multi-scale edge point.Wavelet segmentation algorithm
The calculating amount for the segmentation algorithms is in a linear relationship between the image sizes. In the
multi-resolution analysis of the histogram,
j
Z
and
k k Z
dj j,
2 represents a group of evenly spaced samples
on the real number axis. When the sampling interval
i
j
, parameterd
jmeans the sampling point with low resolution, and vice versa for sampling points with high resolution. Functionf
x
,
y
is the input image with integer pixel coordinates,g
represents the maximum gradation of the image and the expression of the histogram is shown in formula (6) below:
x
y
f
x
y
k
k
g
k
h
f(
)
,
:
,
;
0
,
(6)In Formula (6) hf(k)represents the discrete function, whenhf(x)hf(k),x
k,k1
, hf(x)represents acontinuous function; use f
i
h
to represent the histogram in the resolution ratioj
,h
jf can be represented by thetranslation and stretching of the Haar scaling function
x
, as shown in formula (7) below:
Z n j j f fj x h n x n
h x x x x 2 ) 2 ( 1 , 0 , 0 1 0 , 1 (7)
It satisfies the superposition theorem, and the curve
h
f
x
after superimposition is as formula (8):
Ji k Z
k j k j Z k k k
f
x
a
b
h
0 , , , 0
(8)In Formula (8)
J
representslog
2
L
,L
represents the maximum gradation value of the image.Suppose the gray scale change range of the image is 0, 1, 2… N-1, the corresponding pixel of the gray value
i
isn
i,
N10
i i
n
M
(9)
The probability of the gray value
i
is in formula (10):
M
n
i
P
i(10)
In order to establish multi-resolution resolve expression of the wavelet transform, introduce the scaling function, and its Fourier transform satisfies the equation (11):
jx
x
2
(11)
Under the low-pass filtering effect of
x
, the low-pass component of the image histogram can be derived as shown in the formula (12):
H
x
d
x
H
S
2j 2j(12)
When the image signal goes through wavelet transform in the scale of
2
j, the high frequency part by smoothing filter out can still be recovered by a larger scale wavelet transform. Multi-resolution waveletdecomposition of histogram signals is consist of the approximation signal
S
2j
H
x
with the lowest resolutionand the detailed signal
W
2jH
x
with a set of resolutions, is the representation in frequency domain and timedomain, which provides a hierarchical framework for the continuous fine of the image.
Edge detection Matlab simulation of Wavelet transform
Based on the above theory, for image edge detection we use the method of wavelet transform to conduct algorithm design and Matlab simulation. The generated effect diagram by running the program is shown in Figure 2:
Figure 2: Optimal threshold edge detection effect diagram of wavelet transform
[image:4.595.222.391.651.751.2]In figure 2, from left to right they are respectively the original image, the effect diagram with a threshold value of 0.01, the effect diagram with a threshold value of 0.005, the effect diagram with a threshold value of 0.007, the effect diagram with a threshold value of 0.009 and the effect diagram with a threshold value of 0.0001. The best effect is the threshold of 0.009.
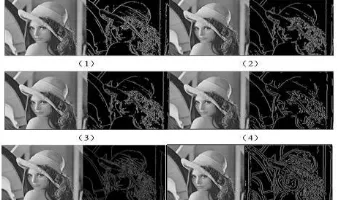
Figure 3 shows the comparison situation between the optimal effect diagrams of edge detection algorithm with the original diagram.
______________________________________________________________________________
Results comparison: wavelet edge detection algorithm can not only filter out noise but also maintain the edge characteristics; the edge’s continuity is better; the image edge detection method based on wavelet transform has better continuity and noise immunity ability than the other methods.
CONCLUSION
Wavelet analysis is a new time-frequency analysis method; this analysis method overcomes the defects of the Fourier transform in a single resolution, and can reflect the signal’s partial information in both time domain and frequency domain. Wavelet analysis adopts a lower time resolution for relatively stable signal, thus improving the frequency resolution; for the high-frequency signals it can use lower frequency resolution to determine the precise positioning of the time. Based on the characteristics of wavelet analysis, this paper designs the algorithm on the four steps of the image edge detection filtering, enhancement, detection and localization, uses Matlab simulation, and gets the threshold with the best effect is 0.009. By comparing its simulation results with the classical simulation results, this paper obtains that wavelet transform algorithm avoids the appearance of noise and false edge in the image edge detection, reflects the advantages of the algorithm in the application of this field, and provides theoretical basis for the future edge detection technology of the image.
REFERENCES
[1] Wu Jiong, Zhang Xiu-bin. Control & Automation, 2004, 20(5), 106-107.
[2] Wang Kun, Liu Tian-wei. Journal of Shenyang Normal University, 2005, 23(2), 161- 165. [3]Wan Hua-zhe. journal Of Nanchang Junior College, 2010, 3, 154-156.
[4]Li Ke. Journal of Shenyang Sport University.2012, 31(2), 111-113.
[5]Zhang Shu-xue. Journal of Nanjing Institute of Physical Education. 1995, 31(2), 25-27.