I m p r o vi n g t h e e n e r g y e ffici e n c y
fo r t h e WB S N b o t tl e n e c k z o n e
b a s e d o n r a n d o m li n e a r n e t w o r k
c o di n g
Al S h a h e e n , H a n d Tak r u ri-Riz k, H
h t t p :// dx. d oi.o r g / 1 0 . 1 0 4 9 /i e t-w s s . 2 0 1 7 . 0 0 5 6
T i t l e I m p r o vi n g t h e e n e r g y e ffici e n cy fo r t h e WB S N b o t tl e n e c k zo n e b a s e d o n r a n d o m li n e a r n e t w o r k c o di n g
A u t h o r s Al S h a h e e n , H a n d Tak r u r i-Riz k, H
Typ e Ar ticl e
U RL T hi s v e r si o n is a v ail a bl e a t :
h t t p :// u sir. s alfo r d . a c . u k /i d/ e p ri n t/ 4 3 9 0 4 /
P u b l i s h e d D a t e 2 0 1 7
U S IR is a d i gi t al c oll e c ti o n of t h e r e s e a r c h o u t p u t of t h e U n iv e r si ty of S alfo r d . W h e r e c o p y ri g h t p e r m i t s , f ull t e x t m a t e r i al h el d i n t h e r e p o si t o r y is m a d e f r e ely a v ail a bl e o nli n e a n d c a n b e r e a d , d o w nl o a d e d a n d c o pi e d fo r n o
n-c o m m e r n-ci al p r iv a t e s t u d y o r r e s e a r n-c h p u r p o s e s . Pl e a s e n-c h e n-c k t h e m a n u s n-c ri p t fo r a n y f u r t h e r c o p y ri g h t r e s t r i c ti o n s .
1
Submission Template for IET Research Journal Papers
Improving the Energy Efficiency for the WBSN Bottleneck Zone
based on
Random Linear Network Coding
Hisham Alshaheen1*, Haifa Takruri Rizk2
1 Computing, Science and Engineering School, University of Salford, Manchester, UK 2 Computing, Science and Engineering School, University of Salford, Manchester, UK *[email protected]
Abstract: The reduction of energy consumption and the successful delivery of data areimportant for the Wireless Body Sensor Network (WBSN). Many studies have been proposed to improve energy efficiency, but most of them have not focussedon the biosensor nodes in the WBSN bottleneck zone. Energy
consumption is a critical issue in WBSNs, as the nodes that are placed next to the sink node consume more energy. All biomedical packets are aggregated through these nodes forming a bottleneck zone. This paper proposes a novel mathematical model for body area network (BAN) topology to explain the deployment and connection between biosensor nodes, simple relay nodes, network coding relay nodes and the sink node. Therefore, this paper is dedicated to researching both the energy saving and delivery of data if there is a failure in one of the links of the transmission, which relates to the proposed Random Linear Network Coding (RLNC) model in the WBSN. Using anovel mathematical model for a WBSN, it is apparent that energy consumption is reduced and data delivery achieved with the proposed mechanism. This paper details the stages of the research work.
1. Introduction
A Wireless Body Sensor Network (WBSN) consists of several biological sensors. WBANs are used in both medical and non-medical applications. In medical application, these are designed to monitor vital signs in the human body, and WBSNs are used to show different vital signs, for instance blood glucose level, heart rate, body temperature, body posture and blood oxygen saturation. In addition, WBSNs are used to measure Electrocardiography (ECG), blood pressure, and Electroencephalography (EEG). Such sensor devices fall into two types: implantable medical devices and wearable medical devices. The former are implanted inside the human body. The latter are worn or placed on the skin or very near to the patient. The biosensor nodes sense or otherwise measure the different health signs of the body; the medical data is then transmitted to the sink node. The sink node is situated on the human body or at a nearby location [1].
There is some energy wastage in the bottleneck zone by the nodes that are placed near the sink node,
which consume more energy as they are required to forward data from nodes outside the bottleneck zone. For this reason, the proposed design of a mathematical model for the body area network attempts to explain
This paper is a postprint of a paper submitted to and accepted for publication in IET Wireless Sensor Systems and is subject to Institution of Engineering and Technology Copyright. When the final
2 the deployment and connection of nodes. Furthermore, in this paper, we consider a technique to reduce energy usage for the biosensor nodes in the WBSN bottleneck zone.
This paper contributes a novel mathematical model design for a body area network (BAN) topology which considers the connection and relationship for the biomedical sensor nodes, the simple relay nodes, the network coding relay nodes and the sink node. In this model, network coding technique is installed in a sample of the relay nodes to create the network coding relay node inside the bottleneck zone. Moreover, applying the new algorithm to the nodes in the bottleneck zone of the WBSNs will improve energy consumption of biosensor nodes and guarantees better data delivery.
The paper is organised as follows. Section 2 reviews the related work. Section 3 presents the energy consumption model. Section 4 shows path loss model for the body. Section 5 describes the body area network model design. Section 6 presents the proposed design for RLNC. Section 7 discusses wireless body sensor network performance. Finally, conclusions are drawn in Section 8.
2. Related work
The network coding (NC) concept was first introduced by Ahlswede et al. [2]. NC has become one of the popular research areas in practical networking systems. It is a technique that integrates different sets of data at relay nodes in such a way that they can be decoded at the destination. This technique can lead to better throughput of the network [2] [3]. Based on the NC concept, instead of simply forwarding the received packets, the intermediate node will combine them and create one or several output packets [3]. NC also enhances the reliability of transmission in WSN by reducing the number of lost packets [4] as it has been used for various applications [5].
Many studies used NC to achieve the enhancement of energy efficiency. In [6], Platz et al. showed that deterministic NC achieve a reduction in energy usage. However, in [7], Funde et al. proposed a mechanism to achieve the minimization of energy usage, the improvement of the throughput and packet delivery ratio based on including the duty cycle, network coding, and cluster head selection. Clearly, in the multi-hop body area sensor networks (BASNs), the authors proposed a distance-aware relaying energy efficient protocol to decrease the energy usage and prolong the network lifetime but the number of patients was only eight [8]. Movassaghi proposed a novel NC technique to improve energy usage in WBSNs[9]. In [10, 11], the authors demonstrate an improvement in the energy efficiency based on Cooperative communication techniques for WBSNs. In addition, in [12], the authors propose the cooperative MAC protocol, which is termed CooPNC (cooperative physical network coding) for short range networks. The
3 In WBAN, the researchers applied NC at the relays to increase the delivery of data, which also reduced the energy consumption [13]. In a similar way, in [14], the authors used a reduced cooperative NC to reduce the packet loss and increase the recovered data, but the nodes were fixed. Furthermore, in [15], researchers proposed the decode and forward NC technique to minimise the number of transmissions per node for WBANs while increasing energy efficiency. It was assumed the addition of the relay nodes to the network would continue until at least one relay node was in the line of sight for the biosensor nodes and relay nodes. However, the increased number of relay nodes has an impact on the mobility of the patient [16]. In [17] the authors proposed Distributed Queuing Body Area Network (DQBAN) MAC protocol depending on fuzzy-logic rules for the biomedical sensor network. DQBAN protocol utilises a novel cross-layer fuzzy fuzzy-logic, which is implemented in the biosensor node in order to reduce energy consumption, improve the required reliability, and produce a better quality of service in healthcare applications.
In [18], D’Andreagiovanni & Nardin proposed the mathematical optimization model for BAN to solve
the uncertainty traffic in the BAN by using relay nodes. The previous works improved the energy efficiency in WBSNs by adding relay nodes. However, most of the previous works did not consider the network coding relay nodes in the bottleneck zone. In this paper, we propose a technique to minimize energy usage for biosensor nodes in the WBSNs bottleneck zone. Furthermore, in the proposed technique, we use a special case of network coding family, called RLNC (Random Linear Network Coding) to encode the biomedical packets to improve the energy efficiency.
3. The Energy Consumption Model
The energy consumption for communication in the body sensor network are considered in this paper which are the transmission energy and the reception energy as (1) and (2) respectively [19].
𝐸𝑡𝑥(𝑘𝑏𝑖𝑜, 𝑑) = 𝐸𝑇𝑋𝑒𝑙𝑒𝑐𝑡 . 𝑘𝑏𝑖𝑜+ 𝐸𝑎𝑚𝑝 (𝑛). 𝑘𝑏𝑖𝑜. 𝑑𝑛 (1)
𝐸𝑟𝑥(𝑘𝑏𝑖𝑜) = 𝐸𝑅𝑋𝑒𝑙𝑒𝑐𝑡 . 𝑘𝑏𝑖𝑜 (2)
In the former formula, the 𝐸𝑡𝑥 represents the transmission energy, 𝐸𝑇𝑋𝑒𝑙𝑒𝑐𝑡 represents the dissipated
radio energy to run the circuit for transmission, 𝑘𝑏𝑖𝑜 represents the number of transmitted biomedical bits,
𝐸𝑎𝑚𝑝 represents the energy consumption for the transmitter amplifier, finally n is the path loss coefficient.
The latter formula for reception energy, 𝐸𝑟𝑥 represents the reception energy and 𝐸𝑅𝑋𝑒𝑙𝑒𝑐𝑡 represents the
dissipated radio energy of reception circuit. Total energy consumption of transmitting and receiving for the node is given as:
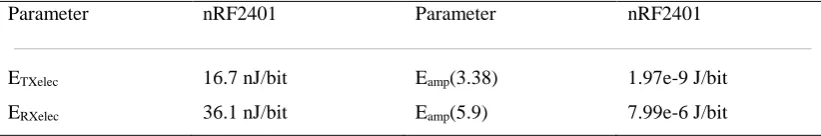
4 Nordic nRF2401 has low power consumption, it is operated in 2.4-2.45 GHz, and commonly used WSNs [19]. Table 1 shows the values of the specific parameter for Nordic nRF2401 [16].
Table 1 Shows the values of the specific parameter for Nordic nRF2401 [16]
Parameter nRF2401 Parameter nRF2401
ETXelec 16.7 nJ/bit Eamp(3.38) 1.97e-9 J/bit
ERXelec 36.1 nJ/bit Eamp(5.9) 7.99e-6 J/bit
4 . Path Loss model for the body
This model is a function of the distance between the transmitting and the receiving antenna [20].It is measured by (4).There are two types of the propagation model in the WBSN: the line of sight (LOS) and the non-line of sight (NLOS) propagation. The former applies to propagation along the front of the torso. It
was investigated in [21], however it did not consider the communication between the torso and back. The latter propagation is a higher path loss around the torso [22]. The semi-empirical formula is used for both models as follows:
𝑃𝑑𝐵 = 𝑃0,𝑑𝐵+ 10. 𝑛. log (𝑑
𝑑0) (4)
In the above formula, P0,dB represents the path loss at a reference distance d0 and n represents the path
loss exponent, it is equal to 2 in free space[14]. Table 2 demonstrates the two different propagation models
of path loss according to (4). The path loss coefficient (n) for a line of sight and non-line of sight are considered as 3.38, and 5.9 respectively [16].
Table 2 The path loss model: The values of parameters
Parameter Value LOS[21] Value NLOS[22]
d0 10 cm 10 cm
P0,dB 35.7 dB 48.8 dB
σ 6.2 dB 5.0 dB
[image:5.595.43.349.530.635.2]5
5. The Body Area Network (BAN) model design
A model of a BAN is usually represented by a directed graph G (V, A) based on graph theory[23] .There is a set of vertices V that includes one element for each wireless device (biosensor node, simple relay node, network coding relay node or sink node) of the network. The A represents a number of links (arcs). However, in [18], the authors explained the relationship between biosensor nodes, relay nodes and sink node only without network coding relay nodes. With respect to the set of vertices, the set V is the union of four disjointed sets of vertices as follows: the set B of vertices refers to biosensor nodes, the set Rr
of vertices refers to the deployment of relay nodes, the set Rnc of vertices refers to network coding relay
node, and the set S of vertices refers to sink nodes (assumption the number of sink node in this model is
one).
𝑉 = 𝐵𝑏∪ 𝑅𝑟∪ 𝑅𝑛𝑐∪ 𝑆 (7)
Each node is a device situated within a range depending upon the power of the transmitting device. Each biosensor generates the data which is routed from a source node b to a destination node s (sink node) in the network is represented by the graph G (V, A). Moreover, the capacity of relay node in a WBSN is
(0 < 𝑐𝑎𝑝𝑟 ≤ 250 kbps) for each relay 𝑟 ∈ 𝑅. The transmission link from the bio-medical sensor node to the
sink node through a simple relay node and a network code relay node can be expressed as
𝐴 = 𝐴𝐵→𝑆∪ 𝐴𝐵→𝑅𝑟∪ 𝐴𝐵→𝑅𝑛𝑐∪ 𝐴𝑅𝑟↔𝑅𝑟∪ 𝐴𝑅𝑟→𝑆∪ 𝐴𝑅𝑟→𝑅𝑛𝑐∪ 𝐴𝑅𝑛𝑐→𝑆 (8)
5.1 Energy consumption assumptions of the designed model
The following are the connectivity parameters for WBAN of the designed model representing the relationship between biosensor nodes, simple relay nodes, network coding relay nodes and the sink node.
If the biosensor node b can establish a link with the simple relay node r, it can be expressed as
𝑎𝑖𝑗𝑏𝑟 = {1 𝑎 𝑙𝑖𝑛𝑘 𝑜𝑛 𝑎𝑟𝑐(𝑖, 𝑗) ∈ 𝐴𝐵→𝑅𝑟
0 𝑂𝑡ℎ𝑒𝑟𝑤𝑖𝑠𝑒 (9)
Sometimes, in WBSN topology, the biosensor node is connected to more than the simple relay node.
In this case 𝑎𝑖𝑗𝑏𝑟= ℎ𝑟 where hr is the number of relay nodes that receive the packets from biosensor b.
If the biosensor node b can establish a link with the NC node, it is represented as
𝑎𝑖𝑗𝑏𝑛𝑐 = {1 Link on 𝑎𝑟𝑐 (𝑖, 𝑗) ∈ 𝐴𝐵→𝑅𝑛𝑐
0 Otherwise (10)
If the biosensor node b can establish a link with the sink node, it follows as
𝑎𝑖𝑗𝑏𝑠 = {1 𝑎 𝑙𝑖𝑛𝑘 𝑜𝑛 a𝑟𝑐 (𝑖, 𝑗) ∈ 𝐴𝐵→𝑆
6 If the simple relay node r can establish a link with the sink node s, it can be expressed as
𝑒𝑖𝑗𝑟𝑠 = {1 𝑙𝑖𝑛𝑘 𝑜𝑛 𝑎𝑟𝑐 (𝑖, 𝑗) ∈ 𝐴𝑅𝑟→𝑆
0 𝑜𝑡ℎ𝑒𝑟𝑤𝑖𝑠𝑒 (12)
If the simple relay node r can establish a link with the NC node, it is represented as
𝑒𝑖𝑗𝑟𝑛𝑐 = {1 𝑙𝑖𝑛𝑘 𝑜𝑛 𝑎𝑟𝑐(𝑖, 𝑗) ∈ 𝐴𝑅𝑟→𝑅𝑛𝑐
0 𝑂𝑡ℎ𝑒𝑟𝑤𝑖𝑠𝑒 (13)
If the simple relay node r can establish a link with another simple relay node l, it can be represented as
𝑒𝑖𝑗𝑟𝑙 = {1 𝑙𝑖𝑛𝑘 𝑜𝑛 𝑎𝑟𝑐 𝑎𝑟𝑐 (𝑖, 𝑗) ∈ 𝐴𝑅𝑟→𝑅𝑟
0 𝑂𝑡ℎ𝑒𝑟𝑤𝑖𝑠𝑒 (14)
If the NC relay node can establish a link with the sink node s, it is expressed as
𝑒𝑖𝑗𝑛𝑐𝑠 = {1 𝑙𝑖𝑛𝑘 𝑜𝑛 𝑎𝑟𝑐 (𝑖, 𝑗) ∈ 𝐴𝑅𝑛𝑐→𝑆
0 𝑂𝑡ℎ𝑒𝑟𝑤𝑖𝑠𝑒 (15)
There are two binary decision variables: the former relates to the data generated from the biosensor node while the latter is a decision variable of the installation of the network coding technique in the simple
relay node to create the NC relay node in the network [24]. Binary generated data variable is 𝑥𝑖𝑗𝑏𝑠 ∈
{0,1}∀𝑏 ∈ 𝐵, 𝑠 ∈ 𝑆, (𝑖, 𝑗) ∈ 𝐴 , and the biosensor node generated data transmitted to the sink nodecan be
expressed as
𝑥𝑖𝑗𝑏𝑠 = {1 𝑙𝑖𝑛𝑘 𝑜𝑛 arc (𝑖, 𝑗) ∈ 𝐴
0 𝑂𝑡ℎ𝑒𝑟𝑤𝑖𝑠𝑒 (16)
The binary NC relay node deployment variable 𝑧𝑛𝑐 ∈ {0,1}∀𝑛𝑐 ∈ 𝑅𝑛𝑐 is represented as
𝑧𝑛𝑐= {1 𝑖𝑓 𝑖𝑛𝑠𝑡𝑎𝑙𝑙 𝑁𝐶 𝑖𝑛 𝑟𝑒𝑙𝑎𝑦 𝑛𝑜𝑑𝑒 0 𝑜𝑡ℎ𝑒𝑟𝑤𝑖𝑠𝑒 (17)
The total transmission and reception energy for all wireless nodes in the WBSNs represents the total energy consumption. The calculation of the total energy consumption to transmit medical data from all biosensor nodes to the relay nodes is given as
𝐸𝑇𝑋𝑏𝑟𝑡 = ∑ 𝑘 𝑏𝑖𝑜 𝑏𝑠 𝑥
𝑖𝑗𝑏𝑠𝑎𝑖𝑗𝑏𝑟(𝐸𝑇𝑋𝑒𝑙𝑒𝑐+ 𝐸𝑎𝑚𝑝(𝑛𝑏𝑟)) 𝑏∈𝐵,𝑟∈𝑅,𝑠∈𝑆
𝐷𝑏𝑟𝑛𝑏𝑟
(18)
The simple relay nodes receive the medical data from the biosensor nodes. The total energy consumption for reception is computed by (19).
𝐸𝑅𝑋𝑏𝑟𝑡 = ∑ 𝑘
𝑏𝑖𝑜𝑏𝑠𝑥𝑖𝑗𝑏𝑠𝑎𝑖𝑗𝑏𝑟𝐸𝑅𝑋𝑒𝑙𝑒𝑐 𝑏∈𝐵,𝑟∈𝑅,𝑠∈𝑆
7 Table 4 details all terms used in this model. The simple relay nodes consume energy to forward the medical packets to another relay node 𝑙 as follows
𝐸𝑇𝑋𝑟𝑙𝑡 = ∑ 𝑓
𝑟𝑙𝑠(𝐸𝑇𝑋𝑒𝑙𝑒𝑐+ 𝐸𝑎𝑚𝑝(𝑛𝑟𝑙)) 𝑟,𝑙∈𝑅,𝑠∈𝑆
𝐷𝑟𝑙𝑛𝑟𝑙+ 𝐸
𝑅𝑋𝑒𝑙𝑒𝑐 (1)
The total energy consumption to relay medical data from simple relay nodes to the sink node is given as
𝐸𝑇𝑋𝑟𝑠𝑡 = ∑ 𝑓
𝑟𝑠𝑠 (𝐸𝑇𝑋𝑒𝑙𝑒𝑐+ 𝐸𝑎𝑚𝑝(𝑛𝑟𝑠)) 𝑟∈𝑅,𝑠∈𝑆
𝐷𝑟𝑠𝑛𝑟𝑠 + 𝐸
𝑅𝑋𝑒𝑙𝑒𝑐 (21)
5.2 Energy consumption with Network Coding
With respect to the connection between network coding relay nodes and bio-medical sensor nodes with simple relay nodes. The calculation of the total energy consumption to transmit medical data from all biosensor nodes to the network coding relay nodes is given as
𝐸𝑇𝑋𝑏𝑛𝑐𝑡 = ∑ 𝑘
𝑏𝑖𝑜𝑏𝑠 𝑥𝑖𝑗𝑏𝑠𝑎𝑖𝑗𝑏𝑛𝑐(𝐸𝑇𝑋𝑒𝑙𝑒𝑐+ 𝐸𝑎𝑚𝑝(𝑛𝑏𝑛𝑐)) 𝑏∈𝐵,𝑛𝑐∈𝑁𝐶,𝑠∈𝑆
𝐷𝑏𝑛𝑐𝑛𝑏𝑛𝑐
(22)
The NC relay nodes receive the medical data from the biosensor nodes. The total energy consumption for reception is computed by (23).
𝐸𝑅𝑋𝑏𝑛𝑐𝑡 = ∑ 𝑘
𝑏𝑖𝑜𝑏𝑠 𝑥𝑖𝑗𝑏𝑠𝑎𝑖𝑗𝑏𝑛𝑐𝐸𝑅𝑋𝑒𝑙𝑒𝑐 𝑏∈𝐵,𝑛𝑐∈𝑁𝐶,𝑠∈𝑆
(23)
The simple relay nodes consume energy to forward the medical packets to the network coding relay nodes which can be expressed as
𝐸𝑇𝑋𝑟𝑛𝑐𝑡 = ∑ 𝑓
𝑟𝑛𝑐𝑠 (𝐸𝑇𝑋𝑒𝑙𝑒𝑐+ 𝐸𝑎𝑚𝑝(𝑛𝑟𝑛𝑐)) 𝑟∈𝑅,𝑛𝑐∈𝑁𝐶,𝑠∈𝑆
𝐷𝑟𝑛𝑐𝑛𝑟𝑛𝑐 + 𝐸
𝑅𝑋𝑒𝑙𝑒𝑐 (24)
The total energy consumption to relay medical data from the NC relay nodes to the sink node is given by (25)
𝐸𝑇𝑋𝑛𝑐𝑠𝑡 = ∑ 𝑓
𝑛𝑐𝑠𝑠 (𝐸𝑇𝑋𝑒𝑙𝑒𝑐+ 𝐸𝑎𝑚𝑝(𝑛𝑛𝑐𝑠)) 𝑛𝑐∈𝑁𝐶,𝑠∈𝑆
𝐷𝑛𝑐𝑠𝑛𝑛𝑐𝑠 + 𝐸
𝑅𝑋𝑒𝑙𝑒𝑐 (25)
8
[image:9.595.138.491.551.708.2]
Table 3 Explanation of all terms uses in the model for WBSN
term Description
𝑓𝑏𝑠 The traffic generated by the biosensor nodes b towards the sink node S
𝐷𝑏𝑟𝑛𝑏𝑟 The distance between the biosensor nodes and the simple relay nodes
𝑓𝑟𝑙𝑠 The total traffic transmitted by the simple relay node to neighbouring node (another relay node).
𝐷𝑟𝑙𝑛𝑟𝑙 The distance between the simple relay nodes and the neighbouring node (another relay node).
𝑓𝑟𝑠𝑠 Traffic from the simple relay node to the sink node
𝐷𝑟𝑠𝑛𝑟𝑠 The distance between the simple relay nodes and the sink node.
𝐷𝑏𝑛𝑐𝑛𝑏𝑛𝑐 The distance between the biosensor nodes and the NC relay nodes
𝑓𝑟𝑛𝑐𝑠 The total traffic transmitted by the simple relay node to the NC relay node toward the sink node
𝐷𝑟𝑛𝑐𝑛𝑟𝑛𝑐 The distance between the simple relay nodes and the NC relay node.
𝑓𝑛𝑐𝑟𝑠 The total traffic received from the NC relay node to the simple relay node toward the sink node.
𝐷𝑛𝑐𝑠𝑛𝑛𝑐𝑠 The distance between the NC relay nodes and the sink node.
The calculation of the traffic flow in WBSNs is as follows: Let 𝑘𝑏𝑖𝑜𝑏𝑠 represent the number of transmitted biomedical bits through WBSN and received by the simple relay node, NC relay node and sink node. The total traffic generated by the biosensor node toward the sink node is given below (26).
∑ 𝑘𝑏𝑖𝑜𝑏𝑠 𝑏∈𝐵
𝑥𝑖𝑗𝑏𝑠𝑎𝑖𝑗𝑏𝑟 ∀𝑟, 𝑙 ∈ 𝑅, 𝑠 ∈ 𝑆 (26)
Therefore, all traffic is destined towards the sink node S as given below
∑ 𝑘𝑏𝑖𝑜𝑏𝑠 𝑏∈𝐵
𝑥𝑖𝑗𝑏𝑠𝑎 𝑖𝑗
𝑏𝑟+ ∑(𝑓
𝑙𝑟𝑠 − 𝑓𝑟𝑙𝑠) 𝑙∈𝑅
− 𝑓𝑟𝑠𝑡 = 0 ∀𝑟 ∈ 𝑅, 𝑠 ∈ 𝑆
(27)
Where the term ∑𝑏∈𝐵𝑘𝑏𝑖𝑜𝑏𝑠 𝑥𝑖𝑗𝑏𝑠 𝑎𝑖𝑗𝑏𝑟represent the total generated traffic by the biosensor nodes towards
the sink node S. The term ∑𝑙∈𝑅𝑓𝑙𝑟𝑠 represents the total traffic received by the simple relay node from
neighbouring nodes, ∑𝑙∈𝑅𝑓𝑟𝑙𝑠 is the total traffic transmitted by the simple relay node to neighbouring nodes
and ∑𝑙∈𝑅𝑓𝑟𝑠𝑡 is the transmission of traffic towards the sink node s, those are expressed as
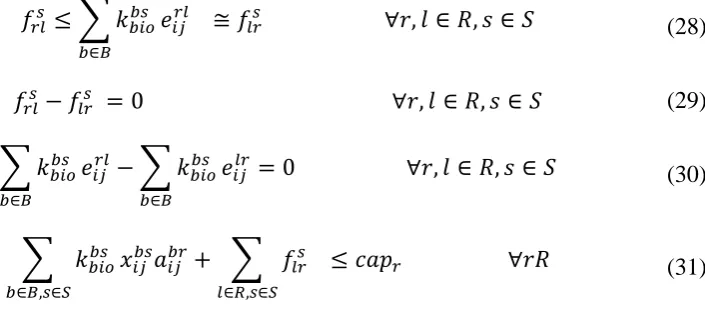
𝑓𝑟𝑙𝑠 ≤ ∑ 𝑘𝑏𝑖𝑜𝑏𝑠 𝑏∈𝐵
𝑒𝑖𝑗𝑟𝑙 ≅ 𝑓𝑙𝑟𝑠 ∀𝑟, 𝑙 ∈ 𝑅, 𝑠 ∈ 𝑆 (28)
𝑓𝑟𝑙𝑠 − 𝑓
𝑙𝑟𝑠 = 0 ∀𝑟, 𝑙 ∈ 𝑅, 𝑠 ∈ 𝑆 (29)
∑ 𝑘𝑏𝑖𝑜𝑏𝑠 𝑏∈𝐵
𝑒𝑖𝑗𝑟𝑙− ∑ 𝑘𝑏𝑖𝑜𝑏𝑠 𝑏∈𝐵
𝑒𝑖𝑗𝑙𝑟 = 0 ∀𝑟, 𝑙 ∈ 𝑅, 𝑠 ∈ 𝑆 (30)
∑ 𝑘𝑏𝑖𝑜𝑏𝑠 𝑏∈𝐵,𝑠∈𝑆
𝑥𝑖𝑗𝑏𝑠𝑎𝑖𝑗𝑏𝑟+ ∑ 𝑓𝑙𝑟𝑠 𝑙∈𝑅,𝑠∈𝑆
9 Where 𝑐𝑎𝑝𝑟 represents the capacity of the relay node in WBSN. The traffic must not exceed the
capacity of the node. The total traffic transmitted towards the sink node s as shown in (32) which represents the original flow (native data) in BAN.
𝑓𝑟𝑠𝑡 ≤ ∑ 𝑘 𝑏𝑖𝑜𝑏𝑠 𝑏∈𝑆
𝑒𝑖𝑗𝑟𝑠 = 𝑓
𝑛𝑎𝑡𝑖𝑣𝑒_𝑟𝑠𝑠 ∀ 𝑟 ∈ 𝑅, 𝑠 ∈ 𝑆 (32)
Where the value
𝑒𝑖𝑗𝑟𝑠 = 1 ∀ 𝑟 ∈ 𝑅, 𝑠 ∈ 𝑆
(33)
Meaning that, there is a connection between the simple relay node and the sink node. The traffic is expressed as
𝑓𝑟𝑠𝑡 = 𝑘
𝑏𝑖𝑜𝑏𝑠 ∀ 𝑟 ∈ 𝑅, 𝑠 ∈ 𝑆 (34)
On the other hand, the total traffic flow received in the NC nodes is transmitted from the biosensor nodes and the simple relay nodes. After that, NC relay node encodes the received biomedical data and directly sends to the sink node S. The total traffic in the NC relay node is given as
∑ 𝑘𝑏𝑖𝑜𝑏𝑠 𝑥𝑖𝑗𝑏𝑠 𝑏∈𝐵
𝑎𝑖𝑗𝑏𝑛𝑐𝑧𝑛𝑐+ ∑ 𝑓𝑟𝑛𝑐𝑠 𝑙∈𝑅
∀𝑟, ∈ 𝑅, 𝑛𝑐 ∈ 𝑁𝐶, 𝑠 ∈ 𝑆 (35)
𝑤ℎ𝑒𝑟𝑒 𝑓𝑛𝑐𝑟𝑠 ≤ ∑ 𝑘𝑏𝑖𝑜𝑏𝑠 𝑏∈𝐵
𝑒𝑖𝑗𝑟𝑛𝑐𝑧𝑛𝑐 ∀𝑟, ∈ 𝑅, 𝑛𝑐 ∈ 𝑁𝐶, 𝑠 ∈ 𝑆 (36)
Where the terms 𝑎𝑖𝑗𝑏𝑛𝑐 , 𝑥𝑖𝑗𝑏𝑠, 𝑧𝑛𝑐and 𝑒𝑖𝑗𝑟𝑛𝑐 are equal to 1, NC relay node receives 𝑘𝑏𝑖𝑜𝑏𝑠 from a
bio-sensor node and receives 𝑘𝑏𝑖𝑜𝑏𝑠 from a simple relay node. Where 𝐷𝑑𝑎𝑡𝑎_𝑛𝑐 represents the total traffic which
is received, it can be expressed as
𝐺𝑖 ≤ ∑ 𝑘𝑏𝑖𝑜𝑏𝑠 𝑏∈𝐵
𝑓𝑟𝑜𝑚 𝑏𝑖𝑜𝑠𝑒𝑛𝑠𝑜𝑟 𝑛𝑜𝑑𝑒 + ∑ 𝑘𝑏𝑖𝑜𝑏𝑠 𝑏∈𝐵
𝑓𝑟𝑜𝑚 𝑟𝑒𝑙𝑎𝑦 𝑛𝑜𝑑𝑒 (37)
To encode biomedical packets, the NC relay node is chosen as a sequence coefficient q= (q1, q2,….., qn) from Galois Field GF(2s), this is called an encoding vector. The single output encoded packet is calculated as the sum of products of each of the n native packets that are received at a node 𝐺𝑖 (i=1, 2, 3, 4, …n) with a random coefficient qi. The output encoded packet is described below as
𝑌 = ∑ 𝑞𝑖 𝑛
𝑖=1
𝐺𝑖 𝑞𝑖 ∈ 𝐺𝐹(2𝑠) (38)
The ingress flow to the sink node S from NC relay node is expressed as
10
Where 𝐷𝑠𝑒𝑛𝑑𝑖𝑛𝑔_𝑓𝑟𝑜𝑚_𝑁𝐶 represents the traffic in the sink node which is received from NC relay node
and 𝑞𝑖 represents the random coefficient based on Galois Field.
Decoding in the sink node: The sink node receives data from both the simple relay node and the NC
relay node which represents the native data and encoding data respectively. With respect to Gaussian elimination, the sink node decodes the received packets to recover the native packets [25] as follows
𝐷𝑛𝑎𝑡𝑖𝑣𝑒_𝑃𝐾𝑇 = ∑ 𝑞𝑖 𝑛
𝑖=1
𝐷𝑒𝑛𝑐𝑜𝑑𝑖𝑛𝑔_𝑛𝑐_𝑖 𝑞𝑖 ∈ 𝐺𝐹(2𝑠) (40)
The total energy consumption in the time t (for instance the duration is [0,t]) for the network is defined as:
𝐸𝑤ℎ𝑜𝑙𝑒_𝑛𝑒𝑡𝑤𝑜𝑟𝑘𝑡𝑜𝑡𝑎𝑙 = {𝑡[(𝐸
𝑇𝑋𝑏𝑟𝑡 + 𝐸𝑅𝑋𝑏𝑟𝑡 + 𝐸𝑇𝑋𝑟𝑙𝑡 + 𝐸𝑇𝑋𝑟𝑠𝑡 + 𝐸𝑇𝑋𝑏𝑛𝑐𝑡 + 𝐸𝑅𝑋𝑏𝑛𝑐𝑡 + 𝐸𝑇𝑋𝑟𝑛𝑐𝑡
+ 𝐸𝑇𝑋𝑛𝑐𝑠𝑡 )]} (41)
6. The proposed design for RLNC
11
Fig. 1. The proposed design model in the WBSN [24]
Each biosensor node transmits duplicate biomedical packets, one to the simple relay node and the other to the NC relay node. The processing of packets at the node site (simple relay node and NC relay node) has been given in Fig. 2, showing the algorithm which implements the forwarding of the medical packets and the encoding algorithm at the simple relay node and the NC relay node respectively. Each node in the bottleneck zone receives a queue (RQueue) into which received packets are placed, and the node checks the packet to see whether or not the packet is a native.
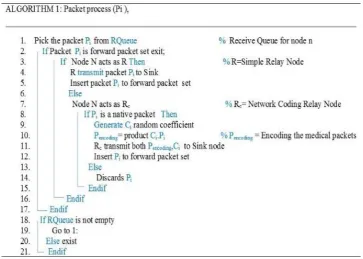
6.1 Algorithm for packets processing
As far as the algorithm for the processing of packets is concerned, as shown in Fig. 2, each node has a receive queue (RQueue), which includes biomedical packets, and the node deposits biomedical packets in the queue (RQueue). In the first section of the algorithm, if the node acts as a simple relay node, it checks the packet which is received. If it is already forwarded toward the sink node then it should be removed from the queue and inserted into the forward packet set; otherwise, the simple relay node transmits the packet toward the sink node.
In the second section of the algorithm, as shown in Fig. 2, if the node represents NC relay node and the biomedical packet is a native packet, the NC relay node is chosen as a sequence coefficient based on the
12
6.2 Algorithm for packets decoding
[image:13.595.130.494.250.509.2]The decoding procedure for biomedical packets at the sink node is as follows: the sink node receives the native packets and encoded packets from the simple relay node and the NC relay node, respectively. The decoding procedure is shown in Fig. 3 where the sink node receives the native packets from the simple relay node. Additionally, it receives the encoded packets with random coefficient from the NC relay node and performs the decoding procedure for the encoded packets. The sink node applies Gaussian elimination on the encoded packets and coefficient in order to retrieve all source packets.
Fig. 2. The algorithm for the processing of packets
[image:13.595.125.500.558.687.2]13
7. Wireless body sensor network performance
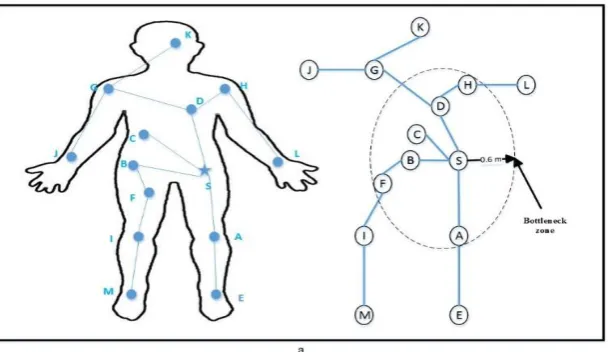
[image:14.595.161.466.388.564.2]In this scenario the WBSN topology is used as depicted in Fig.4a because it represents a general case. The WBSN scenario includes 13 biosensor nodes which are placed on the human body, for instance electroencephalogram (K sensor) and electrocardiogram (D sensor). With respect to this scenario, there are some biosensor nodes which sense and measure vital signs of the human body such as Pulse rate, Temperature, Motion sensor, and Blood pressure. The definition of the bottleneck zone is an area within radius (0.6 m) from the sink node, where the radius represents the transmission range of the sensor nodes. The distance between the biosensor nodes and sink node for the single-hop technique, and between biosensor nodes and closest node in the multi-hop technique is shown in Table 5. The WBSN is shown on the left hand side of Fig. 4a and the topology explains the bottleneck zone which is shown on the right-hand side of the figure. With respect to the network coding approach, there are simple relay nodes and network coding relay nodes added in the bottleneck to reduce the energy consumption for the biosensor nodes as shown in Fig.
14
Fig. 4. WBSN topology and explain the bottleneck zone
a WBSN topology with 13 biosensor node and explain the area of the bottleneck zone
b Tree topology for WBSN with simple relay nodes(R) and network coding relay nodes (NC) added in the bottleneck zone.
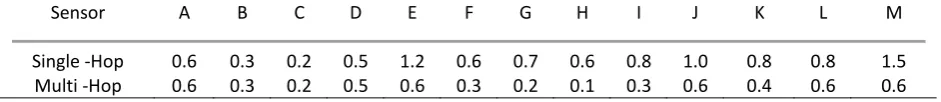
Table 4 The distance (meters) between biosensor node and sink node for the single hop, and between the biosensor and the nearest node for the multi-hop [2]
Sensor A B C D E F G H I J K L M
Single -Hop 0.6 0.3 0.2 0.5 1.2 0.6 0.7 0.6 0.8 1.0 0.8 0.8 1.5 Multi -Hop 0.6 0.3 0.2 0.5 0.6 0.3 0.2 0.1 0.3 0.6 0.4 0.6 0.6
7.1 The LOS and NLOS Performance
In WBSNs, the energy consumption is affected by propagation path loss. The single hop approach utilises the line of sight (LOS) propagation model in all transmissions, and uses the path loss coefficient (n) of LOS, which equals 3.38. However, in the multi hop approach, the NLOS value is utilised for the transmission in WBSN. In addition, the path loss coefficient (n) of NLOS is equal to 5.9. The path loss coefficient along LOS channel is lower than along NLOS channel, which affects the energy usage in WBSN. On the other hand, all transmissions in the relay network approach use the path loss coefficient (n) of NLOS, which is equal to 5.9, except for the nodes that are placed next to sink node, those utilise the path loss coefficient (n) of LOS, which equals 3.38. Similarly, in the network coding approach, for instance, the biosensor nodes B and C are directly connected to the sink node, which use the LOS. However, the biosensor nodes such as A, F, D, and H connect with the sink node through the simple relay node and the NC relay node, which uses the NLOS where the path loss coefficient of the LOS and NLOS are equal to 3.38 and 5.9, respectively. In all approaches, the energy usage for the transmit amplifier in equation (1) equals to 1.97e-9
[image:15.595.63.534.317.368.2]15 Each biosensor node consumes energy based on the propagation model and the distance between the sensor node and the sink node. For example, EMG (A) and the ECG (node D) consume more energy that sensor B as they send biomedical packets toward the sink node through a simple relay node and a NC relay node, whereas the body temperature sensor (B) is transmitted directly from the biomedical packets to the sink node.
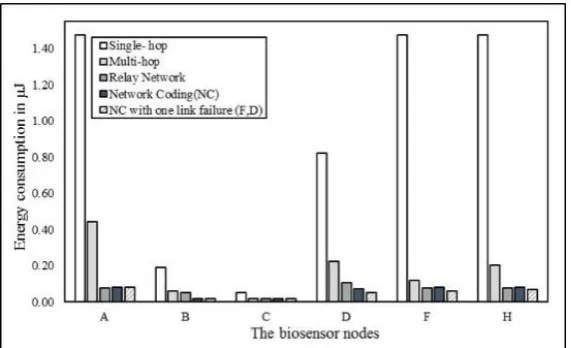
7.2 Energy consumption results
The energy consumption for the WBSN bottleneck zone is computed based on the network coding approach comparing single hop [26], multi- hop [26], and relay network approaches.
In the single-hop approach, the biosensor nodes in the bottleneck zone consume more energy based on the distance when compared with other approaches; the biosensor nodes A, F, and H show greater energy consumption, as shown in Fig. 5. However, in the multi-hop approach, the biosensor nodes relay the packets via the intermediate node towards the sink node. The nodes A, and D have higher energy consumption in the multi-hop but the node C has the same value of energy in most approaches because it is connected only with the sink node, as illustrated in Fig. 5.
With respect to the relay network approach, adding to the number of relay nodes which forward the packets to the sink node improves the energy efficiency and decreases the energy usage of biosensor nodes in the bottleneck zone. Moreover, there is at least one possible relay node in line of sight. The energy consumption for all biosensor nodes is lower compared with single-hop and multi-hop approach.
In the network coding approach, simple relay nodes and NC relay nodes are added to the bottleneck zone to reduce the energy consumption for the biosensor nodes in this area. It can be observed that energy usage for the nodes B and D is lower when compared with other approaches except that the values of energy consumption for A, F and H are slightly higher than in the relay network approach because energy consumption of these nodes are calculated based on non-line of sight as illustrated in Fig. 5. Detailed results
16
Fig. 5. Comparison of energy consumption for biosensor nodes in the bottleneck zone based on the single hop, multi-hop, relay
network and Network coding.
Table 5 The energy consumption for the nodes in the all approaches
Node Energy usage in Single Hop (μJ/bit)
Energy usage in Multi Hop (μJ/bit)
Energy usage in Relay network (μJ/bit)
Energy usage in Network Coding (μJ/bit)
A 1.47414 0.44512 0.07610 0.08263
B 0.18933 0.05937 0.05283 0.01671
C 0.05138 0.01671 0.01671 0.07070
D 0.82028 0.22270 0.10623 0.08264
F 1.47414 0.11874 0.07610 0.08264
H 1.47414 0.20331 0.07610 0.08264
Moreover, each biosensor node sends duplicated packets, one through simple relay node and the
second through NC relay node. In the transmission range of 0.3 cm, the NC relay node receives packets from different nodes and encoded packets are then sent to the sink node. The sink node decodes the received packets and retrieves native packets even if there is a failure in one of the transmission links.
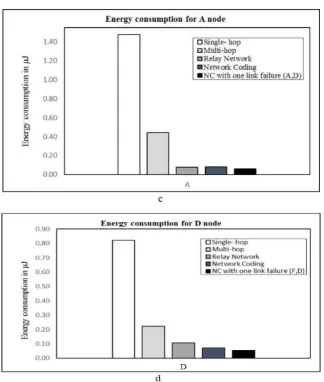
[image:17.595.44.542.319.430.2]17 The bar chart shown in Fig. 6c compares the energy consumption for node A, calculated based on the single hop (1.4741 µJ/bit), multi- hop (0.4451 µJ/bit), relay network (0.0761 µJ/bit), NC (0.0826 µJ/bit,) and NC with one link failure (0.0593 µJ/bit). We can see significant differences in the energy consumption value for node A in the single hop and the NC with one link failure. The energy usage for node A is higher in the single hop. Moreover, the energy consumption for node A in the relay network scheme is slightly higher than the NC with one link failure. On the other hand, the amount of energy is lower in the later scheme.
18
Fig. 6. Case 1: the energy consumption for the all nodes in bottleneck zone with energy consumption for the nodes A and D
a Tree topology for WBSN with a failure link for the node A and D.
b Comparison of energy consumption for biosensor nodes for all approaches and NC with a failure link in A and D nodes. c Comparison energy consumption for node A in all approaches.
d Comparison energy consumption for node D in all approaches.
In the second case, if there is a failure of links for nodes F and H, as shown in Fig. 7a, the energy consumption is calculated for biosensor nodes in the bottleneck zone based on the single hop, multi-hop, relay network, network coding, and NC with a link failure in F and H nodes, which are compared in Fig. 7b. The energy usage for node F is calculated depending on the single hop, multi- hop, relay network, NC, and NC with one link failure, which are equal to 1.4741µJ/bit, 0.1187µJ/bit, 0.0761µJ/bit, 0.0826 µJ/bit and 0.0593 µJ/bit, respectively. Moreover, the energy consumption for node H based on the single hop, multi-
19 7d respectively. Fig. 7c and Fig. 7d also show that, the energy consumption for nodes F and H using NC with a link failure are lower than for other approaches.
20
Fig. 7. Case 2: the energy consumption for the all nodes in bottleneck zone with energy consumption for the nodes H and F.
a Tree topology for WBSN with a failure link for the node H and F.
b Comparison of energy consumption for biosensor nodes for all approaches and NC with a failure link in F and H nodes. c Comparison energy consumption for node F in all approaches.
d Comparison energy consumption for node H in all approaches.
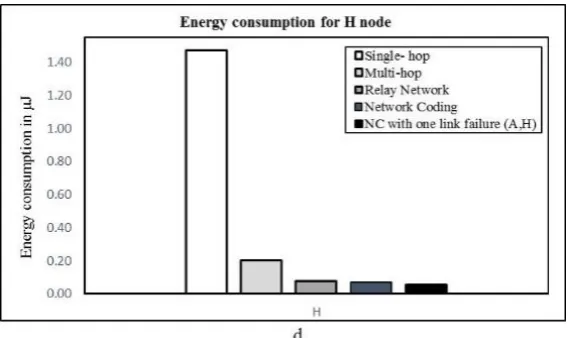
Also, in the other cases, the comparisons of the energy consumption for biosensor nodes in the bottleneck zone are shown in Fig. 8a and Fig. 8b for all approaches and NC with link failure in the nodes A and H, and nodes F and D, respectively. The energy usage for nodes A and H are equal to 0.0593 µJ/bit and
0.0528 µJ/bit, respectively in NC with link failure in nodes A and H. In addition, nodes F and D energy consumption equals to 0.05939 µJ/bit and 0.0534 µJ/bit respectively based on NC with link failure in nodes
F and D.
21
Fig. 8. Energy consumption and saving in the bottleneck zone
a Comparison of energy consumption for biosensor nodes for all approaches and NC with a failure link in A and H nodes. b Comparison of energy consumption for biosensor nodes for all approaches and NC with a failure link in F and D nodes. c Energy saving for biosensor nodes based on the difference between network coding and single hop, multi-hop and relay network.
8. Conclusions
22 wireless body networks. Moreover, energy saving for biosensor nodes in the bottleneck zone is achieved through applying the RLNC scheme.
9. References
[1] Iftikhar M., Al Elaiwi N., and Aksoy M. S., .: 'Performance Analysis of Priority Queuing Model for Low Power Wireless Body Area Networks (WBANs), ' Procedia Comput. Sci., 2014,34, pp. 518–525.
[2] Ahlswede, R., Cai, N., Li, S.-Y. R., et al.: 'Network Information Flow, ' IEEE Trans. Inf. Theory, 2000, 46, (4), pp 1204–1216.
[3] Li, S. Y. R., Yeung, R. W., and Cai, N., .: 'Linear network coding, ' IEEE Trans. Inf. Theory, 2003, 49, (2), pp 371–381.
[4] Shahidan A. A., Fisal N., Ismail N. N., et al.: ' Data Recovery in Wireless Sensor Networks using Network Coding', Jurnal Teknologi,2015,73,(3), pp 69–73.
[5] Magli, E., Wang, M., Frossard, P., et al.:' Network coding meets multimedia: A review', IEEE Trans. Multimed., 2013, 15, (5), pp 1195–1212.
[6] Platz, D. , Woldegebreal, D. H. ,and Karl, H.:' Random Network Coding in Wireless Sensor Networks: Energy Efficiency via Cross-Layer Approach,' 2008 IEEE 10th Int. Symp. Spread Spectr. Tech. Appl., Italy, Augest 2008,pp. 654–660.
[7] Funde, M. V., Gaikwad, M. A., and Hinganikar, P. A. W. .:'Review of Lifetime Enhancement of Wireless Sensor Networks,' IORD Journal of Science & Technology, 2015, 2, (2), pp 35–39.
[8] Tauqir,A., Javaid,N., Akram, S., et al.:' Distance aware relaying energy-efficient: DARE to monitor patients in multi-hop body area sensor networks,' Proc. 2013 8th Int. Conf. Broadband, Wirel. Comput. Commun. Appl. BWCCA 2013, France, October 2013,pp. 206–213.
[9] Movassaghi,S., Shirvanimoghaddam,M., and Abolhasan, M.: 'A Cooperative Network Coding Approach to Reliable Wireless Body Area Networks with Demodulate-and-Forward,' Proc. 2013 9th Int. Wirel. Commun. Mob. Comput. Conf. IWCMC2013,Italy,July 2013, pp. 394–399.
[10] Deepak, K.S. and Babu, A.V.:' Improving energy efficiency of incremental relay based cooperative communications in wireless body area networks', International Journal of Communication Systems, 2015, 28, (1), pp.91-111.
[11] Yousaf, S., Javaid, N., Qasim, U., et al.:' Towards Reliable and Energy-Efficient IncrementalCooperative Communication for Wireless Body Area Networks', 2016, 16, (3), pp. 284
[12] Miliotis, V, Alonso, L., and Verikoukis, C.: ' CooPNC: A cooperative multicast protocol exploiting physical layer network coding', Ad hoc networks, 2014, 14, pp. 35-50
[13]Dharshini,P.,M.,P., and Tamilarasi, M., .:'Adaptive Reliable Cooperative Data Transmission Technique for Wireless Body Area Network,' Proc. Int. Confe. Informa. Commun. Embedd. Syste. ICICES2014, India,Februry 2014, pp. 4–7.
[14] Arrobo, G., E., and Gitlin, R., D.: ' Improving the reliability of wireless body area networks,' 2011 33Annu. Int. Conf. IEEE Eng. Med. Biol. Soc.,USA ,30 Augest-1 Septmber 2011,pp. 2192–2195.
[15] Movassaghi,S., Shirvanimoghaddam,M., Abolhasan,M., et al.:'An energy efficient network coding approach for Wireless Body Area Networks,' 38th Annu. IEEE Conf. Local Comput. Networks, Australia, October 2013,pp. 468– 475.
[16] Ehyaie,A., Hashemi,M., and Khadivi,P.:' Using relay network to increase life time in wireless body area sensor networks,' IEEE Int. Symp. a World Wirel., Mobil., Multimed. Networks Work, June 2009, pp. 1–6.
[17] Begonya, O., Alonso, L., and Verikoukis C.: 'Highly reliable energy-saving MAC for wireless body sensor networks in healthcare systems', IEEE Journal on Selected Areas in Communications,2009, 27,(4),pp. 553-565 [18] D’Andreagiovanni,F., and Nardin,A.:'Towards the fast and robust optimal design of wireless body area networks,' Appl. Soft Comput., 2015,37, pp 971–982.
[19] Braem, B.,Latré, B.,Moerman, I., et al.:' The need for cooperation and relaying in short-range high path loss sensor networks,' Proc. 2007 Int. Conf. Sens. Technol. Appl. SENSORCOMM 2007, Spain,October 2007, pp. 566– 571.
23
[21] Reusens, E., Joseph,W., Vermeeren, G., et al.:' “On-Body Measurements and Characterization of Wireless Communication Channel for Arm and Torso of Human,” Proc. 4th Int. Work. Wearable Implant. Body Sens. Networks, Germany, March 2007, pp. 264–269.
[22] Fort,A., Ryckaert,J., Desset,C., et al.:' Ultra-wideband channel model for communication around the human body,” IEEE J. Sel. Areas Commun.,2006,24, (4), pp. 927–933.
[23] Bondy,J.A., and Murtty,U.S.R.: 'Graph theory with applications'(Macmillan Press Ltd,1976).
[24] Alshaheen,H., and Takruri Rizk,H.:'Improving the Energy Efficiency for Biosensor Nodes in the WBSN Bottleneck Zone Based on a Random Linear Network Coding,' Proc. 11th Int. Symposi. Medic. Inform. Commun. Techn. Poetugal, Februry 2017, pp 59-63.
[25] Pfletschinger, M. Navarro, and Ibars, C.: 'Energy-efficient data collection in WSN with network coding,' 2011 IEEE GLOBECOM Work. GC Wkshps,USA, December 2011, pp. 394–398.
![Fig. 1. The proposed design model in the WBSN [24]](https://thumb-us.123doks.com/thumbv2/123dok_us/8683003.875163/12.595.128.496.52.291/fig-proposed-design-model-wbsn.webp)