ISSN: 1992-8645 www.jatit.org E-ISSN: 1817-3195
OPTIMIZATION AND MODELING OF A GIVEN PV SYSTEM
HAS A SINGLE PHASE LOAD
1
BENNIS GHITA, 1KARIM MOHAMMED, 2LAGRIOUI AHMED, 1ZINELAABIDINE NADA,
3
SKIK NOUREDDINE, 4ELBARAKA AYOUB
1
LISTA Laboratory, Faculty of Sciences Dhar El Mahraz, Sidi Mohammed Ben Abdellah University Fès,
Morocco 2
Laboratory CP2S, Department AEEE National Higher School of Arts and Crafts, University Moulay
Ismail Meknes – Morocco
3
Mohammedia School’s of Engineer, LEEP Mohamed V University Rabat, Morocco
4
Physics of Solid Laboratory, Faculty of Sciences Dhar El Mahraz, Sidi Mohammed Ben Abdellah
University Fès, Morocco
E-mail: 1 [email protected]
ABSTRACT
the electric energy produced by a PV array is as DC, most electrical loads require AC voltage. also for the inverter DC / AC conversion is essential in the operation of solar power. In this work describes a PV generator connected to load by combining the functionality of a parallel active power filter to improve power quality. The proposed system consists of a field of solar panels, a single-phase voltage inverter and a filler. the principal objective of the project the boost converter is to be used along with a Maximum Power Point Tracking control mechanism. A global search method of maximum power point type perturbation and observation (P & O) is applied. The MPPT is responsible for extracting the maximum possible power from the photovoltaic and feed it to the load via the boost converter and DC-AC converter which steps up the voltage to required magnitude. The principal aim will be to track the maximum power point (MPP) of the photovoltaic module so that the maximum possible power can be extracted from the photovoltaic and simulating the operation of a PV inverter, which aims to improve their performance.
Keywords:MPPT, DC-DC converter, DC-AC converter, PV ARRAY...
1. INTRODUCTION
One of the major concerns in the power sector is increasing day after day in term of power demand, but the unavailability of enough resources to meet the power demand using the conventional energy sources. The demand for renewable energy sources has grown to be used in conjunction with conventional systems to meet the demand for energy. Renewable energy sources such as wind and solar energy are the main sources of energy that are used in this regard. The continuous use of fossil fuels has caused the fossil fuel deposit to be decreased and has drastically affected the
environment minimizing the biosphere and cumulatively adding to global warming.
Solar energy is abundantly disposable that has allowed it possible to harvest it and utilize it properly. Solar energy can be generated unit stand-alone or can be a grid generation depending on the availability of a grid nearby. Thus, it can be used to run the rural areas where the availability of very low grids. Another advantage of using solar energy is to run the mobile whenever and wherever necessary.
ISSN: 1992-8645 www.jatit.org E-ISSN: 1817-3195 junction which generates current when shown to
solar irradiation. PV array is a series and parallel combination of Photovoltaic cells to have a specific current and voltage rating. Photovoltaic array has non-linear I-V characteristic and output power depends on environmental conditions such as temperature and solar irradiation. There is a point on I-V, P-V characteristic curve of PV array named as Maximum Power Point (MPP), where the Photovoltaic system produces its maximum output power. position of MPP changes with change in environmental condition. The aim of MPPT is to adjust the solar operating voltage close to Maximum power point under changing environmental conditions [1,3].
In order to continuously gather the maximum power from the Photovoltaic array, they have to operate at their Maximum Power Point Tracking despite of the inhomogeneous change in environmental conditions. The solar panel is connected to the load by a dc-dc converter to attain the MPP, As a result the voltage at the output of the boost converter will be converted to an AC voltage with a DC -AC inverter that will be directly connected to the load.
In this context, our job is to design, model PV system average power (140 W) operating in continuous-alternative system in optimal conditions regardless of weather conditions and variation of the load. In this article, we present results on the modeling in MATLAB-Simulink environment, a PV system whose operation is controlled by an MPPT control. The results of the production and electrical characterization will be presented in other works. The energy converter is a chopper type booster to convert the DC voltage is alternative we used a DC-AC inverter in this article, the use of MOSFET's power will be put forward to allow greater switching frequency. By cons, a compromise must be made since a larger switching frequency in turn increases switching losses and heating of various consist constitute this inverter and thus a reduction in yield.
2. BLOCK DIAGRAM OF PROPOSED SYSTEM
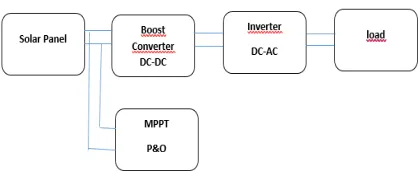
Figure 1 shows the block diagram representation of a PV system, which includes a solar photovoltaic array with DC to DC converter, single phase inverter and load. The solar photovoltaic array produces electricity when the photon of the sunlight strikes the PV cell array. The output of the PV panel is directly connected to the DC to DC boost
converter to step up the DC output of photovoltaic panel.
Then it is fed to an inverter which converts DC-AC power at the desired voltage and frequency. The Photovoltaic panel is assumed to work under varying partial shading and atmospheric condition. The DC–DC converter is controlled by means of a modified P&O algorithm to provide optimum Maximum Power Point voltage corresponding to global maximum power among multiple peaks of the P–V curve.
The Maximum Power Point Tracking controller provides a PWM signal to DC–DC converter to offer faster response in transient state and smoother and less fluctuation in steady state. Then it is fed to a DC link capacitor. The DC link contains power pulsation so that capacitor should be connected to absorb this pulsating power to reduce the DC-link voltage ripple. The DC-link capacitor is calculated by the following equation:
(1)
P : power,
ω: output AC voltage frequency,
Vdc : nominal DC voltage,
[image:2.612.315.524.465.551.2]Vripple : the maximum allowed ripple voltage.
Figure 1. Block diagram of Proposed system
ISSN: 1992-8645 www.jatit.org E-ISSN: 1817-3195 AC load respectively. Finally, the power from
DC-AC power converter is fed to the load.
3. PV ARRAY
The solar cells are generally associated in series and in parallel, then encapsulated in glass to obtain a photovoltaic module. A PV generator consists of modules interconnected to form a unit producing a high DC power compatible with the usual electrical equipment. PV modules are usually connected in series - parallel to increase the voltage and current at the output of the generator. The interconnected modules are mounted over metal supports and inclined at the desired angle depending on the place; this set is often referred to by the module field [3,4].
[image:3.612.310.523.76.174.2]The figure 2 shows the equivalent circuit of the PV cell , this circuit introduces a current source and a diode in parallel and series resistors Rs and parallel ( shunt) Rsh to reflect dissipative processes at the cell level .
Figure 2. Equivalent circuit of PV cell
4. BOOST CONVERTER
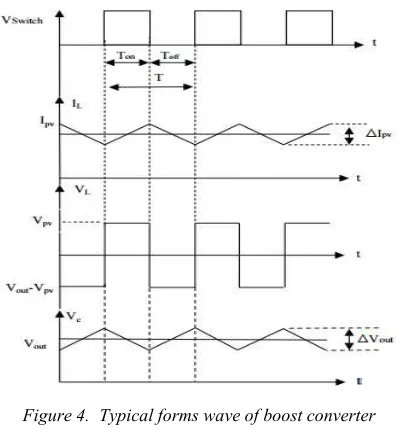
DC-DC converter steps up the input voltage magnitude to a required output voltage magnitude without the use of a transformer. The principal components of a DC-DC boost converter are an inductor, a high frequency switch and a diode. These in a coordinated manner supply power to the load at a voltage highest than the input voltage magnitude. The control strategy lies in the manipulation of the duty cycle (D) of the switch which causes the voltage change.
The dynamic model of the solar generation system exposed in figure 3 can be expressed by an instantaneous switched model as follows [5]:
(2)
[image:3.612.93.262.358.448.2](3)
Figure 3. PV array connected to boost converter
where L1 and iL1 represents the first dc-dc converter storage inductance and the current across it, uc2 is the DC bus voltage and u1 is the switched control signal that can only take the discrete values 0 (switch open) and 1 (switch closed). employing the state averaging method, the switched model can be redefined by the average PWM model as follows:
(4)
(5)
Where α is averaging value of (1-u1), upv1 and ipv1 are the average states of the output voltage and current of the solar cell, iL1 is the average state of the inductor current.
The power switch is accountable for modulating the energy transfer from the input source to the load by varying the duty cycle D [2-4].
Figure 4. Typical forms wave of boost converter
Vpv Ton = (Vout – Vpv).Toff (6)
Vout = Vpv. [(Ton + Toff ) / Toff ] (7)
[image:3.612.318.521.458.680.2]ISSN: 1992-8645 www.jatit.org E-ISSN: 1817-3195 T = Ton + Toff (8)
The rapport (Ton / T) is named the duty cycle α and therefore
α=( Ton / T ) (9)
from equation (7), the voltage release can be derived
Vout = Vpv. [1 / (1 - α) ] (10)
where :
• Vout : is the output voltage.
• Vpv : is thevoltageinput (solar cell).
• ton : is the durationof time whenthe switch is closed.
5. MPPT ALGORITHM
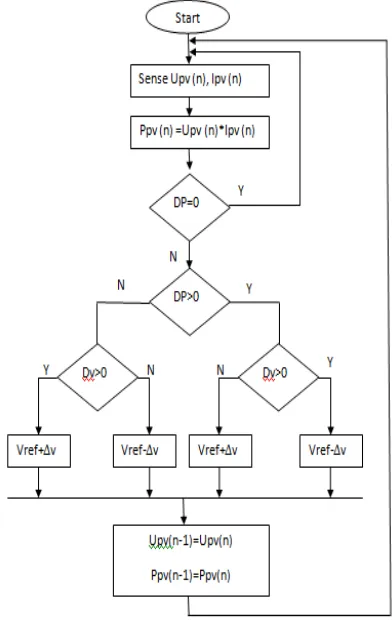
Several MPPT algorithms have been proposed [7], namely; perturbation and observation (P&O) [8], incremental conductance (IncCond)[6], fuzzy based algorithms, MPPT using sliding mode controller [9] They differ from its complexity and tracking accuracy but they all required sensing the PV current and the PV voltage.
IncCond algorithm has an advantage over the P&O method in that it can determine when the Maximum Power Point Tracking reaches the Maximum Power Point, while the output power in the perturbation and observation (P&O) method oscillates around the MPP. IncCond algorithm has an advantage over the P&O method in that it can determine when the Maximum Power Point tracking reaches the Maximum Power Point, while the output power in the perturbation and observation method oscillates around the MPP and can also track rapidly changing irradiance conditions with higher accuracy, The P&O method for MPPT is used here.
The perturbation and observation algorithms are widely used in MPPT because of their simple structure and the few measured parameters which are required. They operate by periodically perturbing (incrementing or decrementing) the array termed voltage and comparing the Photovoltaic output power with that of the previous perturbation cycle. If the power is increasing, the perturbation will continue in the same direction in the next cycle, otherwise the perturbation direction will be reversed. This means the array terminal voltage is perturbed every MPPT cycle, therefore when the perturbation and observation is reached, the perturbation and observation algorithm will
oscillatearound it resulting in a loss of Photovoltaic power, especially in cases of constant or slowly varying atmospheric conditions. This problem can be solved by improving the logic of the P&O algorithm to compare the parameters of two preceding cycles in order to check when the perturbation and observation is reached, and bypass the perturbation stage. Another way to reduce the power loss around the P&O is to decrease the perturbation step, however, the algorithm will be slow in following the perturbation and observation when the atmospheric conditions start to vary and more power will be lost. The implementation of perturbation et observation type MPPTs with increased refresh rates of current (I)-requires two things. First, the P&O algorithm should operate with high sampling rates and the sample values of current and voltage should reflect the tendency of the output power when increasing or decreasing the reference signal for the MPPT power converter. Second, the response time of theMaximum Power Point tracking power converter should be very fast while keeping the switching losses (frequency) low.
[image:4.612.315.511.399.709.2]In Fig. 5 it is given a flowchart witch describe the P & O technique:
ISSN: 1992-8645 www.jatit.org E-ISSN: 1817-3195 6. DC-AC INVERTER
[image:5.612.94.297.191.300.2]The active power transfer from the PV array is achieved by power factor emendation. The inverter function as a current-control inverter. observe that u2 stand for the control signal of DC-AC inverter, the system can be exposed by equations (11) [10].
Figure 6. Inverter connected to load
(11)
Where uc2, us, ur designs a DC voltage, output DC-AC inverter voltage and AC grid voltage, respectively. And ib, ir, id are converter output current, inverter input current and grid current respectively and u2 is the switched control signal that can only take the discrete values 0 (switch open) and 1 (switch closed).
7. SIMULATION RESULTS
[image:5.612.320.501.285.432.2]The Simulink model used for the implementation of the required PV Array, boost converter and DC-AC converter fed to the load system is as shown. This is for the P&O.
Figure 7. Model of PV Array with boost converter , MPPT system, converter DC-AC and load
Here the solar cell is exposed by a block named ‘PV array’. The MPPT is shown in a unit named ‘MPPT’. Other elements of the model establish the boost converter, which consists of a 6 mH inductor and a 1000uF capacitor. This boost converter is employed to step up the voltage to the desired value. The gating signal to the boost converter is generated by comparing the signal generated by the MPPT algorithm to a repeating sequence operating at a high frequency, the PV inverter acts as an interface between the PV array and load, The load is a 10 ohm resistance
• PV ARRAY SIMULATION RESULTS
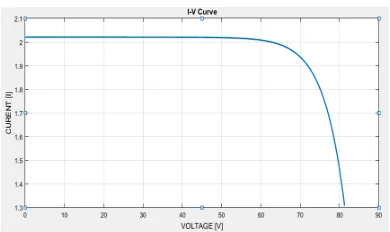
[image:5.612.315.510.469.585.2]The P-V and I-V curves from the simulation are as exposed (Fig.9, Fig.10).
Figure 8. Model of PV array
.
Figure 9. I-V characteristics of a solar cell
[image:5.612.92.300.583.695.2]ISSN: 1992-8645 www.jatit.org E-ISSN: 1817-3195
[image:6.612.89.535.54.642.2]Figure 10. P-V characteristics of a solar cell
fig.10 show the solar output power against the solar output voltage. This clearly abides by the theoretical plot that was exposed before. The maximum power point is presented with a small circle. The initial part of the plot from 0 V to the MPP (maximum power point) voltage is a stable slope curve but after the maximum power point the curve is a steeply falling curve.
• SIMULATION RESULTS OF THE CONVERTER MODEL
The simulations were carried out in Simulink and the various currents, voltages and power plots were obtained.
Fig 11 – 13, show the output voltage, current, power from DC-DC converter.
Figure 11. Output Voltage
Figure 12. Output Curent
Figure 13. Output Power
• SIMULATION RESULTS OF THE MPPT
ISSN: 1992-8645 www.jatit.org E-ISSN: 1817-3195
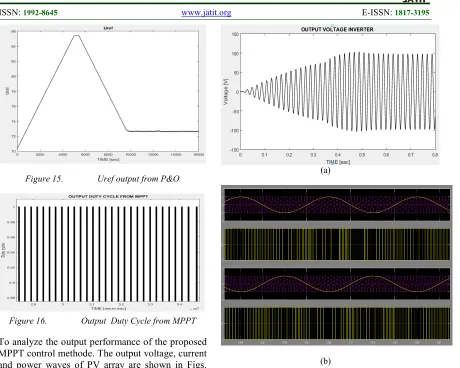
[image:7.612.79.316.69.397.2]Figure 15. Uref output from P&O
Figure 16. Output Duty Cycle from MPPT
To analyze the output performance of the proposed MPPT control methode. The output voltage, current and power waves of PV array are shown in Figs. 11–16, respectively. Meanwhile, the output voltage (including current) and power waves are shown in Figs. 10 and 11, respectively. Fig. 13 shows the changing curve of output power of PV array in the process of tracking the MPP of PV systems using proposed MPPT method. Meanwhile, from Figs. 16, it can be seen that the settling time of all outputs is less than 10 ms, which illustrates the good speediness of PV systems with this MPPT method. Figs. 13 show that the output power has a good steady-state performance.
• SIMULATION RESULTS OF THE DC-AC
Figure 17 shows the inverter output signals. Where it is found that after filtering the output signal, a signal is obtained from a sinusoidal waveform of a frequency of 100 Hz.
(a)
(b)
Figure 17. (a),(b) Output Voltage Inverter
DC-AC
8. CONCLUSION
The proposed method can track with a more stable output power under load disturbance.
REFERENCES
[1] A. Chouder, F. Guijoan, S. Silvestre, “Simulation of fuzzy-based MPP tracker and performance comparison with perturb & observe method”, Revue des Energies Renouvelables, vol.11, no.4, 2008, pp.577-586. [2] M. Arrouf, Optimization of Inverter, Motor and Pump Connected with a Photovoltaic Cell, Ph.D. thesis, University of constantine, Algeria, 2007.
[3] J.A. Jiang, T. H. Huang, Y.T. Hsiao and C.H. Chen, “Maximum PowerTracking for Photovoltaic Power Systems”, Tamkang Journal ofScience and Engineering, vol. 8, no 2, 2005, pp. 147-153.
ISSN: 1992-8645 www.jatit.org E-ISSN: 1817-3195 algorithm implementation techniques”, Power
Electronics, Machines and Drives (PEMD 2012), 6th IET International Conference, IEEE Publication, March 2012, pp.1-6.
[5] Chen-Chi Chu, Chieh-Li Chen, “Robust maximum power point tracking method for photovoltaic cells: Asliding mode control approach”, Solar Energy,Vol. 83 n.8, August 2009, pp. 1370-1378
[6] Won, C., 1994. A new maximum power point tracker of photovoltaic array using fuzzy controller, IEEE PESC Record, vol. 1, pp. pp. 396– 403.
[7] Saadi, A., Moussi, A., 2002. Etude de l’effet des fluctuations de tempe´rature sur les techniques d’optimisations des syste`mes de pompage photovoltaı¨que. CEE’2002, Batna, Alegria, pp. 232–237.
[8] Sugimoto, H., Dong, H., 1997. A new scheme for maximum photovoltaic power tracking control. IEEE Power Conversion Conference Proceedings, vol. 2, pp. 691–696.
[9] LI-Song, Kim, 2006. Robust maximum power point tracker using sliding mode controller for the three-phase grid-connected photovoltaic system. Solar Energy 81, 405–414.