ISSN: 1992-8645 www.jatit.org E-ISSN: 1817-3195
215
DETECTION OF SMOOTH TEXTURE IN FACIAL IMAGES
FOR THE EVALUATION OF UNNATURAL CONTRAST
ENHANCEMENT
1NUR HALILAH BINTI ISMAIL, 2SOONG-DER CHEN
1, 2
Department of Graphics and Multimedia, College of Information Technology,
University Tenaga Nasional
E-mail: [email protected] , [email protected]
ABSTRACT
This paper presents an algorithm for detecting smooth texture in facial images which is prone to unnatural contrast enhancement. The algorithm consists of texture analysis and machine learning algorithm. Wavelet decomposition is used for texture analysis. Smooth texture tends to have small variance among the wavelet coefficients within the same scale. This paper proposes to divide image into 32×32 sub-image with overlapping of 16 pixels, then perform wavelet decomposition with 5 scales. The final feature is a 5 dimensional vector consists of the variance of the wavelet coefficients from each of the 5 scales. Support Vector Machine (SVM) is used for feature classification. The SVM classifier was trained using 468 samples consist of samples from skin areas (smooth texture) and non-smooth area (eye and nose) of 78 test images. The performance of the classifier was evaluated using k-fold cross validation with k range from 2 to 10. The performance was excellent with the average accuracy for each value of k above 95%. The performance was also very consistent across different set of test images with standard deviation range from 1% ~ 4%.
Keywords: Naturalness, Contrast, Statistical Naturalness, Contrast, Image Quality Assessment Algorithm
1. INTRODUCTION
Contrast Enhancement (CE) helps to increase the visibility of image details. However, CE may also cause distortions such as noise artifacts, saturation (loss of details), excessive brightness change and unnatural CE. One of the ways to solve the problems is to develop Image Quality Assessment Algorithm (IQA) capable of evaluating the annoyance of the distortion in a way consistent to human opinion. Generally, there are two types of 2D IQA – fidelity-based and non-fidelity-based. Majority of the IQAs available are fidelity-based which is not suitable for evaluating the quality of contrast enhanced images because they are meant not to be the same as the original images. The non-fidelity based IQAs used to evaluate image contrast and sharpness are found giving ratings which increase or decrease monotonically according to image’s contrast, so they are unable to differentiate between poor, good and unnatural contrast [1]. There are also IQAs designed to measure excessive brightness change, saturation and noise but not the unnatural contrast enhancement. Existing IQAs related to naturalness
such as Lightness-Order-Error (LOE), Structure Measure Operator (SMO) and Statistical Naturalness Measure (SNM) are also found not giving ratings consistent to human opinion [2]. Preliminary observation shows that unnatural contrast enhancement tends to occur at sub-image with smooth texture, so the research focuses on developing a new IQA to detect over enhancement in smooth texture. In particular, this paper presents the algorithm for detecting smooth texture in facial images using texture analysis and machine learning algorithm.
2. LITERATURE REVIEW
2.1 Texture Analysis
Transformed based Approaches
ISSN: 1992-8645 www.jatit.org E-ISSN: 1817-3195
216 perception is closely related to spatial frequency. Fourier transform provides good frequency localization but it is lacking of spatial localization whereas Gabor transform provides better spatial localization but it is lacking of localization in terms of spatial resolution or scale. Wavelet transform offers advantage over the two transforms because it accommodates transform in various spatial resolution or better known as multiresolution analysis.
Multiresolution Analysis and Wavelet Transform
In transform-based methods, there are single and multiresolution, where single resolution used fixed window size while multiresolution used variable window size. The advantages of MRA’s approach are explained here [4].
• Improving performance by capturing long-range phenomena that would otherwise not be utilized.
• Reducing computational complexity, by allowing algorithms to work on both fine and coarse scales, rather than waiting for local pixel-level operations to converge at large scales.
• Improving numerical robustness (reducing problem conditioning), whereby a multiresolution transformation is essentially an algebraic pre-conditioner.
• Simplifying the algorithm, by making accessible long-range features that might, in some problems, be much easier to work with than pixel-level features.
• Improving intuition, by modelling or analyzing the problem over multiple sales, getting deeper insights into the phenomenon at hand.
2.2 Machine Learning Algorithm
Machine learning algorithm is a computational model which automatically learn from input data to make a prediction. The learning process involves identifying the statistical regularities or pattern that exists in the training data. There are several advantages in using machine learning algorithm [5].
• The predictions tends to be more accurate than human-crafted rules.
• Low cost needed because there is no expertise required to make prediction.
• Low cost because the timing for the learning task is flexible.
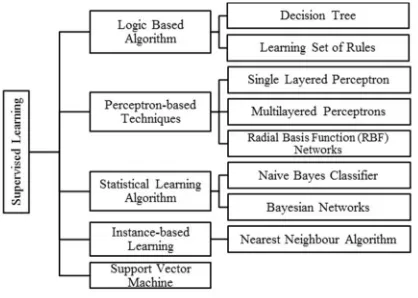
[image:2.612.321.530.219.368.2]There are several types of machine learning algorithm, including supervised learning, unsupervised learning, semi-supervised learning, reinforcement learning, and transduction and learning to learn algorithm. This research focuses supervised learning because the training data with correct label can be easily gathered with help from human observer. There are several algorithm types under supervised learning. Figure 1 shows the list of different types of the classifier.
Figure 1. List of different types of classifier
According to V. Vapnik, the SVM is the latest supervised machine learning algorithm [6]. SVM is designed to minimize the generalization error by maximizing the area between hyperplane and data [7]
A preliminary study was conducted in this research to compare the performance of various types of classifiers including perceptron-based technique, statistical learning algorithm and SVM.
3. SMOOTH TEXTURE DETECTION
ALGORITHM
3.1 Conceptual Design
The algorithm comprises of three main processes that are Preprocessing, Feature Extraction and Feature Classification.
Pre-processing: Input image is resized to standard size similar to those of the training images. The input color image is then converted to gray scale image because only brightness information is needed for texture analysis. Next, each of the image is divided into sub-images which are partially overlapping with each other.
ISSN: 1992-8645 www.jatit.org E-ISSN: 1817-3195
[image:3.612.89.296.164.349.2]217 smooth texture tends look unnatural after contrast enhancement compared to sharp edge after contrast enhancement.
Table 2. Sample of smooth texture and sharp edge before and after contrast enhancement.
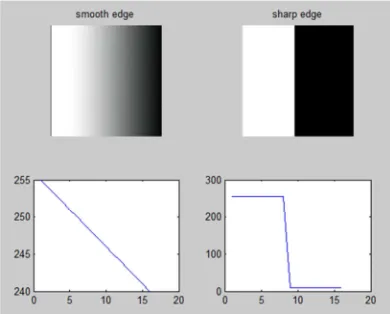
The main feature extraction used in the IQA is the wavelet transform or more specifically, wavelet decomposition. The sample of smooth texture and sharp edge together with respective graph of brightness is illustrated as in Figure 2.
Figure 2. Graph of brightness for smooth texture and sharp edge
The coefficients of wavelet decomposition over 3 scales using Haar Wavelet (see Figure 3) on sample of smooth texture and sharp edge are presented in Table 3 and Table 4 respectively. As shown in Table 3 and 4 (see Table 3 and Table 4), the sub-image with smooth texture tends to have low
variance among the wavelet coefficients within same scale. The sub-image with sharp edges tends to have high variance among the wavelet coefficients within same scale. Daubechies wavelet was chosen as the mother wavelet for its wider support.
[image:3.612.308.521.344.504.2]Figure 3. Haar Wavelet
Table 3: Variance of smooth texture after Haar Wavelet
SMOOTH SURFACE
Pair 1st pair 2nd pair 3rd pair 4th pair Varian ce of Differe nces
Pixel 35 36 37 38 39 40 41 42
Scale 1
1st pair 2nd pair Differences
36 38 40 42 -1 -1 -1 -1 0
Scale 2
1st pair Differences
37 41 -2 -2 0
Scale 3
Differences
39 -4
[image:3.612.90.285.448.605.2]Average of variance = 0
Table 4: Variance of sharp edge after Haar Wavelet
SHARP EDGE
Pair 1st pair 2nd pair 3rd pair 4th pair Varia nce of Diffe rence s Pix
el 35 35 35 35 35 66 66 66
Sca le 1
1st pair 2nd pair Differences
35 35 51 66 0 0 -31 0 240
Sca le 2
1st pair Differences
35 58 0 -16 120
Sca le 3
Differences
47 -23
Average of variance =180 Type of
sub-image
Before contrast enhancement
After contrast enhancement
Smooth texture
[image:3.612.307.520.529.708.2]ISSN: 1992-8645 www.jatit.org E-ISSN: 1817-3195
218 Feature Classification: In feature classification, a sub-image is to be classified into smooth texture or sharp edge using the feature vector extracted from wavelet decomposition. A preliminary study was conducted to compare and the classification accuracy of several types of commonly used learning algorithm. The results are as presented in the Table 5 which shows that Support Vector Machine (SVM) gave the highest accuracy. The results showed that SVM outperformed the other learning algorithm.
Table 5. Prediction Accuracy of Various types of Classifier
Types of Learning Algorithm Percentage of
Accuracy
Neural Network 58.08%
Gaussian Mixture Model 75.00%
Principle Component Analysis 75.00%
Support Vector Machine 81.79%
The SVM classifier used in this research was trained using training images with three different levels of contrast which were poor, good and unnatural contrast. Figure 4 illustrates the Graphical User interface (GUI) used to extract the training samples.
The extraction was done by choosing the sub-images which suffer from unnatural contrast by observation. As illustrated in Figure 4, the sub-images of same location are cropped from the three training images with different level of contrast.
Figure 4.GUI to extract the sample of training
The samples of sub-image with smooth texture were manually cropped from areas which suffers from unnatural contrast enhancement. Samples of sub-image with sharp edge were cropped from the areas with eye and nose.
3.2 Algorithm
The details of the algorithm based on MATLAB scripting language is formally defined as follows:
1. Get user pre-contrast enhanced image, Io and post-contrast enhanced image, Ie the input image types of RGB color image. The input image is resize into standard resolution around 640×480 pixel resolution by using MATLAB’s function imresize() using ratio from equation (1).
(1)
The color images are converted into grey scale image using MATLAB’s function rgb2gray() which uses equation (2) for the conversion:
I(r,c) = 0.2989Ired + 0.5870Igreen + 0.1140Iblue (2)
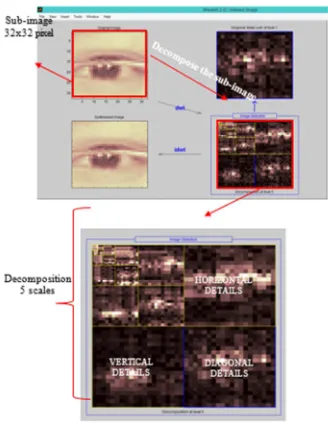
[image:4.612.323.505.454.715.2]The image is divided into sub-image of block size 32×32 with overlapping of 16×16 pixels to reduce the computational complexity as illustrated in Figure 5. The MATLAB function used is blkproc ();
Figure 5. Block size of 32x32 pixels
[image:4.612.90.296.462.592.2]ISSN: 1992-8645 www.jatit.org E-ISSN: 1817-3195
219 The sub-images overlap with each other by 16×16 pixel as illustrated in Figure 6.
[image:5.612.113.277.169.384.2]Then, sub-image of size 32×32 is used as input for 2D wavelet decomposition as illustrated in Figure 7 using MATLAB function’s wavedec2.
Figure 7.Daubechies wavelet with scaling factor 5
Sub-image is decomposed using Daubechies wavelet with scaling factor 5. The decomposition at each scale produces the coefficients of the details in three orientations: vertical, horizontal and diagonal.
[image:5.612.349.466.290.396.2]At each scale, compute the variance of the coefficients of each of the three orientations and choose the maximum variance as illustrated in Figure 8.
Figure 8.Steps to compute wavelet decomposition
The maximum variance from each of the 5 scales are used to form the final feature vector. The 5 dimensional feature vector is then used as input to SVM classifier to determine if the sub-image contains smooth texture or sharp edges.
The SVM classifier used in this research was the MATLAB functions svmtrain() and svmclassify(). The classifier was trained and tested using 78 images. They were created by adjusting the contrast of 26 source images into 3 different level of contrast, i.e. poor, good and unnatural contrast. 6 samples are cropped from each image: 3 samples of sub-image with smooth texture are cropped from the area of skin, 2 and 1 samples of sub-image with sharp edges are cropped from the area of eyes and nose respectively, yielding a total of 468 samples. The sub-images with smooth texture are labeled with 1 while the sub-images with sharp edges are labeled with 0. Figure below shows the sample of results after classification. The detected sub-images with smooth texture are highlighted with red-box as
illustrated in Figure 9.
Figure 9. Sub-image with detected smooth texture
4. RESULTS AND DISCUSSIONS
[image:5.612.90.297.555.649.2]The detection algorithm was evaluated using k-fold cross validation where the 468 samples were randomly divided into k subsets with k-1 subsets used for training and 1 subset used for testing. The testing was repeated k times to have each of the k subsets were used for testing. The classifier was evaluated in terms of prediction accuracy, defined as the number of correct prediction divide by total number of prediction. The evaluation was conducted for k range from 2 to 10. The results are as presented in table 9.
Table 9: Prediction accuracy of the proposed algorithm
Prediction Accuracy
K-fold Mean
Standard
Deviation Min Max
2 95.09% 1% 94.44% 95.73%
3 94.44% 3% 92.31% 97.44%
4 95.09% 1% 93.16% 96.58%
5 95.29% 1% 93.55% 96.81%
6 95.30% 2% 92.31% 98.72%
7 95.30% 2% 92.54% 98.51%
8 95.29% 3% 89.66% 98.31%
[image:5.612.305.521.606.727.2]ISSN: 1992-8645 www.jatit.org E-ISSN: 1817-3195
220
10 95.51% 3% 91.49% 100.00%
The mean prediction accuracy for all values of k are above 95% except for k=3 where the mean prediction accuracy is 94.44%, slightly less than 95%. The results indicate excellent prediction accuracy. The standard deviation of the prediction accuracy range from 1% to 4%, indicating consistent performance across different subset of images. It is noticed that the maximum predication accuracy increases with the value of k, showing that more training samples would increase the prediction accuracy. The minimum performance are all above 90% except k=9 & 9 where they are 89.66% and 88.46% respectively, slightly lower than 90%. Overall, the proposed detection algorithm demonstrated excellent prediction in terms of accuracy and consistency.
5. CONCLUSION
This paper presents an algorithm for detecting smooth texture in facial images which is prone to unnatural contrast enhancement. The algorithm consists of texture analysis using wavelet decomposition and machine learning algorithm using SVM. The evaluation results based 468 samples showed that the detection algorithm can differentiate sub-images with smooth texture from those with sharp edges with very high and consistent accuracy across different set of images. This algorithm is ready to be incorporated as part of the IQA to evaluate the image with unnatural contrast enhancement.
REFERENCES:
[1] Hur Halilah Binti Ismail and Soong-Der Chen, “An Analysis of Image Quality Assessment Algorithm to Detect the Presence of Unnatural Contrast Enhancement”, Journal of Theoretical and Applied Information Technology, Jan 2016 (to be published in Vol. 83, Issues: 3).
[2] Hur Halilah Binti Ismail and Soong-Der Chen, “Analysis and Enhancement of Statistical Naturalness Measure”, Journal of Theoretical and Applied Information Technology, Jan 2016 (to be published in Vol. 83, Issues: 3).
[3] T Ojala and M Pietikainen, “Machine Vision and Media Processing Unit,” University of Oulu Finland [Online]. Available:
http://homepages.inf.ed.ac.uk/rbf/CVonline/LO CAL_COPIES/OJALA1/texclas.htm
[4] Vision and Image Processing (VIP) Lab. [Online] Available: http://vip.uwaterloo.ca/ [5] Rob Schapire, “Machine Learning Algorithms
for Classification,” Princeton University. [6] C. Cortes and V. Vapnik, “Support Vector
Networks, In Proceedings of Machine Learning,” vol.20, pp. 273-297, 1995.