AN ADAPTIVE METHOD FOR ANALYZING AND
PREDICTING THE CRIME LOCATIONS BY MEANS OF
AMABC AND ARM
1R.SUJATHA, 2DR. D.EZHILMARAN
1
Assistant Professor, School of Information Technology and Engineering, VIT University, Vellore
2Assistant Professor, School of Advanced Sciences, VIT University, Vellore
E-mail: [email protected]
ABSTRACT
Since the birth of civilization, offenses of various sorts have been on an uptrend and no wonder Crime investigation, which is emerging as the supreme law enforcement procedure , particularly of the Government, to check such menaces to the society at large, finds itself engrossed in methodical scrutinizes for spotting and evaluating the designs and tendencies shown by the law-breaking anti-socials indulging in offense and chaos so as to find appropriate and accurate preventive actions in due time. Various Techniques were introduced for the method of Crime analysis and Prevention. But the existing methods have some drawbacks, i.e. those methods are not considering the precise features to analyze and predict the high volume crime areas. Hence to reduce the drawbacks in the existing methods, a new crime location prediction technique is proposed in this paper. The proposed technique predicts the crime location by analyzing the crime data by utilizing an Adaptive Mutation based Artificial Bee Colony (AMABC) algorithm. The AMABC algorithm will use socio-economic factors and clustering results in the crime location analysis process. Among the predicted crime locations by the AMABC algorithm, a high crime location is computed by mining the patterns by using Association Rule Mining (ARM) technique. Thus, the proposed technique will successfully predict the locations via AMABC and ARM techniques. In our proposed technique an UCI Machine Learning Repository-Communities and Crime Data Set will be used for the crime analysis. The proposed technique will be compared with the existing optimization methods like GA, PSO and conventional ABC.
Keywords: Crime locations prediction, Artificial Bee Colony (ABC), Adaptive Mutation based Artificial Bee Colony (AMABC), Association Rule Mining (ARM), GA, PSO, UCI data
1. INTRODUCTION
In our daily life, we face Crime, an essential part of the hazards. Crime is going with harm & violence in public outlook; harm to individual, demolition of property and the rejection of reverence to people. Crime is not widening equally across maps [1]. It is of significance, that the incorporation of dissimilar statistics, such as
Pearson’s sample coefficient correlation, a
coefficient of multiple correlations, and an incomplete correlation coefficient, improves viable benefits in the study of obscured situations and conclusion support [2]. From the early 20th century, Forecasting has been a significant part of criminal justice practice. Our contemplation is focused on the intelligence based on conceptual knowledge and reasonable logics of dissimilar kinds of statistical models associated with the
assessment of a vast quantity of data that imitate criminal event and their correlations [3]. A large amount of the first work was carried out for parole forecast, which soon after developed into re-offending further commonly. A number of key methodological concerns were lifted in a way that is still insightful early in the post-war era, [4].
Police did not usually followed Crime
forecasting. As there are many econometric studies of crime or integrating crime in the literature, one is hard-pressed to locate police departments or other police associations making standard use of
forecasting econometric or predictive for
regions as small as feasible for strategic purposes, at the patrol district level or smaller [7].
Explore on cause and consequence must deal with the fundamental recognition problem that happens when trying to forecast outcomes under some imaginary management, say novel sentencing or policing performs. I investigate some of the realistic matters engaged in forecasting city level crime rates by means of a general panel data set in this light [8]. In particular, I spotlight on the problem of forecasting future crime rates from examined data, not the problem of forecasting how dissimilar policy levers impact crime [9] [10]. Even
though obviously significant, fundamental
questions are separate from the predicting question consider. An intention is to observe whether historical time-series data can be applied to offer precise forecasts of future crime rates [11] [12]. At present it is rather practical, and general in fact, for larger police departments to have sufficient computer hardware, data analysis software, and mapping devices that allow visualization of dense spatial data [14] [15]. It is furthermore a new development that the quantities of quality data required to see the samples in crime events over the course of important socioeconomic cycles has been presented. Moreover is, at the present amazing that most police departments have accessible. In addition, technologists talented in spatial data mining are currently rising [13] [16].
In several ways, Data mining is an annex of statistics, with a little non-natural intelligence and machine-learning techniques launched [17]. The decision support system under erection makes certain ease of use and precision of understanding in the appearance of study results from the data warehouse of crime and social explorations [18] [6]. In sustaining decision making and gaining novel insights, Statistical methods and visual depiction of features examined are critical into the arrangement of problems by producing dissimilar sights of the decision position. For crime obstacle measures, it is significant to identify consequential substitutes and approaches during the problem-solving process using statistical study [19] [20].
This document is arranged as follows. In Section 2, we conversed the latest research works associated to the crime study process. The suggested crime location calculation method based on AMABC and ARM is discussed in Section 3. Section 4 will offer experimental consequences that demonstrate that our technique outperforms than other techniques. Lastly, Section 5 reviews the ending of this document.
2. RELATED WORKS
A few of the latest research works associated to crime location study is conversed as follows.
An adaptive bio-inspired technique has been offered by Gianluigi Folino et al. [21] to formulate state of the art clustering algorithms scalable and to offer them with an any-time performance. The technique was based on the biology-inspired example of a flock of birds, i.e. a population of easy agents intermingling locally with every other and with the surroundings. The flocking algorithm offers a form of dispersed adaptive organization constructive to work out complex optimization, classification and allocated control problems. This strategy evades the chronological search of canonical collecting algorithms and allows a scalable execution.
To identify and study crime trend samples from temporal crime activity data, a structure of intelligent decision-support model based on a fuzzy self-organizing map (FSOM) network has been suggested by Sheng-Tun Li et al. [22]. Various
explorations addressing this problem have
commonly used disciplines of behavior science and statistics. In forecasting and avoiding crime, the data mining strategy has been demonstrated to be a proactive decision-support device. On the other hand its efficiency is frequently restricted due to dissimilar natures of crime data, such as linguistic crime data developing over time. Besides, a rule extraction algorithm was applied to expose unseen causal-effect knowledge and make known the shift around consequence. They intended a non-Western real-world case in compare to most present crime associated studies, i.e. the National Police Agency (NPA) in Taiwan. The resultant model can be sustained to police managers in evaluating more suitable law enforcement approaches, as well as developing the utilize of police duty deployment for crime obstacle.
based on data mining methods was conversed in this technique to remove significant entities from police narrative reports which are written in plain book. By applying this strategy, crime data can be routinely entered into a database, in law enforcement agencies. They have furthermore used a SOM clustering technique in the possibility of crime study for final results. In order to execute crime matching process, they employed the collecting results.
Peter Phillips and Ickjai Lee [24] have examined crime datasets in combination with socio-economic and socio-demographic issues to find out co-distribution samples that may supply to the formulation of crime. They suggested a graph based dataset depiction that permits us to remove samples from varied areal comprehensive datasets and visualize the resulting patterns efficiently. They demonstrate this approach with real crime datasets and offer a comparison with other methods.
MV and Apriori algorithm has been suggested by Malathi and S. Santhosh Baboo [25] for working out crimes factor study. In this suggested method, they spotlighted on employ of missing value and gathering algorithm for crime data by means of data mining. They conversed on MV algorithm and Apriori algorithm with a few improvements to assist in the process of filling the missing value and recognition of crime patterns. They used these methods to actual crime data from a city police department. They moreover apply semi-supervised learning method here for knowledge discovery from the crime records and to assist increase the analytical precision.
Kalaikumaran et al. [26] have offered Spatial and Temporal crime hotspot recognition by utilizing spatial clustering algorithm and structured crime classification algorithm to categorize the predicting of the criminal activities. In this suggested technique, they recognized the associated factors to avoid crime by study the crime predicting on place, time and crime type. This technique assists the police department in tactical and stop the crime.
A Bee Colony Optimization for travelling salesman problem has been presented by Ashita S. Bhagade et al. [29]. The idea of social interaction to problem solving is applied in the ABC optimization which is a population-based search algorithm. when on application to the process of path planning
problems for the vehicles, this biological
phenomenon is found to be excellent in solution superiority as well as in computation time. Fitness of paths established by ABC Optimization has been
evaluated by Simulations. The parameters such as tour length, bee travel time by Artificial Bee
Colony Algorithm are evaluated by the
effectiveness of the paths. In this piece of writing, the travelling salesman problem for VRP was maximized by using nearest neighbor method; evaluation results were offered which are then comparison is done with the artificial bee colony algorithm. The best results for discovering the shortest path in a shortest time for moving towards the objective is got from the above approach. The optimal distance with the tour length has been acquired in a more efficient way in this method.
An accomplishment of ABC for satellite image classification has been proposed by Srideepa Banerjee et al. [30]. Mapping the land-usage is done efficiently by using ABC for optimal classification of images. The results acquired by
other techniques like BBO, MLC, MDC,
Membrane computing and Fuzzy classifier has been compared with the results produced by ABC algorithm to show the efficiency of their proposed accomplishment.
The Problem statement
3. PROPOSED CRIME LOCATION PREDICTION TECHNIQUE
Here, we have proposed a crime location prediction technique by using the AMABC and ARM algorithms. The proposed technique utilizes
an UCI Machine Learning
Repository-Communities and Crime Data Set for the crime analysis process. To predict the crime location, the socio-economic features are extracted from the
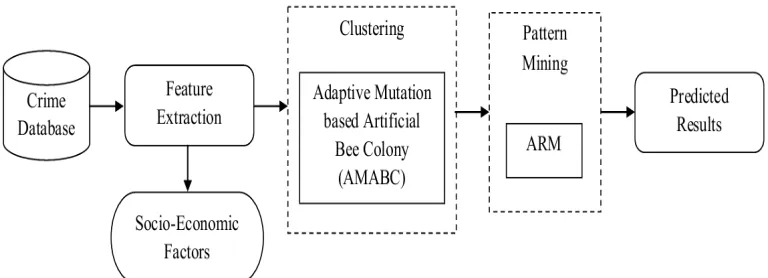
[image:4.612.117.501.221.360.2]dataset and clustered by the AMABC algorithm. Based on the clustered results from the AMABC, the high crime locations are mined by the ARM algorithm. The mined patterns result from the ARM algorithm produce the high crime volume locations in the future also. Our proposed method comprised of three stages namely, (i) Feature Extraction (ii) Clustering by AMABC and (iii) Pattern Mining using ARM. The structure of our proposed crime location prediction technique is shown in Fig. 1.
Fig. 1. Structural Diagram Of Our Proposed Crime Location Prediction Technique
Let us considered the database
N j M i
a
D={ ij}; =1,2,L , =1,2,L , with the size of
N
M× and aij denotes the database attributes
values. The process of feature extraction from the
database
D
is discussed below.3.1 Feature Extraction
In feature extraction, the attributes values which are utilized in the clustering process are extracted from the given crime database. During the feature extraction the missing values are removed from the database which is denoted by the symbol (?). Because the present of missing values in the database will creates the time complexity in the location prediction process. For that we remove the
columns from Dwhich has the missing value (?).
After discarding the missing values the dimension
of the database D is reduced which is denoted
asD'(M×N'). Then the attribute values in the
database D'are involved in the clustering process.
3.2 Clustering by AMABC
In clustering process, the database attributes values and their crime values are clustered by the AMABC algorithm. Before the process of AMABC, initially the crime values are clustered by distinction process. We apply the clustering process
on the last column values because the last columns values are the crime values. To cluster the crime values, the distinction process is performed by find the minimum and maximum value form the crime
values are denoted as min
' ) (
N ij
a , max
' ) (
N ij
a . The
distinction computation is stated as,
min ' max
' ( ) )
(
N ij N
ij a
a
d= − (1)
Based on the distinction value
d
the crimevalues are clustered. Thusthe clustered result from
the distinction process are denoted ascR, where
R
represents the number of clusters. To optimizethe crime values clustered results an artificial Bee colony algorithm is exploited to cluster the other
attributes which are in the database D'by using the
clustering resultscR.
Step 1: Initialization- The adaptive mutation based ABC algorithm is initiated by randomly
generating the food sources
S
within the interval[0, 1]. The generated food sources are denoted
as
S
=
{
s
k}
, the length of the food sources arerelated to the number of clusters. Moreover, during the food source generation for every generated food
sources another one variable
A
is generated whichhave the random values within the interval [0, 1]
and the size is defined as1×N'−1. The generated
food sources and variable A mapped to the original
databaseD'. The generated food sources are linked
with the N'column value and the variable values
are the other attributes values. In crime value clustering, the same attributes values corresponding crime values are clustered into two different clusters (i.e.) the same attributes crime values are changed. Hence, we analyze this clustering results,
the attributes values in variable Aare changed into
one dimensional value by performing the following operations,
(i) Initially we take the transpose to the food
sources (s )k Tand multiplied with the variableA.
So we get the resultant value in the size of
1 '− ×N R
(ii) Next, we apply transpose to the variable
T
A)
( and thus transpose values are multiplied with
corresponding cluster values with the size
ofR×N'−1. As a result we obtain a M number of
attribute values (dii') with one dimensional and we
know that attributes values are belongs to the which cluster based on the crime values clustered result.
Step 2: Fitness Function- After that, we find the fitness function for the generated food sources by exploiting the function is stated as,
∑ ∑
= ≠ = − = M i M i i i ii k d R R F 1 ' 1 ' ' ) 1 ( 1 (2) − ∈ − = otherwise d d c d d if d d d i i i i i i ii ; ) ( 1 & ; ) ( 2 ' 1 ' 2 '' (3)
By using Eqn. (2), the generated food sources fitness function is computed and we select the best food sources which have the minimum fitness value
among the
k
number of generated food sources.Next, we generate the new food sources in employed bee phase by using the selected best food sources.
Step 3: Employed bee phase - In employed bee phase the new food sources are generated based on the Equation which is stated as,
) )(
1 , 1
( min max
min k k
k n
k s s s
s = +φ − − (4)
By Eqn. (4), the new food sources are generated in the employed bees and that generated food source values are mutated by the adaptive mutation function. The adaptive mutation function in the food source generation process will increase the ABC performance. The new adaptive mutation function in the AMABC is described as,
− − − − +
= ωω ωω
δ ϕ χ avg avg F F F F F F AM ) ( ) ( 1 min max min max (5) ω
δ
− = avg F F Fmax min
(6) Where,
χ- Mutation probability
ϕ
ω, - are the mutation coefficient factors
avg
F
F
F
max,
min,
- denotes the maximum,minimum and average fitness of the food sources
Based on the value from the Eqn. (5), the food sources values are mutated and then the food sources are evaluated by the Eqn. (2).
Step 4: Onlooker bee phase – Similarly to the employed bee phase, the new food sources are also generated in onlooker bee phase by using the neighborhood search and adaptive mutation Equations are given in Eqn. (4) and Eqn. (5) and computes the best food sources by Eqn. (2). If the food sources worst positions are forgotten, then the scout bees are initiated.
Step 5: Scout bee Phase – In Scout bee phase the food sources are generated in random manner. The process is iteratively repeated when a maximum swarm duration, i.e., cycles are reached. Once the termination criterion is met, the best food sources are selected and it’s denoted as
'
k s
b .
3.3 Pattern Mining using ARM
AMABC algorithm, a matrix
Ψ
is computed which is stated as,A b N
R T
k s ) ( ) 1
( × '− = '
Ψ (7)
The obtained matrix
Ψ
has the size of R×N'−1which is computed by multiply the input vectors
'
k s
b is a one dimensional vector with
R
number ofvalues with variable
A
that also a one dimensionalvector with N'−1 values. After that, the matrix each
row vector values are multiplied with the database
) 1
( '
'M×N −
D values by,
T
i R N D M N
I =Ψ( × '−1)× '( × '−1) (8)
Thus the obtained values from the Eqn. (8) are clustered by the distinction process. The clustered result from the distinction process is divided by comparing the clusters centroid values with the defined threshold value. The divided clusters namely (i) Low cluster (L) (ii) Medium cluster (M) and (iii) High cluster (H). Based on this clusters results the rules are generated with combining their
crime clusters results we already mentioned as
c
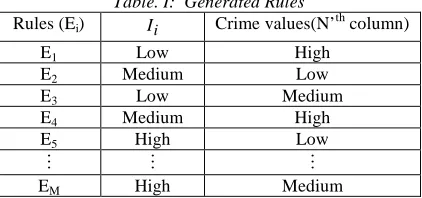
R. [image:6.612.90.301.435.534.2]The crime values clustered results also divided as L, M and H. The rules are generated by combining both values and the generated rules like,
Table. I: Generated Rules
Rules (Ei) I i Crime values(N’th column)
E1 Low High
E2 Medium Low
E3 Low Medium
E4 Medium High
E5 High Low
M M M
EM High Medium
The rules Ei are generated for the whole database
'
D and mine the important rules from the generated
rules which have the high support value than the
minimum support threshold
α
. The extracted ruleslike,
≥
=
otherwise E s E
EEi i; ( i) α (9)
In Equ. (9),
s
(
E
i)
represents the support of theruleEi.
After the generation of two length rules, the three and four length rules are generated by clustering the two length rules corresponding attributes values like household income, number of people under the
poverty, year of education and percentage of
population. By clustering above-mentioned
attributes values three lengths, four lengths and five length rules are generated. Moreover, the rules are extracted from the generated rules which satisfy the minimum support threshold value. Based on the extracted rules the crime locations are predicted by our proposed technique. The predicted crime locations and their extracted attribute values by our proposed technique are illustrated in next section.
4. EXPERIMENTAL RESULTS AND DISCUSSION
The proposed crime location prediction
technique is implemented in the working platform of JAVA (JDK 1.6) with machine configuration as follows
Processor: Intel dual core OS: Windows 7
CPU speed: 3.06GHz RAM: 2 GB
Database Description
To do the crime location analysis, the UCI Machine Learning Repository-Communities and Crime Data Set which is given in [31], is used in our paper. The data combines socio-economic data from the 1990 US Census, law enforcement data from the 1990 US LEMAS survey, and crime data from the 1995 FBI UCR. The UCI dataset size is defined as 1994x127, i.e. the UCI dataset have 1994 rows and 127 columns data. Initially we perform the feature extraction process on this UCI dataset. In feature extraction the columns which have the missing value (?) is deleted from the dataset. After deleting the missing values, the dataset size is reduced to 1994x102 i.e. the columns size is reduced from 127 to 102. This reduced 1994x102 dataset is utilized in the further clustering and pattern mining process.
In our proposed technique, the crime locations were predicted by AMABC and ARM algorithms. Initially the dataset crime values and their input attributes values were clustered by the AMABC technique. Afterward, the rules were mined from the clustering results by using the ARM algorithm. The crime locations predicted results are obtained by randomly selects any one of the socio-economic factors. Thus the selected socio-economic factors are household income, number of people under the
poverty, year of education, percentage of
Table. II : Amabc Parameters Values
Parameters Values
Number of employed bees 3
Number of onlooker bees 3
Number of scout bees 1
χ 0.5
ϕ
ω, 0.5,0.5
In our crime location prediction process, the user can select any one of the input type (socio economic factors) that belongs to the category Percentage of population, Household income, Peoples under the poverty, Year of Education and Crime Rate. After the input type selection the corresponding input value is to be selected which has three values low, medium and high. Based on
the type of the input, the values and rules are displayed with the corresponding population value. For example, the selected input type and value is percentage of population and low. Based on the input, the other parameters like, Household income, Peoples under the poverty, Year of Education, Crime Rate values and rules are displayed in the user interface diagram.
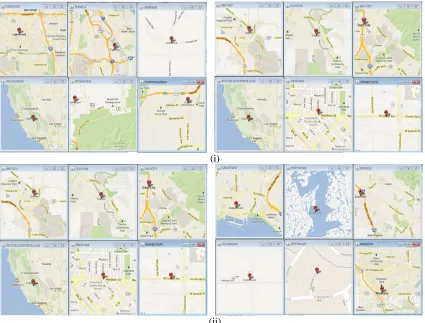
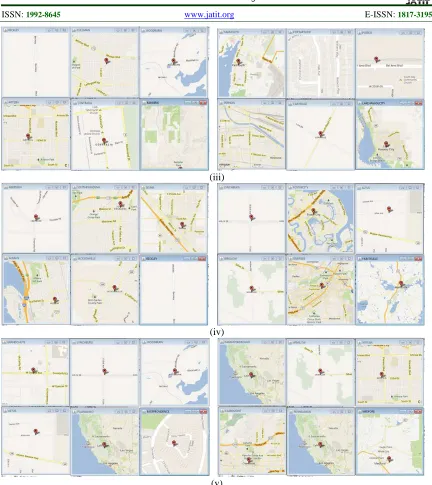
By using the interface diagram, the crime locations are predicted. Thus the crime location predicted results are plotted using the GM tool. The predicted crime locations are sending to the Google Map. In GM the corresponding locations maps are displayed. By using the java tool the displayed crime locations in GM tool are cropped. The result of crime location prediction result by our proposed technique in GM tool is illustrated in Fig. 2.
(i)
(iii)
(iv)
(v)
Fig. 2. Predicted crime location by our proposed AMABC-ARM techniques (i) Percentage of population (ii) Household income (iii) Peoples under the poverty (iv) Year of Education and (v) Crime Rate
By using the displayed details of user interface diagram, the corresponding locations are predicted with the help of GM tool. The crime location predicted results by our proposed AMABC-ARM
[image:8.612.89.521.67.552.2]technique by using the GM tool results are shown in Fig. 2. The different length rules results which are generated in our proposed technique are given in Table 3.
Table. III : The Generated Rules From Our Proposed Technique In Different Lengths (I) 2 (III) 3 (III) 4 And (IV) 5
Rules Household Income Crime Rate
1 Low (0) High (2)
2 Low (0) Medium (1)
3 High (2) Low (0)
4 Medium (1) Low (0)
5 Low (0) Low (0)
Rules Household Income Peoples Under the Poverty Crime Rate
1 High (2) Low (0) Low (0)
2 Medium (1) Medium (1) Low (0)
3 Low (0) Low (0) Medium (1)
4 High (2) Low (0) Medium (1)
5 Medium (1) High (2) Low (0)
(ii)
Rules Household
Income
Peoples Under the Poverty
Percentage of Population
Crime Rate
1 High (2) High (2) Low (0) Low (0)
2 High (2) High (2) High (2) Low (0)
3 High (2) Low (0) Low (0) Medium (1)
4 Medium (1) Medium (1) Medium (1) Low (0)
5 Medium (1) High (2) Low (0) Medium (1)
(iii) Rules Household
Income
Peoples Under the Poverty
Percentage of Population
Year of Education
Crime Rate
1 Low (0) Medium (1) High (2) Low (0) High (2)
2 Low (0) Low (0) High (2) Low (0) Medium (1)
3 Medium (1) Low (0) High (2) High (2) Low (0)
4 Low (0) Low (0) High (2) Low (0) High (2)
5 Medium (1) Medium (1) Medium (1) Medium (1) Low (0)
(iv)
Moreover our proposed AMABC-ARM
technique performance is compared with the conventional ABC, GA and PSO techniques. To accomplish the performance analysis process, we have performed 100 rounds of experiments by AMABC, standard ABC, GA and PSO methods.
Moreover, our proposed and conventional
optimization techniques performance is evaluated by using their objective function in selecting the more accurate solutions. For the different socio economic factors input values, these optimization methods results in selecting the best solutions are illustrated in Fig. 3 to 5.
(i) (ii)
[image:9.612.102.512.410.700.2](iii) (iv)
Fig. 3. Our Proposed AMABC, Standard ABC, GA And PSO Methods Performance Result When The Input Value Is Low And The Socio Economic Factors (I) Percentage Of Population (Ii) Household Income (Iii) Peoples Under The
(i) (ii)
(Iii) (Iv)
Fig. 4. Our Proposed Amabc, Standard Abc, Ga And Pso Methods Performance Result When The Input Value Is Medium And The Socio Economic Factors (I) Percentage Of Population (Ii) Household Income (Iii) Peoples Under
The Poverty (Iv) Year Of Education
(i) (ii)
(iii) (iv)
Fig. 5. Our Proposed AMABC, Standard ABC, GA And PSO Methods Performance Result When The Input Value Is High And The Socio Economic Factors (I) Percentage Of Population (Ii) Household Income (Iii) Peoples Under The
As can be seen from Fig. 3, 4 and 5, our proposed crime location prediction technique with AMABC-ARM technique has attain a high performance results in their objective function minimization when compared to other optimization techniques. The low fitness values shows that our proposed AMABC technique has given more
accurate clustering results than the other
optimization methods. For all input values our AMABC has acquire low fitness value for all socio economic factors. Hence, this results shows that our proposed AMABC technique has given high clustering performance in the crime location prediction process.
5. CONCLUSION
In this paper, a crime location prediction technique with AMABC and ARM algorithms was proposed to find the high crime locations based on the UCI data. In this proposed methodology, the socio economic features were collected from the UCI crime data and that extracted data’s are initially clustered by using the AMABC algorithm. The optimal clustered results from the AMABC algorithm were given to the ARM to mine the high crime locations. Our proposed crime location prediction technique has successfully predicts the crime locations based on the mined results. All these processes have improved the performance of the proposed crime location prediction technique. The crime location prediction results in GM tool results have shown that the proposed technique with AMABC-ARM has achieved high accuracy. Thus, our proposed crime location prediction technique has offered better performance in predict the crime location.
REFERENCES
[1] Fagbaibi S.O, Ibrahim, Y. L and Longe O.B,
“On the Use of Data Mining Techniques for Crime Profiling”, Computing, Information Systems & Development Informatics Journal, Vol. 3. No. 3, pp. 61-68, 2012.
[2] Abraham, T. and de Vel O., “Investigative
profiling with computer forensic log data and association rules”, In Proceedings of IEEE International Conference on Data Mining, Edinburgh, SA, Australia, pp. 11-18, 2002.
[3] Giles Oatley, Brian Ewart and John Zeleznikow
“Decision support systems for police: Lessons from the application of data mining techniques
to “soft” forensic evidence”, Journal of Artificial Intelligence and Law, Vol. 4, No. 1-2, pp. 35-100, 2006.
[4] Giles C Oatley and Brian W Ewart, “Crimes
analysis software: ‘pins in maps’, clustering and Bayes net prediction”, Expert Systems with Applications, Vol. 25, No. 4, pp. 569-588, 2003.
[5] Que Thi Nguyet Nguyen, Philip A. Neck and
Thanh Hai Nguyen “The Critical Role of Knowledge Management in Achieving and
Sustaining Organizational Competitive
Advantage”, International Business Research, Vol. 2, No. 3, pp. 3-16, 2009.
[6] Dale Dzemydiene and Vitalija Rudzkiene,
“Multiple Regression Analysis in Crime Pattern Warehouse for Decision Support”, Database and Expert Systems Applications, Springer-Verlag Berlin Heidelberg, pp. 249-258, 2002.
[7] Wilpen Gorr, and Richard Harries,
“Introduction to crime forecasting”,
International Journal of Forecasting, Vol. 19, No. 4, pp. 551-555, 2003.
[8] Wilpen Gorr, Andreas Olligschlaeger and
Yvonne Thompson, “Short-term forecasting of crime”, International Journal of Forecasting, Vol. 19, No. 4, pp. 579-594, 2003.
[9] Derek Deadman, “Forecasting residential
burglary”, International Journal of Forecasting, Vol. 19, No. 4, pp. 567-578, 2003.
[10]Richard Harries, “Modelling and predicting
recorded property crime trends in England and Wales-a retrospective”, International Journal of Forecasting, Vol. 19, No. 4, pp. 557-566, 2003.
[11]Hua Liu and Donald E. Brown, “Criminal
incident prediction using a point-pattern-based density model”, International Journal of Forecasting, Vol. 19, No. 4, pp. 603-622, 2003.
[12]Jonathan J. Corcoran, Ian D. Wilson and J.
Andrew Ware, “Predicting the geo-temporal variations of crime and disorder”, International Journal of Forecasting, Vol. 19, No. 4, pp. 603-622, 2003.
[13]Jens Ludwig “Better Gun Enforcement, Less
Crime”, Criminology & Public Policy, Vol. 4, No. 4, pp. 677-716, 2005.
[14]Jose Angelo Divino and Michael McAleer,
“Modelling and forecasting daily international mass tourism to Peru”, Tourism Management, Vol. 31, No. 6, pp. 846-854, 2010.
[15]John T. Coshall, “Combining volatility and
international tourism”, Tourism Management, Vol. 30, No. 4, pp. 495-511, 2009.
[16]Chia-Lin Chang, Songsak Sriboonchitt and
Aree Wiboonpongse, “Modeling and
forecasting tourism from East Asia to Thailand under temporal and spatial aggregation”, Mathematics and Computers in Simulation, Vol. 79, No. 5, pp.1730-1744, 2009.
[17]Thongtae P. and Srisuk S., “An Analysis of
Data Mining Applications in Crime Domain”, In proceedings of IEEE 8th International Conference on Computer and Information Technology Workshops, Sydney, QLD, pp. 122-126, 2008.
[18]Wolfgang Banzhaf, Peter Nordin, Robert E.
Keller and Frank D. Francone, “Genetic programming”, IEEE Intelligent Systems and their Applications, Vol. 15, No. 3, pp. 74-84, 2000.
[19]Chung-Hsien Yu, Max W. Ward, Melissa
Morabito and Wei Ding, “Crime Forecasting Using Data Mining Techniques”, In proceedings of IEEE 11th International Conference on Data Mining Workshops (ICDMW), Vancouver, BC, pp. 779-786, 2011.
[20]Daniel Keim, Gennady Andrienko, Jean-Daniel
Fekete, Carsten Gorg, Jorn Kohlhammer and Guy Melançon, “Visual Analytics: Definition,
Process, and Challenges”, Information
Visualization, Vol. 4950, pp. 154-175, 2008.
[21]Gianluigi Folino, Agostino Forestiero and
Giandomenico Spezzano, “An adaptive flocking
algorithm for performing approximate
clustering”, Information Sciences, Vol. 179, No. 18, pp. 3059–3078, 2009
[22]Sheng-Tun Li, Shu-Ching Kuo and Fu-Ching
Tsai, “An intelligent decision-support model using FSOM and rule extraction for crime prevention”, Expert Systems with Applications, Vol. 37, No. 10, pp. 7108-7119, 2010.
[23]Mohammad Reza Keyvanpour, Mostafa Javideh
and Mohammad Reza Ebrahimi, “Detecting and investigating crime by means of data mining: a general crime matching framework”, Procedia Computer Science, Vol. 3, pp. 872-880, 2011.
[24]Peter Phillips and Ickjai Lee, “Mining
co-distribution patterns for large crime datasets”, Expert Systems with Applications, Vol. 39, No. 14, pp. 11556-11563, 2011.
[25]A. Malathi and S. Santhosh Baboo,
“Algorithmic Crime Prediction Model Based on the Analysis of Crime Clusters”, Global Journal of Computer Science and Technology, Vol. 11, No. 11, 2011.
[26]T. Kalaikumaran, V.P. Arunachalam and S.
Karthik, “An Analysis and Prediction of Criminal Activities by using STCH Method”, European Journal of Scientific Research, Vol. 76 No. 3, pp. 379-385, 2012.
[27]Changsheng Zhang, Dantong Ouyang and Jiaxu
Ning, “An artificial bee colony approach for clustering”, Expert Systems with Applications, Vol. 37, pp. 4761–4767, 2010
[28]Yunfeng Xu, Ping Fan and Ling Yuan,” A
Simple and Efficient Artificial Bee Colony
Algorithm”, Mathematical Problems in
Engineering, Vol. 2013, pp. 1-9, 2013
[29]Ashita S. Bhagade and Parag. V. Puranik,
"Artificial Bee Colony (ABC) Algorithm for
Vehicle Routing Optimization Problem",
International Journal of Soft Computing and Engineering (IJSCE), Vol. 2, No. 2, pp. 329-333, 2012
[30]Srideepa Banerjee, Akanksha Bharadwaj, Daya
Gupta and Panchal, "Remote Sensing Image Classification Using Artificial Bee Colony Algorithm", International Journal of Computer Science and Informatics, Vol. 2, No. 3, pp. 67-72, 2012
[31]