Munich Personal RePEc Archive
Globalization and the Composition of
Public Education Expenditures: A
Dynamic Panel Analysis
Baskaran, Thushyanthan and Hessami, Zohal
University of Gothenburg, Gothenburg Centre of Globalization and
Development, University of Konstanz, Department of Economics
15 September 2010
Online at
https://mpra.ub.uni-muenchen.de/25750/
Globalization and the Composition of Public Education
Expenditures: A Dynamic Panel Analysis
Thushyanthan Baskaran
∗†and Zohal Hessami
# †University of Gothenburg, [email protected] #University of Konstanz, [email protected]
Abstract
This paper studies the relationship between globalization and the composition of public education expenditures. The theoretical model is embedded in a median voter setting and is based on the assumption that globalization leads to lower tax revenues as well as an increase in the relative wage of high-skilled workers. Overall, the theoretical discussion suggests that globalization induces a shift from primary to tertiary education expendi-tures, which is backed up by empirical evidence from dynamic panel estimations for 121 countries over the 1992 - 2006 period. A possible implication of the shift in educational priorities towards higher education is an increase in income inequality.
Keywords: Globalization, public education expenditures, educational policy JEL codes: F15, H42, H52
∗Corresponding author: Thushyanthan Baskaran, Gothenburg Centre of Globalization and Development, Department of Economics, University of Gothenburg, P.O. Box 640, SE 405 30 Gothenburg, Sweden, Phone: +46(0)31-786 1374, Fax: +46(0)31-786 1326
1
Introduction
Globalization has received considerable attention in the political economy literature. One reason is that deliberate political actions such as trade liberalization and the abandonment of international capital controls have promoted the emergence of globalization. However, the true driving force behind globalization are technological advances in transportation, commu-nication, and the processing of information that are only weakly influenced by policy-makers (James, 2002).1 An alternative explanation for the concentration of globalization research in the political economy literature is the content of this research focusing on the vices and virtues of globalization’s influence on public policy. More specifically, many contributions investigate whether a higher degree of global economic integration has changed the scope and limits of policy-making (Schulze and Ursprung, 1999).
From the public finance perspective, the literature highlights the implications of global-ization for governments’ ability to collect tax revenue. The main hypothesis investigated is whether the loss of governments’ monopoly of coercion and strategic interactions with other governments competing for fiscal revenues has affected the design of tax systems (Aizenman and Jinjarak, 2009; Dreher, 2006b; Hines and Summers, 2009). This includes the question whether taxes have shifted from mobile production factors such as capital to less mobile factors such as labor (Rodrik, 1997; Schwarz, 2007; Zodrow and Mieszkowski, 1986). Even though such investigations are very enlightening, it should not be overlooked that labor nowadays also more easily transcends national borders, albeit not as much as capital. In this context, one may wonder whether governments have adjusted the composition of education expenditures given that especially high-skilled labor is considered to be mobile (Docquier and Marfouk, 2006; Egger and Radulescu, 2009; Grogger and Hanson, forthcoming).
Following such considerations, this paper investigates the effect of globalization on the composition of public education expenditures. First, we derive in a median voter setting that governments’ readjustments of educational policies due to globalization are determined by the extent to which global economic integration affects (i) wages for different types of labor and (ii) the domestic tax rate. On the one hand, governments have an incentive to invest more resources in tertiary education if globalization increases the wages of high-skilled workers. This would lead to a larger tax base and as a result the median voter would receive more transfer payments. On the other hand, globalization intensifies tax competition and thereby diminishes governments’ ability to finance generous transfers to the median voter. From this perspective, it is likely that governments reduce funding for educational programs that do not directly benefit the median voter such as higher education. The overall effect identified
in the theoretical discussion is, however, that governments spend less on primaryrelative to tertiary education with a higher level of global economic integration.
Since the theoretical discussion suggests the existence of two effects that go in opposite directions, the net effect of globalization on the government’s educational priorities is clearly an empirical matter, which is adressed in the second part of the paper. The dynamic panel analysis is based on System GMM estimations and uses data for 121 countries over the 1992 - 2006 period. The estimation results reveal that globalization has induced governments in developed as well as developing countries to increase spending for tertiary relative to primary education. Most likely, students from socio-economically disadvantaged backgrounds benefit predominantly from primary education expenditures, while students with a wealthy background benefit from tertiary education expenditures (Blanden and Machin, 2004; Hansen and Weisbrod, 1969). We therefore conclude that the effect of globalization on the composition of public education expenditures may widen the gap between rich and poor in the long-run.2
While the shift in educational priorities towards higher education reduces equity, the effect from an efficiency point of view is ambiguous.3 In the context of our theoretical model, the allocation of more public resources to higher education is optimal from the viewpoint of the government since it seeks to be re-elected and therefore maximizes the welfare of the median voter. However, if one regards this issue more broadly from an efficiency perspective, additional insights are gained. On the one hand, there is evidence for developing countries that the ’social rate of return’ to public resources invested at the primary level is higher than for public expenditures on higher education levels (Carnoy, 1992; Lockheed and Verspoor, 1991; Psacharopoulos, 1985).4 This would suggest that the observed shift in educational priorities
is inefficient. On the other hand, a higher share of tertiary education expenditures can be justified from an efficiency perspective by pointing out that an increasingly technology-driven world characterized by fierce international competition requires more high-skilled labor.
The remainder of this paper is structured as follows. Section 2 briefly reviews the exist-ing literature on the linkages between globalization and education expenditures. In section 3, we discuss the relationship between globalization and public expenditures for primary, sec-ondary, and tertiary education in the context of a theoretical model. Section 4 presents the data and the empirical strategy, while we explore the effect of globalization on the composi-tion of public educacomposi-tion expenditures empirically in seccomposi-tion 5. Second 6 concludes the analysis.
2W¨alde (2000) explains the positive relationship between the share of primary education expenditures and income inequality by deriving that a higher share of secondary and tertiary expenditures provides incentives for the development of technologies. These technologies in turn lead to a replacement of unskilled by skilled labor that gives rise to a higher extent of income inequality.
3For a distinction between competitiveness-, finance- and equity-driven educational reforms due to global-ization see Carnoy (1999).
2
Globalization and public education: a literature review
The implications of globalization for public education are studied in several social sciences, each of which emphasize different aspects of educational policies.5 The sociological and peda-gogical literature primarily analyze how globalization affects structural aspects of public edu-cation systems. More specifically, the main questions that are investigated are whether global-ization leads to a convergence of nationally diverse educational systems (Green, 1999), whether it causes a “commodification”6 of education (Naidoo and Jamieson, 2005), and whether it increases the influence of international organizations on educational systems, especially in developing countries (McNeely, 1995).
While the analysis of globalization’s influence on different aspects of educational policies brings to light interesting insights, one has to acknowledge that there are many of these measures. Hence, an analysis that is intended to analyze the overall effect of globalization on educational policies needs to be based on a more aggregated measure. To this end, researchers usually resort to data for public spending on education. The impact of globalization on public educationexpenditures is primarily analyzed within the fields of economics and political science. The relevant theoretical contributions can be subdivided into two groups linking globalization with education expenditures through two distinct channels. The first strand of the literature is based on the tax competition perspective. In this view, globalization is understood to increase the mobility of the high-skilled, which impedes the government’s ability to tax these high-income earners. The reduction of the tax base has in turn an influence on public education expenditures.
One example for the tax competition approach is a study by Anderson and Konrad (2003) that analyzes theoretically how globalization affects private education effort and public edu-cation polices under the assumption of a Leviathan government. In their model, governments can decrease the private costs of education by appropriate public policies (which can be un-derstood as expenditures) and thus motivate individuals to acquire more education. More educated individuals earn a higher wage and thus provide a larger tax base, but they also have the ability to emigrate if the domestic tax-rate is too high. The authors derive that, in general, it cannot be determined whether globalization induces the government to decrease the private costs of education. This would suggest that there is no theoretical link between globalization and total education expenditures.
A second contribution comes from Haupt and Janeba (2009) who assume that the gov-ernment seeks to redistribute income from high- to low-skilled individuals. The income
redis-5For an overview of recent research on the relationship between globalization on education that covers several academic disciplines see Spring (2008).
tribution is indirectly achieved by providing the high-skilled with education subsidies. As a result, the future income of the high-skilled increases and this in turn causes the tax base to become larger. The derivations suggest that globalization reduces public education subsidies since high-skilled individuals can emigrate more easily in a globalized world. This forces the government to lower the tax rate in equilibrium. To conclude, an increase in the tax base due to public education expenditures does not benefit the low-skilled as much as it does in a world with closed economies. This provides the government with an incentive to reduce total education spending in an increasingly globalized world.
Poutvaara (2008) provides an extension to the two studies mentioned above by making a distinction between different subjects that are taught in higher education institutions. He argues that governments are aware of the increasing difficulty of taxation due to the threat of emigration. Therefore, governments react to globalization by reducing funding for fields of studies where the skills acquired are internationally transferable such as engineering. At the same time, governments provide more financial resources for subjects that are country-specific, such as law. This shift of education spending between different fields of studies is a valuable extension to previous investigations. However, due to the difficulty of obtaining data for such a detailed analysis, there is so far no empirical evidence in favor of this hypothesis.
The empirical evidence regarding globalization’s effect on total education expenditures is mixed, which is not surprising given the disagreements in the theoretical literature. Dreher et al. (2008) find that globalization has not changed the share of education expenditures in total public expenditures. In contrast, Avelino et al. (2005) find that trade openness was positively related to education spending in Latin America during the 1980 - 1999 period. Busemeyer (2007) uses trade openness as a control variable in a panel data study on the influence of partisan politics on education expenditures in 21 OECD countries. He finds that total education expenditures were positively related to openness during the nineties, and that globalization has increased expenditures for all stages of education, but primarily for tertiary education. Shelton (2007) tests a large number of determinants of public education expendi-tures simultaneously in order to avoid omitted variable bias. His analysis provides evidence that globalization does not have an effect on public education expenditures. One reason why most of these studies fail to identify a significant effect of global economic integration on educational policies is that these effects can only be observed at lower levels of aggregation.
develop-ing countries, primary education expenditures are expected to increase relative to tertiary education expenditures, whereas the opposite effect is expected for developed countries.
Based on estimations with country averages over the 1990s, Ansell (2008) finds confir-mation for the implications of the theoretical analysis. However, the investigation neglects the dynamics of both globalization and the composition of public education expenditures. In addition, given the large number of studies that refute the Heckscher-Ohlin theorem with regard to globalization’s predicted influence on wages (Feenstra and Hanson, 1999; Goldberg and Pavenik, 2007), the theoretical foundation for Ansell’s findings is rather weak.
The above literature review illustrates that the bulk of the literature examining global-ization’s influence on public education emphasizes the role of tax competition. In addition, it has to be noted that the studies in the tax competition literature focus on the effect of globalization on total education expenditures while neglecting potential effects on the com-position of education expenditures. The only study analyzing globalization’s influence on the composition of public education expenditures that we know of is exclusively based on the Heckscher-Ohlin theorem. However, this theorem hardly finds confirmation in the empirical literature. Moreover, evidence in favor of this theoretical model by Ansell is exclusively based on a cross-sectional investigation.
The contribution of our paper is that we address each of the aforementioned shortcom-ings. First, we derive a theoretical model that emphasizes increased tax competition due to global economic integration, while also taking into account globalization’s effect on wages as identified in the empirical literature. Second, we apply the theoretical model in order to in-vestigate globalization’s influence on the shares of primary, secondary and tertiary education. In this context, we make use of the common assumption that high-skilled individuals are more mobile than low-skilled individuals. Third, we conduct our estimations with panel data and apply dynamic estimation techniques in order to make use of the variation over time in our dataset. Fourth, we use the shares of primary, secondary and tertiary education as dependent variables rather than total education expenditures.
3
Theoretical model
3.1 Individuals
The effective labor supply pi of an individual i depends on the amount of public ex-penditures gi the government invests in her education. More specifically, we assume that
pi=pi(gi) withdpi/dgi>0,d2pi/dgi2 <0, anddpi/dg−i = 0. Public education expenditures
are therefore assumed to be productivity-enhancing.
Based on these considerations, individual i’s market incomeνi can be specified as:
νi(wi, gi) =wipi(gi), (3.1)
withdνi/dwi >0,dνi/dgi>0, andd2νi/dgidwi >0. In other words, increasing wages and an increasing effective productivity because of increased funding for education raise the market income of individual i. Moreover, the cross derivative of income with respect to wages and education expenditures is positive.
3.1.1 Consumption
In addition to the market income described in equation 3.1, an individual’s consumption level is determined by her tax rate and the redistributive transfers she might receive. We assume that every individual is faced with a proportional tax ratet, while the redistributive transfers are only paid to the median voter. Moreover, in contrast to the tax rate, public education expendituresgi may vary between individuals.
As a result, the net-consumptionyi of a generic individuali can be expressed as:
yi= (1−t)νi(wi, gi). (3.2)
In comparison, the net-consumption of the median voter amounts to:
ym = (1−t)νm(wm, gm) +r, (3.3)
3.1.2 Emigration
In a world with global economic integration, the government has to take into account that high-income individuals may emigrate if the tax burden is relatively high.7 To model an
individual’s mobility decision, we presume that the government can commit to a tax rate but not to an allocation of expenditures. An individual therefore only takes the tax rate into account when deciding on whether to emigrate or not.
She will remain in the home country if the following condition holds:
(1−t)wi+ǫi ≥(1−tF)wF −x, (3.4)
withtdenoting the domestic tax rate andwF
i andtF representing the wage and tax rate in case the individual emigrates to another jurisdiction (the “foreign” wage and tax rate). Moreover,
x denotes the mobility costs, i.e. the costs that are incurred in the case of emigration (will be discussed in more detail in section 3.4.2), while ǫi is a random parameter measuring the home attachment of individual iwithǫ∼U(0, b). Individualiwill emigrate if the sum of her net-wage and the home attachment is larger than the net-wage she would earn in the foreign country minus the mobility costs. For simplicity, we treat in the following the foreign tax rate and the foreign wage as exogenously given and fixed.
Given that ǫi is random, individual i’s mobility decision is stochastic. The probability
πi that individualiwill remain in the country can be expressed as a function of the domestic tax rate, the domestic wage, and the mobility costs:
πi(t, wi, x) =F(ǫ≥z) = 1− 1
bz, (3.5)
with z= (1−tF)wF −(1−t)w i−x,
dπi/dt=−1bwi <0,
dπi/dx= 1b >0,
and dπi/dwi = (1−t)>0.
3.2 The government
The government seeks to be re-elected and is therefore exclusively concerned with the con-sumption possibilities of the median voteri=m.8 The government’s objective function is set
up accordingly:
max gi,t,r
W = (1−t)νm(wm, gm) +r (3.6)
with gi≥0, t≥0, r≥0.
The government has to ensure that expenditures do not exceed revenues when maximiz-ing the above objective function, while in turn both of these variables depend on the tax rate the governments chooses. The balanced budget constraint can in summary be expressed as:
Z 1
0
πi(t, wi, x)tνi(wi, gi)−gi
di−r = 0 (3.7)
Thus, the income of the other individuals is only of interest to the government as far as it leads to higher transfers to the median voter.
3.3 Equilibrium
In the following, concentrate on equilibria with strictly positive transfers (r >0) and assume that the median voter remains in the country (she will not emigrate irrespective of any wage differentials). Our objective is to derive expressions for the government’s three decision variables in equilibrium: the respective level of education expenditures, the tax rate, and the redistributive transfers. We start with the equilibrium education expenditures for the median voter which can be expressed as:
dνm
dgm
−1 = 0. (3.8)
Equation 3.8 states that in equilibrium, the increase in the median voter’s income due to a marginal increase in education expenditures is equal to the marginal costs, which are 1.
In comparison, education expenditures for all other individuals are characterized by:
tdνi dgi
−1 = 0 ∀i6=m. (3.9)
Thus, the increase in tax revenues due to a marginal increase in education expenditures should be equal to the costs, which are 1.
The second decision variable of the government, which applies to all individuals including the median voter, is the equilibrium tax rate, which can be represented by the following expression:
−νm+ Z 1
0
dπi
dt tνi+πiνi
di= 0. (3.10)
Hence, the equilibrium tax rate is characterized by the fact that the emigration-induced expected decrease in tax revenues when the tax rate is raised marginally is slightly outweighed (that is, byνm) by the increase in revenues.
The third decision variable of the government, i.e. the amount of redistributive transfers
rin equilibrium, is determined residually as total revenues minus total education expenditures.
3.4 Globalization
In the following, we analyze how globalization affects the equilibrium characterized by equa-tion (3.8)-(3.10). Globalizaequa-tion has two effects in the context of this model as global economic integration affects wages (section 3.4.1) and reduces the costs of mobility (section 3.4.2).
3.4.1 Globalization and wages
Trade theory suggests a link between the extent of economic integration and factor returns. The Heckscher-Ohlin model and the related Stolper-Samuelson theorem as the central con-tributions on this topic state that falling trade restrictions lead to an equalization of factor prizes through an increase in the trade of final goods (Krugman and Obstfeld, 2005).
As an extension to the discusssion in section 3.1, we therefore model the wage of a generic individualias a function of her ability βi as well as globalization G, i. e.:
wi =wi(βi, G). (3.11)
How does globalization affect the wage for individual ior put differently, what is the sign of
The empirical evidence, however, only partially confirms the predictions of the Heckscher-Ohlin model. Several studies suggest that global economic integration has led to a relative rise in wages for high-skilled labor in industrialized countries (Feenstra and Hanson, 1999)
and developing countries (Goldberg and Pavenik, 2007). Therefore, it is reasonable to assume thatd2wi/dβidG >0 for any country irrespective of the country’s development status.
3.4.2 Mobility costs
The mobility costs x (see equation 3.4) can be understood as the monetary representation of the difficulty of keeping in touch with one’s social and professional networks, and as the pecuniary costs of relocating physical assets. One consequence of global economic integration is certainly a reduction in transportation costs, which implies that it becomes easier to visit one’s acquaintances in the home country, or to relocate physical assets. Another effect is the ongoing spread of English as a modern Lingua Franca and the emergence of a common global culture, both of which might reduce the non-monetary costs of moving to a foreign country. It is therefore reasonable to assume that mobility costs are a decreasing function of the extent of globalization, i.e. x=x(G) withdx/dG <0.
3.5 Globalization and public education
By implicitly differentiating equation (3.8) with respect to G, we can analyze the effect of globalization on educational expenditures for programs that benefit the median voter:
dgm
dG =−
d2νm
dg2
m −1
d2νm
dgmdwm
dwm
dG . (3.12)
The sign of this expression depends only on the sign ofdwm/dG, i. e., how globalization affects the returns to the type of labor supplied by the median voter. The government increases funding for educational programs that benefit the median voter if the returns to the type of labor that she supplies increase, and vice versa.
The effect of globalization on education expenditures for the remaining individuals is more complicated. Implicitly differentiating equation (3.9) and using the fact that in any equilibriumdνi/dgi= 1/tgives:
dgi
dG =−
1
t dt dG +t
d2νi
dwidgi
dwi
dG t
d2νi
dg2
i −1
This expression reveals that the effect of globalization on the amount of education expen-diture for individual i works through two distinct channels: (i) its effect on the wage for that type of labor that individual i supplies and (ii) its effect on the domestic tax rate. The wage effect may vary between individuals. In particular, the sign of dwi/dG is likely to differ between high-skilled and low-skilled individuals. The available empirical evidence indicates that dwi/dG is positive for high-skilled and negative for low-skilled individuals in both industrialized and developing countries. Thus, this effect of globalization should in-centivize governments to increase expenditures for higher educational programs and reduce expenditures for basic education.
On the other hand, the tax effect on education expenditures is the same for alli6=m. However,tis an endogenous variable so that the sign ofdt/dGhas to be determined within the system. It is unclear whether it will be positive or negative. Implicitly differentiating equation (3.10) reveals that globalization has two effects on the domestic tax rate (see appendix A for the derivation). First, it changes individuali’s probability of emigration. Second, it has an effect on incomes, a direct one through its effect of wages and an indirect one through its effect on education expenditures. Intuitively, if globalization increases gross income, then the tax base increases and the government has an incentive to raise the domestic tax rate. On the other hand, by decreasing mobility costs, globalization provides governments with an incentive to lower the domestic tax rate in order to limit emigration.
Especially because of its indeterminate effect on the tax rate, the effect of globalization on absolute education expenditures is ambiguous. However, the previous discussion of the wage effects of globalization suggests that globalization induces governments in industrialized and developing countries to increase expenditure for higher educational programsrelative to lower educational programs. We test this implication of our model in the next section empir-ically on the basis of the composition of public education expenditures.
4
Data and methodology
4.1 Data description
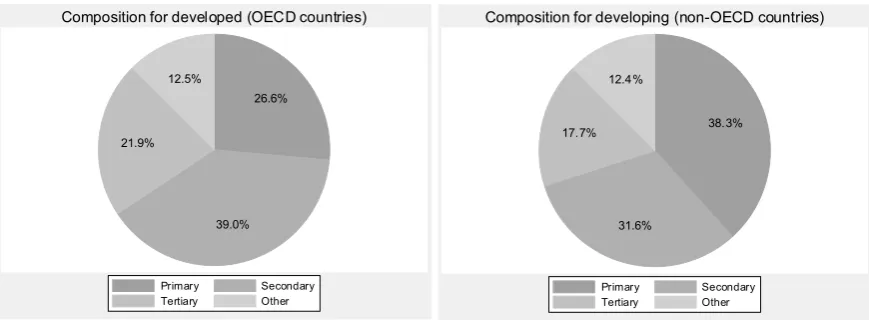
Figure 1: Composition of public education expenditures, 1992 - 2006
! " # $ %
& ' '
(
) ! * " # $ %
Source: World Bank Edstats database
Figure 1 suggests that OECD countries spend a smaller share of total education expenditures (26.6%) on primary education than developing countries (38.3%). This can be attributed to the fact that the average level of education is lower in developing countries with a large share of the population only receiving basic education. This difference in education levels is also confirmed with regard to the shares of secondary and tertiary education expenditures. While OECD countries spend on average 39.0% and 21.9% of the funds available for education on secondary and tertiary education, these shares only amount to 31.6% and 17.7% in developing countries, respectively.
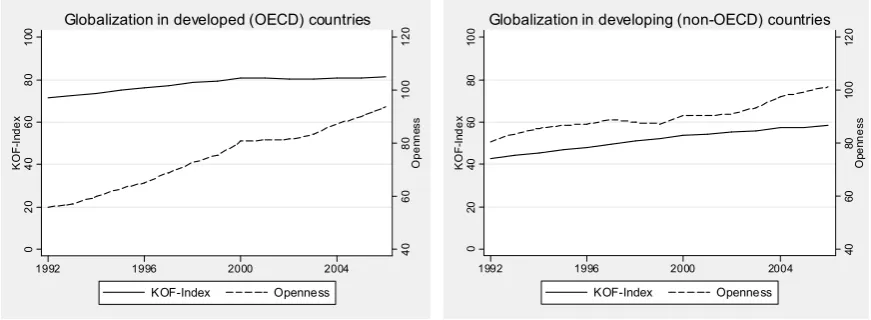
To measure globalization, we use two proxies: the KOF-Index introduced by Dreher (2006a) and the trade openness measure (openness at constant prices) from the Penn World Tables. The KOF-Index is based on three sub-indexes which capture the extent of economic, social, and political globalization. The overall index of globalization is therefore based on a number of measures that capture actual economic flows, economic restrictions, data on information flows, data on personal contact, and data on cultural proximity. The KOF-Index may therefore provide a more comprehensive picture than the traditionally used trade openness measure. Nonetheless, we also use the trade openness measure from the Penn World Tables as a second proxy for global economic integration to check for the robustness of the results. The evolution of the country-averages of these two measures of globalization from 1992 onwards is plotted separately for developed and developing countries in figure 2.
on international trade. In contrast, the KOF-Index is generally by about 20 points higher in developed than in developing countries, which may imply that for instance in terms of cul-tural proximity and information flows wealthy countries are more globalized. The differences between the two globalization measures are the reason why we choose to use both of them in our regression analysis.
Figure 2: Evolution of globalization over time, 1992 - 2006
!" # $ % !" # $ %
Sources: Penn World Tables and Dreher (2006a)
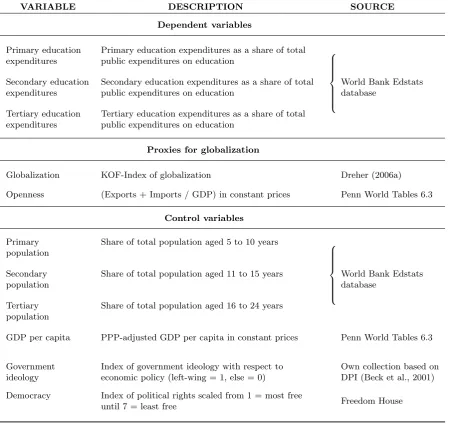
The first control variable that we include is the dependent variable lagged by one period in order to capture dynamic effects in the composition of public education expenditures. Further control variables are: (i) the population share of each of the age groups relevant for the three educational programs, which represent the “theoretical demand” for the three types of education expenditures; (ii) GDP per capita, which captures how a country’s income level is related to the structure of education expenditures; (iii) a measure of government ideology, which controls for systematic partisan biases in education expenditures; and (iv) an index of democracy, which measures to what extent the government is accountable to the electorate.
We associate individuals aged 5 to 10 years with primary education, individuals aged 11 to 15 years with secondary education, and individuals aged 16 to 24 years with tertiary edu-cation. Even though this is only a rough approximation of the theoretical demand as the ages at which the three educational stages begin vary between countries, it should be sufficiently accurate. The ideology variable is a dummy that is 1 when the government is left-wing with respect to economic policy, and else 0.9 The democracy index is 1 when citizens possess the highest and 7 when they possess the lowest amount of political rights. All control variables and their sources are listed in table 4.
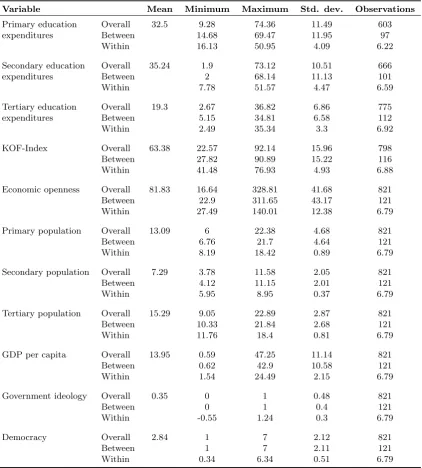
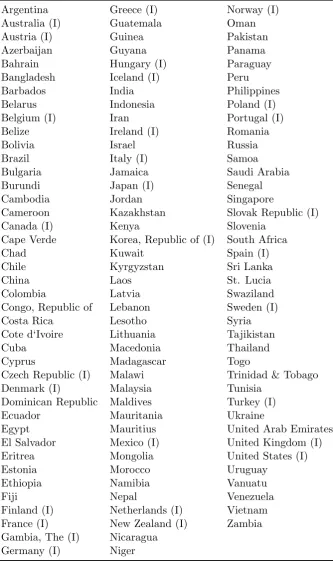
The unbalanced dataset covers altogether 121 countries, both developing and developed, over the 1992 - 2006 period.10 Summary statistics for all variables used in the subsequent regressions are collected in table 5; a list of the countries that are considered in this study can be found in table 6. Both tables are in the appendix.
4.2 Empirical strategy
We estimate three dynamic panel data models to analyze the effect of globalization on the composition of public education expenditures. The three models take into account that the overall effect of globalization may differ between developing and industrialized countries. In each of the three cases, the estimation model is specified as follows:
Expshareit =αExpsharei,t−1+δGlobalizationit∗IN D+γGlobalizationit∗DEV
+βxit+ωt+λi+ǫit, (4.1)
whereExpshareit is the share of public education expenditures allocated to either primary, secondary, or tertiary education,Expsharei,t−1 represents the lag of the dependent variable,
λi are the country fixed effects, ωtare the year fixed effects,xitrepresents a vector of control variables, and ǫit is the error term.
Note that analyzing these three expenditure categories simultaneously is not redundant since there are certain education expenditures that cannot be allocated to any of these three categories, so that the shares of primary, secondary, and tertiary education expenditures in total education expenditures do generally not sum up to 100% (see figure 1).
Two variables are used in model 4.1 to explore the effect of globalization in industrial-ized and developing countries. The first variable is constructed by interacting a measure of globalization with a dummy variable, IN D, that is 1 for industrialized countries and else 0. The second variable is constructed by interacting the same measure of globalization with a dummy variable,DEV, that is 1 for developing countries and else 0. We classify all countries as either industrialized or developing (see table 6).11 We are interested in the estimates forδ
and γ, the coefficients on the interaction variables: δ measures the effect of globalization in industrialized countries, whereasγ measures its effect in developing countries.
10Since fixed effects are included in the empirical model (4.1), each of the included countries has at least two non-missing observations during the time frame of the analysis.
Note that we do not include the industrialized and developing country dummies, i.e., the “lower-order” effects of these dummies, as separate control variables in equation 4.1 because they are multicollinear with the country fixed effects. We also do not include a lower-order effect for the globalization variable because it is multi-collinear with a linear combination of the interaction effects. It may seem that the non-inclusion of the lower-order effects leads to an omitted variable bias (Braumoeller, 2004). This concern is, however, unwarranted.12
Due to the presence of the fixed effects and the lagged dependent variable in equation 4.1, pooled OLS estimations are inconsistent. However, it is a well-known fact that the application of the within-estimator to dynamic models also yields biased estimates (Nickell, 1981). While the within-estimator is consistent and the Nickell-bias can be ignored when T is large, this bias may be serious in panels with a small time dimension. In order to shed light on the question what a large T means in the given context, Judson and Owen (1999) find that even in panels with T = 30, the estimated coefficient may have a bias of up to 20% of the true value. Since T is equal to 15 in our dataset, it is obvious that more sophisticated estimation methods are required for the empirical analysis.
Several IV and GMM estimators have been developed in order to deal with the bias in dynamic panel data models. For models where it cannot be assumed that disturbances are spherical, the Arellano-Bond Difference GMM and Blundell-Bond System GMM estima-tors outperform their alternatives (Roodman, 2009b). Between these two, the choice of the appropriate estimator depends on whether the dependent variable is persistent or not. For persistent dependent variables, there is evidence that the Difference-GMM estimator gives rise to finite sample biases. In this case, the System-GMM estimator is recommended (Blundell and Bond, 1998; 2000). Since education expenditures are likely to be persistent, we apply the robust one-step System-GMM estimator. Moreover, we use a collapsed “GMM-style” instruments set to address the instrument proliferation problem (Roodman, 2009a).13
12To see why, note that the complete specification of a model with country fixed effects and interactions of a continuous control variable with a dummy variable is:yit=αi+β1di+β2xit+β3dixit+ǫit, withdi∈ {0,1}(we
omit other control variables for brevity). Thus,β2is the marginal effect ofxwhendi= 0 whereasβ2+β3is the marginal effect whendi= 1. This expression is equivalent toyit=αi+β1di+β2(dixit+(1−di)xit)+β3dixit+ǫit,
which can be rewritten asyit=αi+β1di+β2(1−di)xit+ (β2+β3)dixit+ǫit, oryit=zi+γcixit+δdixit+ǫit,
withzi=αi+β1di,ci= (1−di), γ=β2, δ= (β2+β3). This last expression has the same structure as equation 4.1. Since it is equivalent to the complete specification, the same is true for equation 4.1.
5
Estimation results
5.1 Baseline regressions
The results for the System-GMM estimations of model 4.1 are collected in table 1. In the first three models (column 2 to 4), the KOF-Index is used as the proxy for globalization, while the last three models (column 5 to 7) are estimated using the trade openness measure. There are three models for each globalization proxy due to the fact that we use three different dependent variables: the share of primary, secondary, and tertiary education spending. The dependent variables represent the expenditures at each of the three education levels divided by total education expenditures.
First, note that the diagnostic tests reported at the bottom of table 1 confirm the validity of the set of instruments for all models. This can be deduced from the fact that the Hansen-J overidentification test is never rejected, while in addition second-order autocorrelation in the differenced errors is not found for any of the models (first-order autocorrelation in the differ-enced errors is expected and does not invalidate the estimates). The number of instruments is also smaller than the number of cross-sections, so that a bias due to instrument proliferation is not likely (see also section 5.2 for the findings from robustness checks).
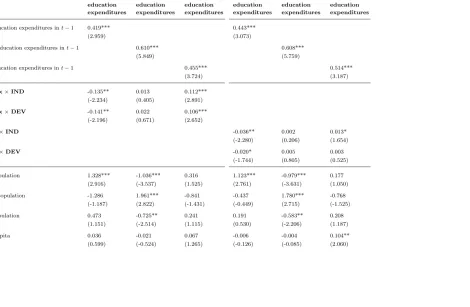
Table 1: Baseline results: System GMM estimations, 1992 – 2006
KOF - Globalization Index Openness (Penn World Tables)
Dependent variables: Primary Secondary Tertiary Primary Secondary Tertiary
education education education education education education
expenditures expenditures expenditures expenditures expenditures expenditures
Primary education expenditures int−1 0.419*** 0.443***
(2.959) (3.073)
Secondary education expenditures int−1 0.610*** 0.608***
(5.849) (5.759)
Tertiary education expenditures int−1 0.455*** 0.514***
(3.724) (3.187)
KOF-Index×IND -0.135** 0.013 0.112***
(-2.234) (0.405) (2.891)
KOF-Index×DEV -0.141** 0.022 0.106***
(-2.196) (0.671) (2.652)
Openness×IND -0.036** 0.002 0.013*
(-2.280) (0.206) (1.654)
Openness×DEV -0.020* 0.005 0.003
(-1.744) (0.805) (0.525)
Primary population 1.328*** -1.036*** 0.316 1.123*** -0.979*** 0.177
(2.916) (-3.537) (1.525) (2.761) (-3.631) (1.050)
Secondary population -1.286 1.961*** -0.841 -0.437 1.780*** -0.768
(-1.187) (2.822) (-1.431) (-0.449) (2.715) (-1.525)
Tertiary population 0.473 -0.725** 0.241 0.191 -0.583** 0.208
(1.151) (-2.514) (1.115) (0.530) (-2.206) (1.187)
GDP per capita 0.036 -0.021 0.067 -0.006 -0.004 0.104**
(0.599) (-0.524) (1.265) (-0.126) (-0.085) (2.060)
Democracy -0.880** 0.385** 0.321* -0.519* 0.190 0.162
(-2.167) (1.980) (1.729) (-1.663) (1.046) (1.190)
Government ideology -1.185 0.296 0.413 -0.873 0.148 0.178
(-1.643) (0.591) (0.929) (-1.300) (0.290) (0.422)
Observations 587 650 754 603 666 775
χ2 767.071 1085.849 418.184 713.561 997.463 473.261
Hansen-test (p-value) 0.809 0.283 0.374 0.849 0.392 0.445
AR(1)-test (p-value) 0.003 0.001 0.000 0.003 0.001 0.000
AR(2)-test (p-value) 0.143 0.808 0.179 0.126 0.849 0.247
Number of instruments 51 53 53 51 53 53
1 Stars indicate significance levels at 10%(*), 5%(**) and 1%(***) 2 t-statistics are in parentheses 3Time fixed effects are included in all models 4 The GMM-style instruments set has been collapsed 5 Hypothesis tests are based on robust one-step standard errors
6 p-values for the Hansen overidentification test and the Arellano-Bond AR(1) and AR(2) tests as well as the number of instruments are reported at
the bottom of the table. 7 Primary, secondary and tertiary education expenditures are measured as a share of total education expenditures
The remaining control variables perform reasonably. The lagged dependent variable is signifi-cantly positive with a coefficient between 0.4 and 0.6 for all expenditure categories, suggesting a high degree of persistence in the composition of education expenditures. In addition, we find that there is a positive relationship between the population share relevant for primary and secondary education and expenditures for primary and secondary education, whereas an increase in the population share relevant for tertiary education has no effect on expenditures. This is consistent with the notion that primary and the earlier parts of secondary education are usually compulsory, so that a larger number of children in the age group relevant for these education levels directly increases spending needs.
Another variable that is significant in some models is the democracy index which is consistently negative in the model for primary education and positive in the models for secondary and tertiary education. Taking into account that the democracy index is 1 when citizens possess the highest and 7 when they possess the lowest amount of political rights, we find that ceteris paribus more democratic countries spend more on lower relative to higher educational programs. This can be attributed to the fact that a deepening of democracy usually suggests an extension of political rights to the less wealthy part of society. These groups in turn benefit more from primary than from tertiary education.
The coefficient for GDP per capita is insignificant in all models but one. In the re-gressions using tertiary education expenditures as the dependent variable and openness as a proxy for globalization (last column of table 1), it has a positive coefficient significant at the 5% level. This would suggest that the more wealthy a country is the higher is the share of public resources intended for education that this country allocates to higher education. Finally, the coefficient for government ideology is insignificant suggesting that there are no systematic partisan biases in the allocation of public education expenditures. This is not surprising given that the evidence in favor of partisan biases at higher levels of aggregation of public expenditures is generally quite weak.
5.2 Sensitivity analysis
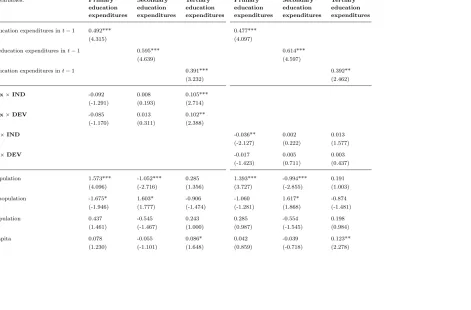
Table 2: Robustness check I: System GMM estimations with two-step standard errors, 1992 – 2006
KOF - Globalization Index Openness (Penn World Tables)
Dependent variables: Primary Secondary Tertiary Primary Secondary Tertiary
education education education education education education
expenditures expenditures expenditures expenditures expenditures expenditures
Primary education expenditures int−1 0.492*** 0.477***
(4.315) (4.097)
Secondary education expenditures int−1 0.595*** 0.614***
(4.639) (4.597)
Tertiary education expenditures int−1 0.391*** 0.392**
(3.232) (2.462)
KOF-Index×IND -0.092 0.008 0.105***
(-1.291) (0.193) (2.714)
KOF-Index×DEV -0.085 0.013 0.102**
(-1.170) (0.311) (2.388)
Openness×IND -0.036** 0.002 0.013
(-2.127) (0.222) (1.577)
Openness×DEV -0.017 0.005 0.003
(-1.423) (0.711) (0.437)
Primary population 1.573*** -1.052*** 0.285 1.393*** -0.994*** 0.191
(4.096) (-2.716) (1.356) (3.727) (-2.855) (1.003)
Secondary population -1.675* 1.603* -0.906 -1.060 1.617* -0.874
(-1.946) (1.777) (-1.474) (-1.281) (1.868) (-1.481)
Tertiary population 0.437 -0.545 0.243 0.285 -0.554 0.198
(1.461) (-1.467) (1.000) (0.987) (-1.545) (0.984)
GDP per capita 0.078 -0.055 0.086* 0.042 -0.039 0.123**
Democracy -0.764** 0.265 0.345 -0.470* 0.157 0.179
(-2.404) (1.199) (1.526) (-1.670) (0.712) (1.120)
Government ideology -0.561 0.001 0.386 -0.717 0.014 0.292
(-0.835) (0.002) (0.840) (-1.094) (0.028) (0.641)
Observations 587 650 754 603 666 775
χ2 882.706 1042.405 373.045 850.113 883.511 381.440
Hansen-test (p-value) 0.809 0.283 0.374 0.849 0.392 0.445
AR(1)-test (p-value) 0.017 0.006 0.016 0.016 0.006 0.046
AR(2)-test (p-value) 0.174 0.873 0.173 0.159 0.908 0.238
Number of instruments 51 53 53 51 53 53
1 Stars indicate significance levels at 10%(*), 5%(**) and 1%(***) 2 t-statistics are in parentheses 3Time fixed effects are included in all models 4 The GMM-style instruments set has been collapsed 5 Hypothesis tests are based on two-step standard errors with Windmeijer correction 6 p-values for the Hansen overidentification test and the Arellano-Bond AR(1) and AR(2) tests as well as the number of instruments are reported
at the bottom of the table. The null hypothesis is ..., respectively.
7 Primary, secondary and tertiary education expenditures are measured as a share of total education expenditures
Generally, we find that the results in table 2 confirm the conclusions drawn with regard to the estimation results in table 1, even though the overall significance of the coefficients is lower. In the regressions using the KOF-Index as a proxy for globalization (columns 2 to 4), the coefficient for globalization is insignificant in the primary education expenditure model, but continues to be significantly positive for tertiary education expenditures. The size of the coefficient is also very similar to the results in table 1. This suggests that expenditures are still shifted towards higher education, even though it is not clear at the cost of which other category this occurs. The coefficient for primary expenditures continues to be negative, even though the t-statistic is now only at around -1.2 to -1.3.
When the trade openness variable is used (column 5 to 7), the coefficient for globalization is less significant than in columns 2 to 4. This coincides with our findings in table 1 and can be explained by the fact that the KOF-Index is the more appropriate and more comprehensive measure. In the regressions based on the trade openness measure, the globalization coefficient is only significantly negative for industrialized countries in the model for primary education expenditures. Hence, according to this measure, globalization does not affect the share of expenditures on primary education in developed countries and the tertiary expenditure share in any of the two country groups. Finally, it should be noted that the signs and levels of significance of the remaining control variables is very similar to the results presented in the baseline estimations.
The second robustness check addresses the instruments proliferation bias problem. Rood-man (2009a) argues that when too Rood-many instruments are used Sargan and Hansen J-tests used for testing instrument validity become weak and unreliable. In tables 1 and 2 we have already addressed this issue by collapsing the instruments matrix. Another approach would be to only use the first lags as instruments. This is the approach pursued in table 3.
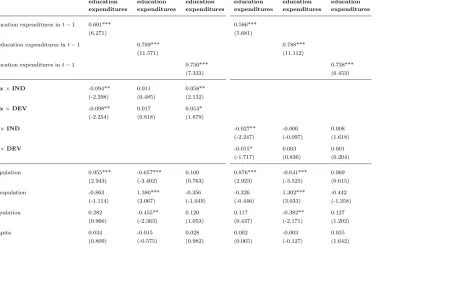
The estimation results in table 3 are based on the same models as in tables 1 and 2. With regard to the estimations using the KOF-Index, we can say that the coefficients for primary and tertiary education expenditures have the same sign and are significant both for developing and developed countries. While the size of the globalization coefficient for primary education expenditures is still at around -0.1, it is by about 50% smaller for tertiary education expenditures compared to the results in table 1. However, the coefficient is still quite large since a 10-point increase in the KOF-Index would lead to an increase in the share of higher education expenditures by 0.6 percentage points.
Table 3: Robustness check II: System GMM estimations with restricted lag length, 1992 – 2006
KOF - Globalization Index Openness (Penn World Tables)
Dependent variables: Primary Secondary Tertiary Primary Secondary Tertiary
education education education education education education
expenditures expenditures expenditures expenditures expenditures expenditures
Primary education expenditures int−1 0.601*** 0.586***
(6.271) (5.681)
Secondary education expenditures int−1 0.789*** 0.788***
(11.571) (11.112)
Tertiary education expenditures int−1 0.750*** 0.738***
(7.333) (6.453)
KOF-Index×IND -0.094** 0.011 0.058**
(-2.298) (0.485) (2.132)
KOF-Index×DEV -0.098** 0.017 0.054*
(-2.254) (0.818) (1.879)
Openness×IND -0.027** -0.000 0.008
(-2.247) (-0.097) (1.618)
Openness×DEV -0.015* 0.003 0.001
(-1.717) (0.836) (0.204)
Primary population 0.955*** -0.657*** 0.100 0.876*** -0.641*** 0.069
(2.943) (-3.402) (0.763) (2.923) (-3.525) (0.615)
Secondary population -0.863 1.380*** -0.356 -0.326 1.302*** -0.442
(-1.114) (3.067) (-1.049) (-0.446) (3.033) (-1.358)
Tertiary population 0.282 -0.455** 0.120 0.117 -0.382** 0.127
(0.966) (-2.363) (1.053) (0.437) (-2.171) (1.202)
GDP per capita 0.034 -0.015 0.028 0.002 -0.003 0.055
(0.809) (-0.575) (0.982) (0.065) (-0.127) (1.642)
Democracy -0.579** 0.145 0.191* -0.367 0.030 0.139*
(-2.103) (1.078) (1.812) (-1.607) (0.256) (1.694)
Government ideology -0.759 0.300 0.058 -0.618 0.229 -0.015
(-1.384) (0.780) (0.205) (-1.155) (0.589) (-0.055)
Observations 587 650 754 603 666 775
χ2 1560.962 2618.706 1524.013 1331.519 2528.220 1232.484
Hansen-test (p-value) 0.159 0.858 0.514 0.191 0.860 0.506
AR(1)-test (p-value) 0.003 0.001 0.000 0.003 0.001 0.000
AR(2)-test (p-value) 0.165 0.880 0.272 0.156 0.912 0.327
Number of instruments 40 48 48 40 48 48
1 Stars indicate significance levels at 10%(*), 5%(**) and 1%(***) 2 t-statistics are in parentheses 3Time fixed effects are included in all models 4 The GMM-style instruments have been restricted to the first lag 5 Hypothesis tests are based on one-step standard errors
6 p-values for the Hansen overidentification test and the Arellano-Bond AR(1) and AR(2) tests as well as the number of instruments are reported at
the bottom of the table. 7 Primary, secondary and tertiary education expenditures are measured as a share of total education expenditures
The estimation results collected in tables 1 to 3 clearly suggest that the share of higher education expenditures has increased due to globalization. Some of the estimation models, especially those in table 1, suggest that this shift in educational priorities has occurred at the expense of primary education expenditures. The effect is larger and more robust in terms of statistical significance when the KOF-Index is used as a proxy for globalization instead of the more traditional trade openness measure. This is not surprising given that the dimensions of globalization captured by globalization coincide more strongly with our theoretical considera-tions in section 3. It is obvious that an individual’s decision to emigrate or not is not affected by trade flows but rather by issues such as cultural proximity, language competencies or the difficulty of obtaining a work permit in a foreign country.
6
Conclusion
This paper analyzes whether globalization affects educational policies by studying its effect on the composition of public education expenditures. We first derived theoretically that globalization affects public education expenditures through two separate channels. On the one hand, globalization changes the returns to different types of labor. This effect provides governments with an incentive to increase expenditures for those educational programs for which returns increase more. On the other hand, globalization affects education expenditures through its effect on the equilibrium tax rate. It was, however, not possible to determine the sign of this effect analytically and to derive how globalization affectsabsolute education expenditures. However, the theoretical discussion suggested that governments will spend less on lowerrelative to higher educational programs with increasing globalization.
In a second step, we explored this hypothesis empirically with data on 121 countries over the 1992 - 2006 period. Overall, the results are fairly unambiguous, even though they are less robust when using the trade openness measure as a proxy for globalization rather than the KOF-Index. We find that globalization reduces the share of education expenditures allocated to primary education and increases the share allocated to tertiary education in both developed and developing countries. This paper therefore suggests that globalization, in the long run, increases income inequality due to its effect on educational policies.
This paper can be extended in several ways. First, one could explore whether absolute expenditures for the different educational programs have been affected by globalization. It is possible that primary education expenditures, while declining as a share of total education expenditures, have increased in absolute amount, and this might mitigate the negative dis-tributional implications to some extent. Second, the interactions between globalization and private education expenditures should be analyzed in more detail given that private educa-tional institutions play a role in many countries. Third, it might be worthwhile to analyze whether globalization has led to institutional reforms of public education systems that af-fect educational outcomes of disadvantaged children. For example, it is well known that the extent of academic tracking determines educational outcomes (Hanushek and Woessmann, 2006), and globalization may be related to such features of educational systems. Extending this paper along these lines is therefore a promising avenue for future research.
Appendix A
This appendix derives how globalization affects the domestic tax rate in equilibrium. Implic-itly differentiating equation (3.10) gives:
−dνm
dwm dwm dG − dνm dgm dgm dG + R1 0
−1bdwi
dGtνi−
1
bwi dt dGνi−(
1
bwit−πi)( dνi dwi dwi dG + dνi dgi dgi dG) +(−1bwidGdt + (1−t)dwdGi + 1bdGdx)νi
di= 0.
Appendix B
Table 4: Definitions and Sources of Variables
VARIABLE DESCRIPTION SOURCE
Dependent variables
Primary education Primary education expenditures as a share of total
expenditures public expenditures on education
Secondary education Secondary education expenditures as a share of total World Bank Edstats expenditures public expenditures on education database
Tertiary education Tertiary education expenditures as a share of total expenditures public expenditures on education
Proxies for globalization
Globalization KOF-Index of globalization Dreher (2006a)
Openness (Exports + Imports / GDP) in constant prices Penn World Tables 6.3
Control variables
Primary Share of total population aged 5 to 10 years
population
Secondary Share of total population aged 11 to 15 years World Bank Edstats
population database
Tertiary Share of total population aged 16 to 24 years population
GDP per capita PPP-adjusted GDP per capita in constant prices Penn World Tables 6.3
Government Index of government ideology with respect to Own collection based on ideology economic policy (left-wing = 1, else = 0) DPI (Beck et al., 2001)
Democracy Index of political rights scaled from 1 = most free
Table 5: Summary Statistics
Variable Mean Minimum Maximum Std. dev. Observations
Primary education Overall 32.5 9.28 74.36 11.49 603
expenditures Between 14.68 69.47 11.95 97
Within 16.13 50.95 4.09 6.22
Secondary education Overall 35.24 1.9 73.12 10.51 666
expenditures Between 2 68.14 11.13 101
Within 7.78 51.57 4.47 6.59
Tertiary education Overall 19.3 2.67 36.82 6.86 775
expenditures Between 5.15 34.81 6.58 112
Within 2.49 35.34 3.3 6.92
KOF-Index Overall 63.38 22.57 92.14 15.96 798
Between 27.82 90.89 15.22 116
Within 41.48 76.93 4.93 6.88
Economic openness Overall 81.83 16.64 328.81 41.68 821
Between 22.9 311.65 43.17 121
Within 27.49 140.01 12.38 6.79
Primary population Overall 13.09 6 22.38 4.68 821
Between 6.76 21.7 4.64 121
Within 8.19 18.42 0.89 6.79
Secondary population Overall 7.29 3.78 11.58 2.05 821
Between 4.12 11.15 2.01 121
Within 5.95 8.95 0.37 6.79
Tertiary population Overall 15.29 9.05 22.89 2.87 821
Between 10.33 21.84 2.68 121
Within 11.76 18.4 0.81 6.79
GDP per capita Overall 13.95 0.59 47.25 11.14 821
Between 0.62 42.9 10.58 121
Within 1.54 24.49 2.15 6.79
Government ideology Overall 0.35 0 1 0.48 821
Between 0 1 0.4 121
Within -0.55 1.24 0.3 6.79
Democracy Overall 2.84 1 7 2.12 821
Between 1 7 2.11 121
Within 0.34 6.34 0.51 6.79
1The number of observations is larger than in tables 1 to 3 because the regressions use lags.
2Note that the number of countries for which data is available differs between the three expenditure categories.
Table 6: Countries included in the sample
Argentina Greece (I) Norway (I) Australia (I) Guatemala Oman Austria (I) Guinea Pakistan
Azerbaijan Guyana Panama
Bahrain Hungary (I) Paraguay Bangladesh Iceland (I) Peru
Barbados India Philippines
Belarus Indonesia Poland (I) Belgium (I) Iran Portugal (I) Belize Ireland (I) Romania
Bolivia Israel Russia
Brazil Italy (I) Samoa
Bulgaria Jamaica Saudi Arabia
Burundi Japan (I) Senegal
Cambodia Jordan Singapore
Cameroon Kazakhstan Slovak Republic (I)
Canada (I) Kenya Slovenia
Cape Verde Korea, Republic of (I) South Africa
Chad Kuwait Spain (I)
Chile Kyrgyzstan Sri Lanka
China Laos St. Lucia
Colombia Latvia Swaziland
Congo, Republic of Lebanon Sweden (I)
Costa Rica Lesotho Syria
Cote d‘Ivoire Lithuania Tajikistan
Cuba Macedonia Thailand
Cyprus Madagascar Togo
Czech Republic (I) Malawi Trinidad & Tobago Denmark (I) Malaysia Tunisia
Dominican Republic Maldives Turkey (I) Ecuador Mauritania Ukraine
Egypt Mauritius United Arab Emirates El Salvador Mexico (I) United Kingdom (I) Eritrea Mongolia United States (I)
Estonia Morocco Uruguay
Ethiopia Namibia Vanuatu
Fiji Nepal Venezuela
Finland (I) Netherlands (I) Vietnam France (I) New Zealand (I) Zambia Gambia, The (I) Nicaragua
Germany (I) Niger
1 This table lists all countries that are included in at least one of the estimated models. 2 Countries classified as “industrialized” are indicated with an “I” in parentheses (see
References
Aizenman, J. and Y. Jinjarak (2009). Globalisation and Developing Countries - A Shrinking Tax Base? Journal of Development Studies 45(5), 653–671.
Anderson, F. and K. A. Konrad (2003). Human Capital Investment and Globalization in Extortionary States. Journal of Public Economics 87(7-8), 1539–1555.
Ansell, B. W. (2008). Traders, Teachers, and Tyrants: Democracy, Globalization, and Public Investment in Education. International Organization 62(2), 289–322.
Avelino, G., D. S. Brown, and W. Hunter (2005). The Effects of Capital Mobility, Trade Openness, and Democracy on Social Spending in Latin America, 1980 - 1999. American Journal of Political Science 49(3), 625–641.
Birdsall, N. (1996). Public Spending on Higher Education in Developing Countries: Too Much or Too Little? Economics of Education Review 15(4), 407–419.
Black, D. (1948). On the Rationale of Group Decision-Making. Journal of Political Econ-omy 56(1), 23–34.
Blanden, J. and S. Machin (2004). Educational Inequality and the Expansion of UK Higher Education. Scottish Journal of Political Economy 51(2), 230–249.
Blundell, R. and S. Bond (1998). Initial Conditions and Moment Restrictions in Dynamic Panel Data Models. Journal of Econometrics 87(1), 115–143.
Blundell, R. and S. Bond (2000). GMM Estimation with Persistent Panel Data: An Appli-cation to Production Functions. Econometric Reviews 19(3), 321–340.
Braumoeller, B. F. (2004). Hypothesis Testing and Multiplicative Interaction Terms. Inter-national Organization 58(4), 807–820.
Busemeyer, M. R. (2007). Social Democrats and Education Spending: A Refined Perspective on Supply-Side Strategies. Max Planck Institute for the Study of Societies Working Paper No. 02/07, 1–25.
Carnoy, M. (1992). The Case for Investing in Basic Education. UNICEF, New York.
Carnoy, M. (1999). Globalization and Educational Reform: What Planners Need to Know. Re-trieved from http://unesdoc.unesco.org/images/0012/001202/120274e.pdf, UNESCO In-ternational Institute for Educational Planning, Paris.
Congleton, R. D. and R. W. Bennett (1995). On the Political Economy of State Highway Expenditures: Some Evidence of the Relative Performance of Alternative Public Choice Models. Public Choice 84(1-2), 1–24.
Congleton, R. D. and W. F. Shughart (1990). The Growth of Social Security: Electoral Push or Political Pull? Economic Inquiry 28(1), 109–132.
Docquier, F. and A. Marfouk (2006). International Migration by Educational Attainment,1990 - 2000. In C. ¨Ozden and M. Schiff (Eds.),International Migration, Remittances, and Brain Drain, pp. 151–196. Washington, D. C.: The World Bank.
Dollar, D. (2005). Globalization, Poverty, and Inequality Since 1980. World Bank Research Observer 20(2), 145–175.
Downs, A. (1957). An Economic Theory of Democracy. Boston, MA: Harper and Row. Dreher, A. (2006a). Does Globalization Affect Growth? Evidence from a New Index of
Globalization. Applied Economics 38(10), 1091–1110.
Dreher, A. (2006b). The Influence of Globalization on Taxes and Social Policy: An Empirical Analysis for OECD Countries. European Journal of Political Economy 22(1), 179–201. Egger, P. and D. M. Radulescu (2009). The Influence of Labour Taxes on the Migration of
Skilled Workers. World Economy 32(9), 1365–1379.
Feenstra, R. C. and G. H. Hanson (1999). The Impact of Outsourcing and High-Technology Capital on Wages: Estimates for the United States, 1979 - 1990. Quarterly Journal of Economics 114(3), 907–940.
Goldberg, P. K. and N. Pavenik (2007). Distributional Effects of Globalization in Developing Countries. Journal of Economic Literature 45(1), 39–82.
Green, A. (1999). Education and Globalization in Europe and East Asia: Convergent and Divergent Trends. Journal of Education Policy 14(1), 55 – 71.
Grogger, J. and G. H. Hanson (forthcoming). Income Maximization and the Selection and Sorting of International Migrants. Journal of Development Economics.
Hansen, W. L. and B. A. Weisbrod (1969). Benefits, Costs, and Finance of Public Higher Education. Chicago, IL: Markham Publishing.
Haupt, A. and E. Janeba (2009). Education, Redistribution, and the Threat of Brain Drain.
International Tax and Public Finance 16(1), 1–24.
Hines, J. R. and L. H. Summers (2009). How Globalization Affects Tax Design. In J. R. Brown and J. M. Poterba (Eds.), Tax Policy and the Economy, pp. 123–157. Chicago, IL: University of Chicago Press.
James, J. (2002). Information Technology, Transaction Costs and Patterns of Globalization in Developing Countries. Review of Social Economy 60(4), 507–519.
Judson, R. A. and A. L. Owen (1999). Estimating Dynamic Panel Data Models: A Guide for Macroeconomists. Economics Letters 65(1), 9–15.
Lassibille, G. and B. Rasera (1998). UNESCO Technical Reference Manual: Statistical Infor-mation System on Expenditure in Education (SISEE).
Lockheed, M. E. and A. Verspoor (1991).Improving Primary Education in Developing Coun-tries. Oxford, UK: Oxford University Press.
McNeely, C. L. (1995). Prescribing National Education Policies: The Role of International Organizations. Comparative Education Review 39(4), 483–507.
Naidoo, R. and I. Jamieson (2005). Knowledge in the Marketplace: The Global Commod-ification of Teaching and Learning in Higher Education. In P. Ninnes and M. Hellst´en (Eds.),Internationalizing Higher Education: Critical Explorations of Pedagogy and Policy, pp. 37–51. Dordrecht: Springer.
Nannestad, P. and M. Paldam (1994). The VP-Function: A Survey of the Literature on Vote and Popularity Functions After 25 Years. Public Choice 79(3-4), 213–245.
Nickell, S. J. (1981). Biases in Dynamic Models with Fixed Effects. Econometrica 49(6), 1417–1426.
Poole, K. T. and R. S. Daniels (1985). Ideology, Party and Voting in the US Congress, 1959 - 1980. American Political Science Review 79(2), 373–399.
Poutvaara, P. (2008). Public Education in an Integrated Europe: Studying to Migrate and Teaching to Stay? Scandinavian Journal of Economics 110(3), 591–608.
Psacharopoulos, G. (1985). Returns to Education: A Further International Update and Implications. Journal of Human Resources 20(4), 583–604.
Roodman, D. (2009a). A Note on the Theme of Too Many Instruments. Oxford Bulletin of Economics and Statistics 71(1), 135–158.
Roodman, D. (2009b). How To Do xtabond2: An Introduction to ”Difference” and ”System” GMM in Stata. Stata Journal 9(1), 86–136.
Schulze, G. G. and H. W. Ursprung (1999). Globalization of the Economy and the Nation State. World Economy 22(3), 295–352.
Schwarz, P. (2007). Does Capital Mobility Reduce the Corporate-Labor Tax Ratio? Public Choice 130(3-4), 363–380.
Spring, J. (2008). Research on Globalization and Education. Review of Educational Re-search 78(2), 330–363.
Windmeijer, F. (2005). A Finite Sample Correction for the Variance of Linear Efficient Two-Step GMM Estimators. Journal of Econometrics 126(1), 25–51.
W¨alde, K. (2000). Egalitarian and Elitist Education Systems as the Basis for International Differences in Wage Inequality. European Journal of Political Economy 16(3), 445–468. Zodrow, G. and P. Mieszkowski (1986). Pigou, Tiebout, Property Taxation, and the