Analysis of MPC Image Compression using
DCT 2 in Matlab
C.Rajeswari
S.Babu
P.Venkatesan
Research Scholar Asst .Professor Asst .Professor Department of CSA, Department of CSA, Department of ECE, SCSVMV University SCSVMV University SCSVMV University Enathur, Kanchipuram Enathur, Kanchipuram Enathur, Kanchipuram
ABSTRACT
Image compression is to reduce irrelevance data and redundancy of the image data in order to be able to store or transmit data in an efficient form. Image compression scheme either be in lossy method or lossless method. Lossy algorithms are especially suitable for transmit images across the network with minor (sometimes imperceptible) loss of fidelity of information.
In this work, propose MPC (Maximum PSNR using Coefficient) using DCT algorithm for image compression and reconstruction taking benefit from the advantages of DCT algorithms. The algorithm performs the Discrete Cosine Transform (DCT) on the coefficients. The objective of the proposed system to study how the image is compressed using MPC method and discrete cosine transforms to attain maximum PSNR value. To attain maximum PSNR value, using coefficient, the images are analyzed and get compressed image with good quality. Coefficient reads the index of RGB values of given input image and processing that image in iteration manner. Coefficient is the most important factor that affects the image quality. Using Coefficients in Matlab, the images are analyzed and get maximum PSNR value is attained.
Keywords
PSNR, MPC, Discrete Cosine Transform, Coefficient, Matlab.
1.
INTRODUCTION
1.1
Background of the Study
Image compression can benefit users by having pictures load faster and web pages use up less space on a Web host. Image compression does not reduce the physical size of an image but instead compresses the data that makes up the image into a smaller size. The process of DCT encoding as follows: Original image (for example 256X256) is divided into 8x8 blocks. Subtract each element of matrix from 128(2n-1 bits). Name it M. Calculate the matrix multiplication as D= T * M * T` Where T is 8X8 DCT matrix. Round off nearest integer value of D. Performing Quantization as Q = D / q where q is the constant value of the Quantization matrix. Mostly q50 is used. Round off the nearest integer values and name it Q. Read all values using zigzag scan order. The process of DCT decoding as follows: Iteration starts with quantization matrix q and matrix Q. Find the value of R = Q * q. Obtain the inverse DCT function using IDCT formula, R1=IDCT[R] Round off the values of R1 and name it again R1. Add the value 128 to
every value of R1 and name it R. R = R1 + 128. At last get the original matrix.
1.2
Research Question
The question of the focused research is “How does the coefficient factor using MPC method affect the image quality?”
1.3 Objective of Study
The objective of this research to study how the image is compressed using MPC method with coefficient factor. Here coefficient is the most important factor that affects the image quality. Coefficients are used to get the clear image for looping iteration. It reads the index values of RGB of given input image and processing that value in for loop. The images are analyzed using Matlab software. The objective of research
Compare the images using existing PSNR values. Our goal is to reach the maximum PSNR value with
good compressed image quality.
2.
REVIEW OF LITERATURE
performs the DCT on the lowest level DWT coefficient. DCT took advantage of redundancies of the data by grouping pixels with similar coefficient. Harjeetpal Singh, Punjab Technical University, 2012, the research is focused on combined lossy and lossless techniques. DCT and DWT techniques were implemented. And also introduce Huffman coding. The performance analysis on several images shows that the hybrid algorithm achieved the higher compression ratio and better PSNR value. Chandan Rawat and SukadevMeher, 2011, in his study based on hybrid techniques using DCT and fractal image compression. To overcome blocking artifacts and to compress the image efficiently, use DCT and Fractal image compression technique is proposed. DCT is to compress the color image while fractal image compression is employed compressions of analogous blocks. Analogous blocks are measure by Euclidean distance. R.Uma, 2011, in her study based on fast 2-D DCT algorithm hardware implementation in which the number of multiplication is reduced to 50% of the conventional row-column approach. The DCT processor saves hardware using module reusability concept and achieves high performance. Power analysis is analyzed using CADENCE tool. The image coefficients are obtained by using MATLAB and are applied as inputs to DCT core. The DC and AC coefficients are determined through the proposed system and result is stored in RAM. Tomas FRYZA, Stanislav HANUS, 2003, in his study based on implementation of the Discrete Cosine Transform (DCT) algorithm to MATLAB. This approach is used in JPEG or MPEG standards for instance. The substance of these specifications is to remove the considerable correlation between adjacent picture elements. This paper is not to improve the DCT algorithm itself, but to re-write it to the preferable version for MATLAB thus allows the enumeration with insignificant delay. The method proposed in this paper allows image compression calculation almost two hundred times faster compared with the DCT definition. Nageswara Rao Thota, Nalanda Institute of Engineering and Technology, 2008, in his study based on the lossy compression techniques have been used, where data loss cannot affect the image clarity in this area. JPEG is a still frame compression standard, which is based on, the Discrete Cosine Transform and it is also adequate for most compression applications. This paper is a project which successfully implemented the JPEG image compression. One of the main problems and the criticism of the DCT is the blocking effect. The problem with these blocks is that when the image is reduced to higher compression ratios, these blocks become visible. This has been termed as the blocking effect. This image is compressed using 8x8 blocks and only 4 coefficients are retained. The blocking effect is very prominent in this image. Anton Obukhov, 2008, research paper which successfully implemented the JPEG image compression. One of the main problems and the criticism of the DCT is the blocking effect. The problem with these blocks is that when the image is reduced to higher compression ratios, these blocks become visible. This has been termed as the blocking effect. This image is compressed using 8x8 blocks and only 4 coefficients are retained. The blocking effect is very prominent in this image. In this paper proposed two new approaches to calculation of the discrete cosine transform for 8x8 blocks with NVIDIA CUDA technology. CUDA provides a natural way of shifting DCT8x8 computation to GPU. Both approaches were implemented for CPU and GPU. The GPU implementations utilize DCT8x8 separability on high-level, which yields the significant performance boost even compared to a modern CPU. The proposed approaches are illustrated using the sample code that performs parts of JPEG compression and decompression
3.
METHODOLOGY
3.1 Proposed MPC (Maximum PSNR using
Coefficient) Method
The process of compression and decompression of MPC method illustrates in Figure 1 as follows:
.
Figure 1
The proposed MPC method as follows:
Read the input image using imread function. It checks whether input image as RGB or gray scale
image.
It reads the individual RGB values of given image. Applying DCT2 algorithm, to these values. Square these values and sort out the linear order. The index value of given image is stored in variable. Using coefficient all these variables are processed in
iteration.
After that IDCT2 algorithm is applied to these index variables.
All individual RGB values are grouped together.
Finally, compressed image with high PSNR value is attained3.2
Coefficient
Quantization and Simulation etc. is analyzed in the existing papers. But I proposed coefficient with DCT techniques in this paper. Coefficient is most important factor that affects the image quality in this paper. Coefficient is used to process the index value of RGB values in iterative manner.Whatever coefficient value increases, the image quality is also increased. In this paper coefficient read the red, green and blue values of index of an input image. Using coefficient, the pixel values of input image is sorted using sort function and indexed value of sorting is reversed using flipud function. The individual Red value is read from double(red(:,:,1)). Similarly read green and blue value also. After applying coefficient all RGB values is grouped together and displayed using imshow() function.
3.3
Matlab
MATLAB is a high-level language and interactive environment for numerical computation, developing algorithm, visualization, and programming utilities. The whole part of input image is processed using Matlab is the main benefit in Matlab. Many of the inbuilt function are available in Matlab. Lot of toolboxes, different applications like Image Processing, Matlab for Java, Matlab for DotNet etc. is available in Matlab. The whole input image is tested using MatlabR2007 software.
3.4
PSNR
PSNR is commonly used to measure the quality of reconstruction of lossy compression images. PSNR ranges between 30dB and 50dB. PSNR value is derived from mean squared error (MSE) value. The mean square error (MSE) between the original image I(i,j) and the reconstructed image K(i,j) is,
MSE=1/mn ∑∑[I(i,j)-K(i,j)]2 where i=0 to m-1 and j=0 to n-1 The PSNR is defined as:
PSNR= 20 log 10 (MAXI)- 10 log 10(MSE) Where MAXI =2
n
MAXI=255 for n=8 bits Read the
i/p image imread(in )
Isr gb( )
Isa(u int8)
Isgr ay()
Isa(ui
nt16) Isa(d
ouble )
r=d(ip(:,:,1)
dr=dct2(red )
Sqr the red values
linear order
Sort and indexvalue
Flipud(indx )
i=1 to coef fcoeff
Ir= red(r(i))
Group RGB values Inverse idct2(ir)
Get o/p image
4.
RESULTS AND DISCUSSIONS
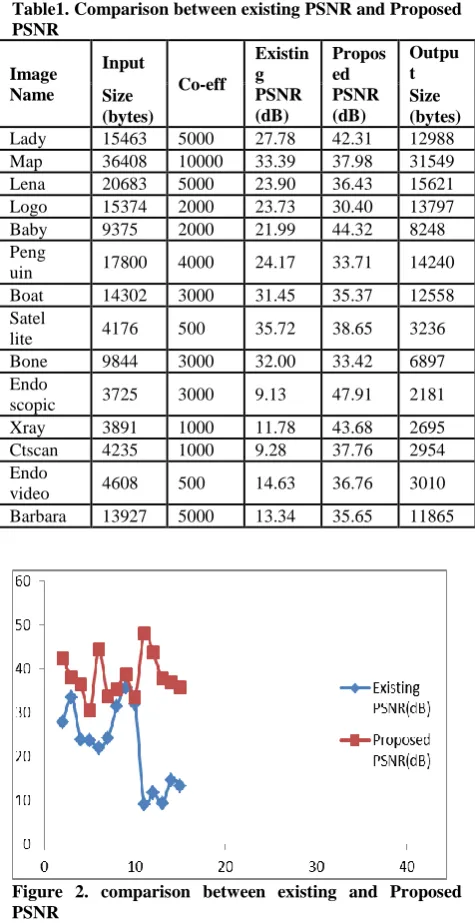
The different images from different research papers are taken and analyzed using Matlab. The results are shown in Table1. From this analysis maximum PSNR value is attained from existing results. All images are taken from the existing research papers with PSNR value. The existing images are tested using quantization, simulation, threshold method etc. From these results comparative study of existing PSNR and proposed PSNR is produced is shown in Figure2.
Table1. Comparison between existing PSNR and Proposed PSNR
Image Name
Input
Co-eff
Existin g PSNR (dB)
Propos ed PSNR (dB)
Outpu t Size
(bytes)
Size (bytes)
Lady 15463 5000 27.78 42.31 12988 Map 36408 10000 33.39 37.98 31549 Lena 20683 5000 23.90 36.43 15621 Logo 15374 2000 23.73 30.40 13797
Baby 9375 2000 21.99 44.32 8248
Peng
uin 17800 4000 24.17 33.71 14240
Boat 14302 3000 31.45 35.37 12558 Satel
lite 4176 500 35.72 38.65 3236
Bone 9844 3000 32.00 33.42 6897
Endo
scopic 3725 3000 9.13 47.91 2181
Xray 3891 1000 11.78 43.68 2695
Ctscan 4235 1000 9.28 37.76 2954 Endo
video 4608 500 14.63 36.76 3010
Barbara 13927 5000 13.34 35.65 11865
Figure 2. comparison between existing and Proposed PSNR
The main concept of compression is to reduce memory size and to keep the image quality. The output memory size is also reduced is shown in Figure 3.
Figure 3. Comparison between Input image and Output image size in bytes
All images are taken from the existing research papers with
PSNR value. These input images are tested using quantization, simulation, threshold method etc. One of input image Boat.jpg is tested in Matlab and produced compressed output image is shown in Figure4 (a) & (b).Figure 4 (a). Boat.jpg input image
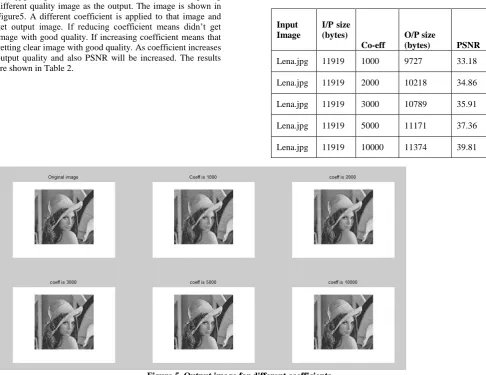
[image:4.595.48.286.200.662.2] [image:4.595.351.536.309.433.2]Coefficient is most important factor in this paper. For example Lena.jpg image is tested with different coefficient and getting different quality image as the output. The image is shown in Figure5. A different coefficient is applied to that image and get output image. If reducing coefficient means didn’t get image with good quality. If increasing coefficient means that getting clear image with good quality. As coefficient increases output quality and also PSNR will be increased. The results are shown in Table 2.
[image:5.595.58.545.92.467.2]Table2. Coefficient increases as well as PSNR increases
Figure 5. Output image for different coefficients
In DCT technique it is based on the
quantization and mathematical cosine formulae ism applied to image. With these factors adding coefficient to get the maximum PSNR value. Here RGB image and gray scale image is tested using these coefficients. Minimum bytes image is tested and maximum bytes image is also tested. Whatever may be getting output compressed image is clear. And getting output image with quick response time.As the input image of Lena.jpg is tested in Matlab, the results shown in Figure 5. The output image quality depends on the coefficient factor. The output image is moderate for coefficient is 1000. The output image is clear for coefficient is below 3000. The output image is very clear for coefficient is greater than or equal to 5000. Corresponding coefficients, getting different PSNR values. The result is
produced in Table 2.
5.
CONCLUSION
The study has focused to reach the maximum PSNR value applying coefficients and DCT technique in Matlab. And also the memory size is reduced of an output image. By increasing coefficient value, the image quality will be increased. Coefficient is most important factor in output image quality. Finally, our goal is to maximum PSNR value with coefficients are achieved.
The research work is focused to how the image is compressed using coefficient factor without losing quality. It is concluded that running time depends on the coefficient
factor. Because coefficient is process in iteration. By increasing coefficient, running time is slightly increases.
6.
REFERENCES
[1] PrabhakarTelagarapu, A.LakshmiPrasanthi, G.VijayaSanthi, 2011, VI: 4-No.3,” Image Compression Using DCT and Wavelet Transformation” IJSIP.
[2] Anilkumar Katheritiya, Swati Patel, Mahesh Goyani, 2011, VI: 1-No: 2, Comparative Analysis between DCT & DWT Techniques of Image Compression”, IJEA.
[3] KiranBindu, 2012, “A Hybrid Image Compression Scheme Using DCT and Fractal Image Compression”, Himachal Pradesh University, IJORCS, pp-37-42.
[4] Maneesha Gupta, Dr.Ameet Kumar Garg, 2012, “Analysis of Image Compression Algorithm Using DCT”, pp. 515-521.
[5] Er.Ramandeep, 2012 , “ Image Compression Using Discrete Cosine Transform and Discrete Wavelet Transform”, ISSN: 2229-6166
Input Image
I/P size (bytes)
Co-eff
O/P size
(bytes) PSNR
[6] Harjeetpal singh, Sakhi Sharma, 2012, “Hybrid Image Compression Using DWT, DCT & Huffman Encoding Techniques”, Vol.No.2, IJETAE, Punjab Technical University.
[7] ChandanRawat, SukadevMeher, 2011, “A Hybrid Image Compression Scheme Using DCT and Fractal Image Compression” IAJIT
[8] R.Uma, 2011, “FPGA Implementation of 2-D DCT for JPEG Image Compression”, IJAEST, Vol.No.7, Issue No.1, 001-009.
[9] T.Fryza, S.Hanus, 2003, “Image Compression Algorithms Optimized for MATLAB” Vol.12 No.4 [10] NageswaraRaoThoto, 2008, “Image Compression
Using Discrete Cosine Transform” Nalanda Institute of Engineering & Technology.
[11] Anton Obukhov, Alexander Kharlamov, 2008, “Discrete Cosine Transform for 8x8Blocks with CUDA”
[12] N S T Sai, R C Patil, 2012, “Impact on Image Retrieval with Successive Truncation of DCT” Vol.
2– No.1 IJAISISSN: 2249-0868, NMIMS University.
[13] Meena B. Vallakati1 and Dr. R. R. Sedamkar, 2012, “Low Complexity DCT-based DSC approach for Hyper spectral Image Compression with Arithmetic Code” IJCSI, Vol. No.9, Issue 5, Thakur college of Engineering and Technology.