Copyright © 1998, American Society for Microbiology. All Rights Reserved.
Comparison of Two Measures of Human Immunodeficiency
Virus (HIV) Type 1 Load in HIV Risk Groups
CYNTHIA M. LYLES,1* DAVID VLAHOV,1HOMAYOON FARZADEGAN,1JACQUIE ASTEMBORSKI,1
JOSEPH B. MARGOLICK,2BETH A. MASTERS,1JENNIFER SCHROEDER,1 ANDTHOMAS C. QUINN3,4
Departments of Epidemiology1and Molecular Microbiology and Immunology,2The Johns Hopkins School of Hygiene
and Public Health, and Department of Medicine, The Johns Hopkins School of Medicine,3Baltimore,
Maryland, and National Institute of Allergy and Infectious Disease, Bethesda, Maryland4
Received 6 May 1998/Returned for modification 8 July 1998/Accepted 14 September 1998
Levels of viral burden were compared across risk group and gender populations among 485 human immu-nodeficiency virus type 1 (HIV-1)-infected participants consisting of 190 male injection drug users (IDUs), 92 female IDUs, and 203 homosexual men. Viral burden was quantified by a microculture technique to determine
cell-associated infectious units per 106peripheral blood mononuclear cells (IUPM) and by reverse
transcrip-tase PCR (Amplicor) to determine plasma HIV RNA levels. Adjusting for CD41cell count, females had a lower
infectious HIV load than all males combined (0.33 log10lower; P50.004), and homosexual men had a 0.29
log10higher infectious viral load than all IDUs combined (P50.001). For HIV RNA levels, females had lower
levels than males (0.19 log10lower; P50.04), but no differences were observed by risk group. After controlling
for percent CD41cells, no differences were found by risk group for either assay, but females still had a 0.25
log10lower infectious viral load than males (P50.04) and a viral RNA load similar to that of males (P50.25).
The correlation between infectious viral load and HIV RNA load was 0.58 overall, which did not differ by gender or risk group. Our data suggest that differences in viral load may exist by gender and that any differences
observed by risk group are driven predominantly by gender or percent CD41cell differences. These data also
confirm a moderate correlation between cell-associated infectious viral load and plasma HIV RNA load, which appears to be similar by gender and across risk groups.
On the basis of numerous studies recently showing the pre-dictive value of human immunodeficiency virus (HIV) type 1 (HIV-1) load on disease progression (9, 13, 14, 17, 26), viral loads are currently used in combination with CD41cell count
to estimate the stage of disease and guide therapeutic deci-sions. Most studies of viral load have been based on viral loads in white homosexual men (HM) (13, 14), African-American injection drug users (26), or hemophiliacs (16). Studies which have evaluated viral load among heterogeneous populations are sparse. One study which included multiple risk groups but which consisted of predominantly white HM suggested that higher viral loads exist among males, among HM, and among non-drug users (9).
Use of the total number of copies of HIV-1 RNA per ml of plasma to measure viral burden includes all viral RNA parti-cles regardless of the level of infectivity. In contrast, the cell-associated infectious HIV-1 load, measured by the quantitative microculture assay, measures biologically functional and infec-tious cell-associated virus, i.e., the amount of cell-associated HIV-1 capable of infecting donor cells from an uninfected person by a coculture technique. Two recent studies have com-pared the two assays and showed the correlation to range from 0.52 to 0.54 (10, 18). These studies mostly consisted of white HM, and it is unclear whether these two virologic measure-ments correlate equally among the different risk and gender groups.
For these reasons we compared the levels of HIV-1 RNA in the plasma and the cell-associated infectious HIV-1 loads in
the peripheral blood between HIV-1-infected male and female injection drug users (IDUs) and HM, while at the same time we evaluated the relationship between these two virologic mea-sures.
MATERIALS AND METHODS
Study population. Participants in this study were IDUs in the Baltimore, Maryland-based AIDS Link to Intravenous Experiences (ALIVE) study or HM in the Study to Help the AIDS Research Effort (SHARE) study, which is the Baltimore site of the Multicenter AIDS Cohort Study. Both cohorts were re-cruited to study the natural history of HIV disease and to screen for new HIV infections. The designs of these cohort studies have been described elsewhere (8, 25). The ALIVE participants were actively recruited through community out-reach programs between February 1988 and March 1989, whereas the Multi-center AIDS Cohort Study-SHARE participants were recruited in 1984. The IDUs were predominantly black individuals of lower socioeconomic status who were actively injecting drugs (25), whereas the HM were predominantly white individuals of middle to upper socioeconomic status (8). All were required to be
$18 years of age, to be AIDS free at entry, and to consent to participation. In addition, IDUs were required to have a history of injection drug use since 1977. Both ALIVE and SHARE study participants had been followed semiannually from the time of study enrollment through the present. Follow-up consisted of screening for HIV seroconversion among HIV-seronegative individuals and a detailed clinical-immunological evaluation of HIV-seropositive individuals.
Participants from ALIVE and SHARE seen at a regular semiannual visits between February 1992 and January 1994 were selected for the current substudy on the basis of HIV-1 serologic status, gender, and CD41cell count. All HIV-1-seropositive women IDUs from ALIVE and subjects from both ALIVE and SHARE who seroconverted since enrollment were eligible. In addition, a strat-ified sampling scheme was implemented to recruit roughly equal proportions of HIV-1-seroprevalent (seropositive at enrollment) male participants at different disease stages marked by a CD41cell count of,200, 200 to 499, or$500/ml at their most recent visit prior to 1992. The oversampling of women and serocon-verters was to provide adequate numbers for group comparisons, and the strat-ified sampling of seroprevalent participants was to ensure an adequate mixture of participants at various disease stages.
Data collection.During the regular semiannual follow-up visits in the respec-tive outpatient clinics, the HIV-infected participants in both study populations underwent interviews and physical examination and had blood drawn for T-cell
* Corresponding author. Mailing address: Department of Epidemi-ology, The Johns Hopkins University, 615 North Wolfe St., E6003, Baltimore, MD 21205. Phone: (410) 955-3114. Fax: (410) 955-1383. E-mail: [email protected].
3647
on May 15, 2020 by guest
http://jcm.asm.org/
subset studies. Additional aliquots of plasma were stored in heparinized tubes at 270°C for future studies. The data collected included detailed information on demographics, medical history, illicit drug use, and sex practices during the previous 6 months. Separate consents were obtained to secure the release of medical information. An additional 10 ml of heparinized blood was drawn for cell-associated infectious HIV-1 load quantification at each visit during the 2-year recruitment period of this substudy. Only the first infectious HIV-1 load measurement was considered in this analysis. Plasma HIV RNA levels were later quantified at the same visit as the initial infectious HIV load measurement, when frozen plasma was available.
Laboratory methods.Antibodies to HIV-1 were measured with a commer-cially available enzyme-linked immunosorbent assay kit (Genetic Systems, Seat-tle, Wash.), and the results for repeatedly positive specimens were confirmed by Western blotting (Dupont, Wilmington, Del.). Measurement of T-cell subsets was performed in one laboratory by flow cytometry according to a whole-blood staining method, which has been described previously (7, 12), and absolute counts were determined by obtaining an automated complete blood count and differential.
Levels of cell-associated infectious HIV-1 were measured in fresh peripheral blood specimens by quantitative microculture techniques (QMCs) as described elsewhere (5, 23). Briefly, 106peripheral blood mononuclear cells (PBMCs) were diluted (fivefold) five times and were added in duplicate to 24-well microculture plates containing phytohemagglutin-P-activated normal PBMCs. Cultures were fed on day 7, and the HIV p24-antigen level was measured on day 14. The number of infectious units per 106PBMCs (IUPM) was determined by algorithm on the basis of the number of p24-positive (concentration for positivity,.30 pg/ml) wells (15). On the basis of 115 pairs of assays from 38 laboratories participating in a Virology Quality Assurance Program, this technique was esti-mated to have a median intraassay standard deviation of log10IUPM of 0.39 (2). Plasma HIV RNA levels were quantified by the reverse transcriptase PCR (RT-PCR) Amplicor assay by Roche Molecular Systems (Branchburg, N.J.). Frozen (at270°C) plasma specimens were obtained from the repository for quantitation of viral load. RNA was extracted from heparinized samples by the use of a modification of the method of Boom et al. (1) and was quantified according to the manufacturer’s instructions, with a lower detection limit of 400 copies/ml. HIV RNA was quantified only for those subjects for whom frozen plasma was available at the same visit that the initial infectious viral load was measured.
The processing and analysis of all samples of the same type took place in the same immunologic or virologic laboratory at The Johns Hopkins School of Public Health. The virology laboratories were certified accordingly by Roche Molecular Systems or by the AIDS Clinical Trials Group according to the quantitative microculture procedures used (23). A number of variables can affect viral load assays, including sample processing, genotype, stability, reproducibility, and in-tra-assay variability. These variables have previously been addressed in a multi-center study in which our laboratory participated (11). To minimize sample variation within the Roche assay, samples were batched, thawed together, and processed by one technician by using one lot of the assay. The clade B genotype was the predominant clade of HIV-1.
Statistical methods.The analysis described here was limited to those partici-pants for whom both viral load measurements were available at the same visit. Standard summary measures were presented for both categorical and continuous variables. Univariate comparisons by population, as defined by gender and risk group, were made separately for each measure of viral load and other charac-teristics by nonparametric analysis of variance. Comparisons were also made within the following three CD41cell count categories:,200, 200 to 499, and $500 cells/ml. Linear regression models were used to compare viral loads by risk group while controlling for other potential confounders. To normalize the dis-tributions both viral load measurements were transformed on the log10scale prior to regression analyses. Observations falling below the lower detectable limit of the assay were recoded to one-half of the lower limit prior to the transfor-mation (0.2 for the QMC assay and 200 for the RT-PCR assay). Two observa-tions which had extremely influential CD41cell counts were Winsorized to the 99th percentile (1,342 cells/ml) (21).
To assess the equality in the association between HIV load and CD41cell count across the three groups, defined by gender and risk group, separate linear regression lines were fit for each risk group. The rates of change in the viral load as well as the viral load level were then compared between the risk groups. This was done separately for both viral load measures. Linear regression parameters relating the two viral load measures were also estimated for each risk group separately and were compared for equivalence. In the linear regressions de-scribed above, polynomial regression models of higher order, up to the cubic polynomial model, were also considered. In building the polynomial model, the lower-order terms were retained at each step, and the significance of each model was based on the Wald test statistic of the highest-order term and the change in the model R2. In each case, the independent variable was centered prior to calculating the higher-order terms, which eliminated collinearity problems. The linear polynomial regression model was most appropriate in all cases and thus was used throughout the analysis.
RESULTS
A total of 547 subjects (299 IDUs and 248 HM) had a cell-associated infectious HIV load measurement during the recruitment period. Of those, 485 (89%) had sufficient frozen plasma available for the HIV RNA load quantification (per-formed in 1997) at the same visit as the infectious viral load quantification. The current analysis was restricted to those 485 subjects (190 male IDUs, 92 female IDUs, and 203 HM). Comparing subjects with plasma available versus those without plasma available revealed that those excluded were mostly HM who were more likely to have had an AIDS diagnosis. This was inherent in the SHARE study design, because those with AIDS were not required to provide as much blood for repository storage.
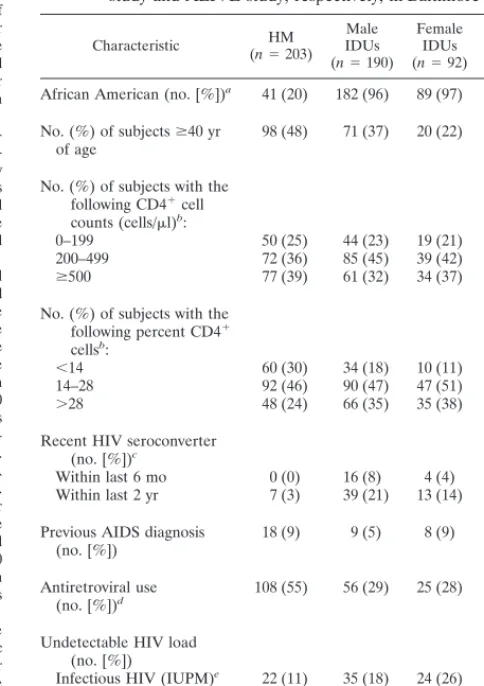
Most IDUs were African American (96%), whereas only 20% of the HM were African American (Table 1). Slightly more than one-third of the participants had CD41 cell counts of $500
cells/ml, while almost one-quarter had,200 cells/ml. Few sub-jects had previously developed AIDS (7%), while 4% were con-TABLE 1. Demographic, clinical, and laboratory characteristics of
485 HIV-infected HM and IDUs enrolled in the SHARE study and ALIVE study, respectively, in Baltimore
Characteristic (nHM5203) IDUsMale (n5190)
Female IDUs (n592)
Overall (n5485)
African American (no. [%])a 41 (20) 182 (96) 89 (97) 312 (64)
No. (%) of subjects$40 yr
of age 98 (48) 71 (37) 20 (22) 189 (39)
No. (%) of subjects with the following CD41cell counts (cells/ml)b:
0–199 50 (25) 44 (23) 19 (21) 113 (23) 200–499 72 (36) 85 (45) 39 (42) 196 (41)
$500 77 (39) 61 (32) 34 (37) 172 (36)
No. (%) of subjects with the following percent CD41 cellsb:
,14 60 (30) 34 (18) 10 (11) 104 (22)
14–28 92 (46) 90 (47) 47 (51) 229 (48)
.28 48 (24) 66 (35) 35 (38) 149 (31)
Recent HIV seroconverter (no. [%])c
Within last 6 mo 0 (0) 16 (8) 4 (4) 20 (4) Within last 2 yr 7 (3) 39 (21) 13 (14) 59 (12)
Previous AIDS diagnosis
(no. [%]) 18 (9) 9 (5) 8 (9) 35 (7)
Antiretroviral use
(no. [%])d 108 (55) 56 (29) 25 (28) 189 (40)
Undetectable HIV load (no. [%])
Infectious HIV (IUPM)e 22 (11) 35 (18) 24 (26) 81 (17)
HIV RNA (no. of
copies/ml)f 11 (5) 7 (4) 5 (5) 23 (5)
aNon-African Americans were predominantly white.
bFor four people CD41cell count and percent CD41cell information was missing.
cOn the basis of the estimated seroconversion date.
dSelf-reported use of zidovudine, dideoxyinosine, dideoxycytosine, or
stavu-dine during previous 6 months.
eAs measured by QMC assay. fAs measured by RT-PCR assay.
on May 15, 2020 by guest
http://jcm.asm.org/
[image:2.612.307.549.99.442.2]sidered recent seroconverters (estimated seroconversion date within the last 6 months). The IDUs consisted of more recent seroconverters and slightly fewer subjects with a previous AIDS diagnosis than HM. While more than half of the HM reported that they had used any antiretroviral therapy (zidovu-dine, dideoxyinosine, dideoxycytosine, or stavudine) during the prior 6 months, fewer than 30% of the IDUs reported that they had used any antiretroviral therapy. The greatest proportion of nondetectable infectious HIV-1 loads were observed among female IDUs (26%), followed by male IDUs (18%) and HM (11%). Fewer subjects (5%) had nondetectable HIV RNA loads, with similar proportions across groups.
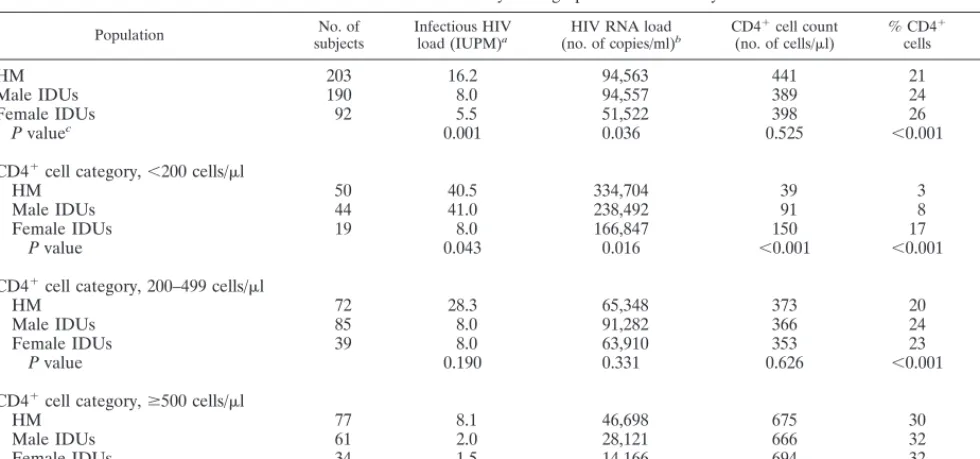
The median ages differed between the three groups (P,
0.001) (Table 2). Although the CD41cell counts did not differ
by group (P 50.525), median levels of both infectious HIV (P,0.001) and HIV RNA (P50.036) were statistically dif-ferent between the three groups. The median infectious HIV load for HM (16.2 IUPM) was twice that for the male IDUs (8.0 IUPM) and almost three times that for the female IDUs (5.5 IUPM). For HIV RNA load, HM and male IDUs had similar loads (94,563 versus 94,557 copies/ml, respectively), while the female IDUs had a median load roughly a quarter of a log lower (51,522 copies/ml). Despite similarities in CD41
cell counts, there were significant differences in median per-cent CD41cells by group (P,0.001). After stratification by
CD41cell count category, significant differences by group still
remained for age and percent CD41cells within each category,
for infectious HIV load and HIV RNA load within the cate-gories of ,200 and $500 cells/ml, and for CD41 cell count
within the category of,200 cells/ml.
The CD41-adjusted infectious HIV load was estimated to be
0.20 log10 lower among female IDUs than male IDUs (P5
0.100) and 0.25 log10higher among HM than male IDUs (P5
0.009) (Table 3). The corresponding estimated differences in HIV RNA load were 0.14 log10 lower among female IDUs
(P50.17) and 0.08 log10higher among HM (P50.29)
com-pared to those in male IDUs (Table 3). Age, AIDS status, and
[image:3.612.56.546.81.310.2]recent antiretroviral therapy were also considered and were not found to be associated with either viral load measure (data not shown). All comparisons were essentially unaltered after controlling for recent HIV seroconverter status (data not shown) or, alternatively, excluding recent HIV seroconverters (Table 3).
TABLE 2. Median levels of HIV-1 by demographic and laboratory characteristics
Population subjectsNo. of Infectious HIVload (IUPM)a (no. of copies/ml)HIV RNA loadb CD4
1cell count
(no. of cells/ml) % CD4 1
cells Age (yr)
HM 203 16.2 94,563 441 21 40
Male IDUs 190 8.0 94,557 389 24 38
Female IDUs 92 5.5 51,522 398 26 35
P valuec 0.001 0.036 0.525 ,0.001 ,0.001
CD41cell category,,200 cells/ml
HM 50 40.5 334,704 39 3 43
Male IDUs 44 41.0 238,492 91 8 39
Female IDUs 19 8.0 166,847 150 17 36
P value 0.043 0.016 ,0.001 ,0.001 ,0.001
CD41cell category, 200–499 cells/ml
HM 72 28.3 65,348 373 20 40
Male IDUs 85 8.0 91,282 366 24 38
Female IDUs 39 8.0 63,910 353 23 35
P value 0.190 0.331 0.626 ,0.001 ,0.001
CD41cell category,$500 cells/ml
HM 77 8.1 46,698 675 30 39
Male IDUs 61 2.0 28,121 666 32 37
Female IDUs 34 1.5 14,166 694 32 36
P value 0.006 0.090 0.469 0.028 0.017
aAs measured by QMC assay. bAs measured by RT-PCR assay.
cP value for overall group effect by the Kruskal-Wallis test.
TABLE 3. Difference estimates in log viral load between populations,acontrolling for CD41cell count
or percent CD41cells
Regression model
Log difference
Entire group (n5485)
Excluding recent seroconvertersb
(n5465) Infectious
HIV loadc HIV RNAloadd InfectiousHIV load HIV RNAload
Model 1
Female IDUs 20.20e 20.14 20.21e 20.16 HM 10.25f 10.08 10.22g 10.06 100-cell increase in
CD41cell count 20.15
f 20.16f 20.15f 20.15f
Model 2
Female IDUs 20.21h 20.15 20.22e 20.17 HM 10.09 20.09 10.05 20.11 10-percentage-point
increase in per-cent CD41cells
20.37f 20.37f 20.36f 20.35f
aReference population is male IDUs.
bRecent seroconverters are those whose estimated seroconversion date is
within last 6 months.
cAs measured by QMC assay (IUPM). dAs measured by RT-PCR assay (copies/ml). eP,0.1.
fP,0.01. gP,0.05. hP50.1.
on May 15, 2020 by guest
http://jcm.asm.org/
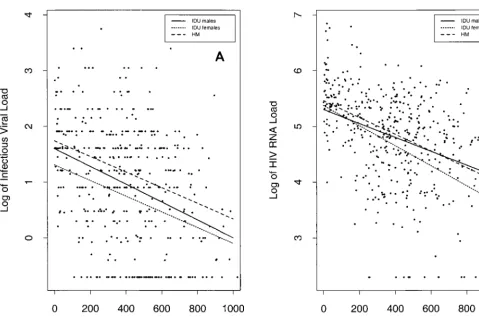
[image:3.612.307.549.472.653.2]Figure 1 graphically displays the comparisons of viral load made in Table 3 (excluding data for the 20 recent HIV sero-converters) by presenting the estimated regression lines for each population. Regarding the level of infectious virus (Fig. 1A), formal tests for interaction indicated a common slope for all three groups (P.0.5 for each comparison). As observed in Fig. 1A and previously presented in model 1 (Table 3), esti-mated levels of infectious virus are higher among HM and lower among female IDUs relative to those among male IDUs. When combining data for the groups, females had an esti-mated one-third decrease in log10infectious viral load relative
to those among males (P50.004) and HM had a higher level compared to those among IDUs (b 5 10.29; P50.001).
Slopes did not differ by group (P.0.13 for each compari-son) when relating HIV RNA load to CD41cell count (Fig.
1B). Neither female IDUs nor HM differed from male IDUs in CD41-adjusted HIV RNA load as seen here by overlapping
regression lines or in model 1 (Table 3). After pooling of the data for the groups, females had a lower level than males (b 5 20.19; P50.037), and the risk group comparison was sugges-tive of higher levels in HM versus IDUs, but the difference was not significant (b 5 10.11; P50.12).
Controlling for percent CD41cells rather than CD41cell
count reduced the estimated difference in log viral load be-tween HM and male IDUs in all comparisons to the point at which they no longer differed for infectious HIV load (P50.39 overall and P50.64 among n5465) (Table 3). The difference estimates by gender within the IDUs, however, remained es-sentially unchanged (Table 3). Again, after pooling of the data for HM and male IDUs, women had almost a quarter log10
decrease in infectious viral load compared to those for men (b 5 20.24; P5 0.036); however, levels of HIV RNA were similar by gender (b 5 20.11; P50.252).
To further explore why the difference estimates between HM and male IDUs in both viral load measures changed sub-stantially after adjusting for percent CD41cells rather than
CD41cell count, we evaluated the relationship between
per-cent CD41 cells and CD41 cell count for each group. An
increment of 100 CD41cells/ml corresponded to roughly an
increment of 3.0 CD41cell percentage points, which was
com-mon for all three groups (P.0.15 for each test). For a given CD41cell count, male IDUs and females had similar mean
percent CD41cells (P.0.5); however, HM had an estimated
4.5-percentage-point decrease in percent CD41 cells
com-pared to the percent CD41cells for IDUs combined (P,0.01)
(data not shown). Although the prevalence of smoking (87 versus 56%) and proportion of African Americans (97 versus 20%) were higher among IDUs than HM, respectively, these factors were considered and did not confound this difference (data not shown).
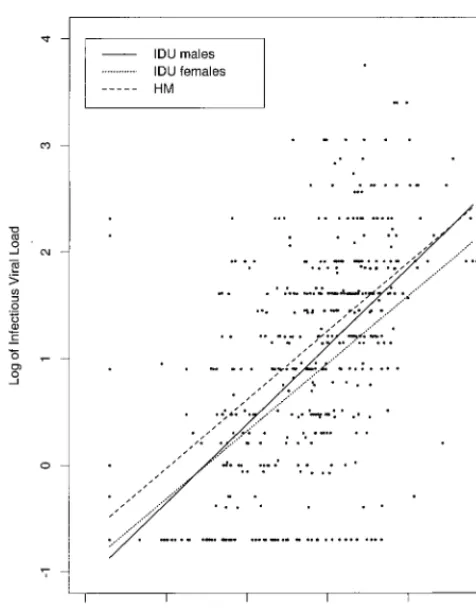
The estimated correlation between infectious viral load and HIV RNA load was 0.58 overall, 0.58 for male IDUs, 0.54 for female IDUs, and 0.59 for HM. Figure 2 presents the esti-mated regression lines relating both viral load measures for each group. The slopes did not differ by group (P.0.35 for each test), with a common slope estimate of 0.67, implying a log10 increase in HIV RNA load corresponds to roughly a
two-thirds log10increase in infectious viral load. For a given
[image:4.612.59.539.67.384.2]HIV RNA load, HM had a higher infectious viral load (b 5 10.16; P 5 0.073) and female IDUs had a lower infectious
FIG. 1. Estimated regression lines of log-based HIV load by CD41lymphocyte cell count for each population, excluding those whose estimated seroconversion date
was within 6 months of the time that the viral load was measured. The cell-associated infectious HIV-1 load (A) was measured as log IUPM, and the plasma HIV RNA concentration (B) was measured as the log number of RNA copies per milliliter.
on May 15, 2020 by guest
http://jcm.asm.org/
viral load (b 5 20.13; P50.233) compared to that for male IDUs. After combining data by gender among IDUs, the in-fectious viral load was 0.2 log10higher in HM than in IDUs
(P50.011) for any given HIV RNA load.
DISCUSSION
A major finding of this study was that female IDUs tended to have the lowest levels of both cell-associated infectious HIV load and HIV RNA load compared to those for male IDUs and HM. Borderline significant gender differences among IDUs were observed only for infectious viral load. Differences between females and all males combined, however, were found to be statistically significant for both assays and after adjusting for either CD41cell count or percent CD41cells. Although
these results are not conclusive in terms of differences by gender, they do tend to support earlier studies which indicated lower HIV RNA loads among women than men (3, 4, 9).
Katzenstein et al. (9) reported higher HIV RNA loads among homosexuals relative to those among nonhomosexuals, which consisted of mostly white males and females, after ad-justing for CD41cell count. Our data also suggested that HM
have higher viral loads than male IDUs on the basis of the results of both assays and when controlling for CD41 cell
count. However, the difference was statistically significant only for infectious HIV load. The differences were most pro-nounced when data for HM were compared to those for all nonhomosexuals. In contrast, when controlling for percent CD41cell viral loads in HM appeared to be similar to those in
male IDUs. In addition, we showed that for a given CD41cell
count, HM had a significant 4.5% decrease in percent CD41
cells relative to the percent CD41cells among IDUs,
suggest-ing that CD41cell count and percent CD41cells may not be
used interchangeably to mark the stage of disease when com-parisons are made across risk groups. Instead, percent CD41
cells may be considered a more precise measure. The possibil-ity of residual confounding from race or smoking status was considered, but these characteristics were not found to be confounders. Another explanation could be systematic labora-tory variation between laboralabora-tory studies for the two cohorts, but this is unlikely since the lymphocyte counts and T-cell subset counts were performed in the same laboratory under the same protocol for both studies.
One potential limitation of the study results from the fact that 11% of the individuals did not have available specimens for quantification of plasma HIV RNA load. These subjects were more likely to be HM who were severely immunocom-promised or who had AIDS, which would result in the obser-vation of lower than expected viral loads among HM but not necessarily among male or female IDUs. Although the differ-ence estimates by risk group may be conservative, attempts were made to control for differences by stage of HIV disease. Two recent studies demonstrated a moderate correlation (r 5 0.52 to 0.54) between cell-associated infectious HIV-1 load and plasma HIV-1 RNA levels as measured by PCR among predominantly white, homosexual, or heterosexual in-dividuals (10, 18). These results are confirmed here with a combined population consisting of a larger percentage of Af-rican-American IDUs. Our results also suggest the correlation to be similar among HM, female IDUs, and male IDUs. In addition, the increase in infectious viral load given a log in-crease in HIV RNA load was estimated to be two-thirds of a log, which was common across all three groups.
Interestingly, we also found that when the copy numbers of HIV RNA in plasma were equal, HM tended to have signifi-cantly higher infectious viral loads than IDUs. This leads to two important questions that were beyond the scope of this study: Does infectious viral load have any prognostic ability independent of HIV RNA load? If so, do these higher infec-tious viral loads among HM relative to those among IDUs trans-late to faster HIV disease progression, despite similar levels of HIV RNA? Prior to the use of HIV load as a biomarker, two early Italian HIV-1 seroconverter studies (19, 20) found simi-lar disease progression rates between HM and IDUs. Other studies (22, 24) have observed faster disease progression among the HM than among IDUs, although this was predom-inantly explained by high rates of Kaposi’s sarcoma among HM. Two recent reports compared the usefulness of cell-as-sociated infectious viral load as a predictor of HIV disease progression after adjusting for HIV RNA load within mostly white HM (6, 10). They found that when baseline virologic measures are available, infectious viral load is independently associated with disease progression, defined as a 50% decrease in the CD41 cell count, AIDS, or death (10). If data from
multiple time points are available, however, Fiscus et al. (6) show that the infectious viral load or changes in the infectious viral load are not predictive of disease progression indepen-dent of HIV RNA load, suggesting that the differences ob-served here may not necessarily relate to differential disease progression.
[image:5.612.50.288.68.373.2]This was a cross-sectional analysis with mostly HIV-sero-prevalent participants. Such an analysis has well-known limi-tations, including potential confounding due to different dura-tions of infection between genders or risk groups. It is possible that if HM were infected earlier than IDUs in Baltimore and
FIG. 2. Estimated regression lines of log-based infectious viral load, mea-sured as log IUPM, by log-based HIV RNA load, meamea-sured as log number of RNA copies per milliliter, for each population, excluding those whose estimated seroconversion date was within 6 months of the time that the viral load was measured.
on May 15, 2020 by guest
http://jcm.asm.org/
the relationship between viral load and CD41count changes
over time, then our results could reflect an epidemiologic ar-tifact rather than a basic biological difference. This could ex-plain why the risk group differences in viral load were mini-mized when controlling for percent CD41cells. In contrast,
the most consistent differences were observed by gender, even among IDUs only. Female IDUs did not appear to be more recently infected than male IDUs on the basis of the percent-age of female IDUs with AIDS and percent recent HIV sero-converters (Table 1), suggesting real biological differences.
In summary, our data support differences in HIV load by gender, measured as cell-associated viral load or level of HIV RNA in plasma, and also suggest that the differences observed between risk groups may be driven predominantly by gender, because differences among males were only minimal. In addi-tion, our data confirm the moderate correlation between cell-associated infectious HIV load and plasma HIV RNA copy numbers, which appears to be similar across both risk groups and genders.
The differences observed here, whether due to an epidemi-ologic artifact or to some biepidemi-ological mechanism, are consistent with earlier observations. While the observed associations await clarification through studies of longitudinal HIV load, the data do caution that clinical decisions related to the initiation of treatment with antiretroviral medications on the basis of a sin-gle viral load measurement need to consider the patient’s char-acteristics. To date, clinical guidelines for the initiation of an-tiretroviral therapy have been generated from data derived from mostly white HM. Additional data on other groups could help to fine-tune guidelines.
ACKNOWLEDGMENTS
This research was supported by NIH grants DA04334, AI-35042, and RR-00722.
We acknowledge Richard Kline for the HIV RNA load measure-ments, Karen Eckert for serology support, and Elisa Ramirez for measurements of T-cell subsets.
REFERENCES
1. Boom, R., C. J. Sol, M. M. Salimars, L. L. Jansen, P. M. Wertheim-van
Dillen, and J. van der Noordua.1990. Rapid and simple method for purifi-cation of nucleic acid. J. Clin. Microbiol. 28:495–503.
2. Brambilla, D. J., J. W. Bremer, B. Staes, C. Michels, and P. Reichelderfer for
the DAIDS-Sponsored Virology Laboratories.1996. Intra- and inter-assay variation in estimates of viral titers from quantitative microcultures, Tu.B.2375. In Proceedings of the XI International Conference on AIDS. 3. Bush, C. E., R. M. Donovan, N. Markowitz, D. Baxa, P. Kvale, and L. D.
Saravolatz.1996. Gender is not a factor in serum human immunodeficiency virus type 1 RNA levels in patients with viremia. J. Clin. Microbiol. 34:970–972. 4. Evans, J. S., T. Nims, J. Cooley, W. Bradley, L. Jagodzinski, S. Zhou, G. P.
Melcher, D. S. Burke, and M. Vahey.1997. Serum levels of virus burden in early-stage human immunodeficiency virus type 1 disease in women. J. In-fect. Dis. 175:795–800.
5. Fiscus, S. A., V. DeGruttola, P. Gupta, D. A. Katzenstein, W. A. Meyer III,
M. L. LoFaro, M. Katzman, M. V. Ragni, P. S. Reichelderfer, and R. W. Coombs.1995. Human immunodeficiency virus type 1 quantitative cell mi-croculture as a measure of antiviral efficacy in a multicenter clinical trial. J. Infect. Dis. 171:305–311.
6. Fiscus, S. A., M. D. Hughes, J. L. Lathey, T. Pi, B. Jackson, S. Rasheed, T.
Elbeik, R. Reichman, A. Japour, R. Byington, W. Scott, B. P. Griffith, D. A. Katzenstein, and S. M. Hammer for the AIDS Clinical Trials Group Pro-tocol 175 Team.1998. Changes in virologic markers as predictors of CD4 cell decline and progression of disease in human immunodeficiency virus type 1-infected adults treated with nucleosides. J. Infect. Dis. 177:625–633. 7. Giorgi, J. V., H.-L. Cheng, J. B. Margolick, K. D. Bauer, J. Ferbas, M.
Waxdal, I. Schmid, L. E. Hultin, A. L. Jackson, and L. Park.1990. Quality control in the flow cytometric measurement of T-lymphocyte subsets: the Multicenter AIDS Cohort Study (MACS) experience. Clin. Immunol. Im-munopathol. 55:173–186.
8. Kaslow, R. A., D. G. Ostrow, R. Detels, J. P. Phair, B. E. Polk, and C. R.
Rinaldo.1987. The Multicenter AIDS Cohort Study: rationale, organization, and selected characteristics of the participants. Am. J. Epidemiol. 126:310– 318.
9. Katzenstein, D. A., J. S. M. Hammer, M. D. Hughes, H. Bundacker, J. B.
Jackson, S. Fiscus, S. Rasheed, T. Elbeik, R. Reichman, A. Japour, T. C. Merigan, and M. S. Hirsch for the AIDS Clinical Trials Group Study 175 Virology Study Team.1996. The relation of virologic and immunologic mark-ers to clinical outcomes after nucleoside therapy in HIV-infected adults with 200 to 500 CD4 cells per cubic millimeter. N. Engl. J. Med. 335:1091–1098. 10. Lathey, J. L., M. D. Hughes, S. A. Fiscus, T. Pi, J. B. Jackson, S. Rasheed,
T. Elbeik, R. Reichman, A. Japour, R. T. D’Aquila, W. Scott, B. P. Griffith, S. M. Hammer, and D. A. Katzenstein for the AIDS Clinical Trials Group Protocol 175 Team.1998. Variability and prognostic values of virologic and CD4 cell measures in human immunodeficiency virus type 1-infected pa-tients with 200–500 CD4 cells/mm3(ACTG 175). J. Infect. Dis. 177:617–624. 11. Lew, J., P. Reichelderfer, M. Fowler, J. Bremer, R. Carrol, S. Cassol, D.
Cher-noff, R. Coombs, M. Cronin, R. Dickover, S. Fiscus, S. Herman, B. Jackson, J. Kornegay, A. Kovacs, K. McIntosh, W. Meyer, N. Michael, L. Mofenson, J. Moye, T. Quinn, M. Robb, M. Vahey, B. Weiser, and T. Yeghiazarian for the Tube Meeting Workshop Attendees.1998. Determinations of levels of hu-man immunodeficiency virus type 1 RNA in plasma: reassessment of param-eters affecting assay outcome. J. Clin. Microbiol. 36:1471–1479.
12. Margolick, J. B., E. R. Scott, K. R. Chadwick, H. M. Shapiro, A. D. Hetzel,
S. J. Smith, and R. F. Vogt, Jr.1992. Comparison of lymphocyte immuno-phenotypes obtained from two different data acquisition and analysis systems simultaneously on the same flow cytometer. Cytometry 13:198–203. 13. Mellors, J. W., C. R. Rinaldo, P. Gupto, R. M. White, J. A. Todd, and L. A.
Kingsley.1996. Prognosis in HIV-1 infection predicted by the quantity of virus in plasma. Science 272:1167–1170.
14. Mellors, J. W., A. Mun˜oz, J. V. Giorgi, J. B. Margolick, C. J. Tassoni, P.
Gupta, L. A. Kingsley, J. A. Todd, A. J. Saah, R. R. Detels, J. P. Phair, and C. R. Rinaldo.1997. Plasma viral load and CD41lymphocytes as prognostic markers of HIV-1 infection. Ann. Intern. Med. 126:946–954.
15. Myers, L. E., L. J. McQuay, and F. B. Hollinger. 1994. Dilution assay statistics. J. Clin. Microbiol. 32:732–739.
16. O’Brien, T. R., W. A. Blattner, D. Waters, E. Eyster, M. W. Hilgartner, A. R.
Cohen, N. Luban, A. Hatzakis, L. M. Aledort, P. S. Rosenberg, W. J. Miley, B. L. Kroner, and J. J. Goedert.1996. Serum HIV-1 RNA levels and time to development of AIDS in the Multicenter Hemophilia Cohort Study. JAMA
276:105–110.
17. O’Brien, W. A., P. M. Hartigan, D. Martin, J. Esinhart, A. Hill, S. Benoit, M.
Rubin, M. S. Simberkoff, J. D. Hamilton, and the Veterans Affairs Cooper-ative Study Group on AIDS.1996. Changes in plasma HIV-1 RNA and CD41lymphocyte counts and the risk of progression to AIDS. N. Engl. J. Med. 334:426–431.
18. Paxton, W. B., R. W. Coombs, M. J. McElrath, M. C. Keefer, J. Hughes, F.
Sinangil, D. Chernoff, L. Demeter, B. Williams, and L. Corey, for the Na-tional Institute of Allergy and Infectious Diseases AIDS Vaccine Evaluation Group. 1997. Longitudinal analysis of quantitative virologic measures in human immunodeficiency virus-infected subjects with.400 CD4 lympho-cytes: implications for applying measurements to individual patients. J. In-fect. Dis. 175:247–254.
19. Pezzotti, P., G. Rezza, A. Lazzarin, G. Angarano, A. Sinicco, F. Aiuti, R.
Zerboni, B. Salassa, S. Gafa, R. Pristera, P. Costigliola, L. Ortona, M. Barbanera, U. Tirelli, A. Canessa, P. Viale, F. Castelli, and S. Lo Caputo.
1992. Influence of gender, age, and transmission category on the progression from HIV seroconversion to AIDS. J. Acquired Immune Defic. Syndr. 5: 745–747.
20. Pezzotti, P., A. N. Phillips, M. Dorrucci, A. C. Lepri, N. Galai, D. Vlahov, G.
Rezza, and the HIV Italian Seroconversion Study Group.1996. Category of exposure to HIV and age in progression to AIDS: longitudinal study of 1199 people with known dates of seroconversion. Br. Med. J. 313:583–586. 21. Sen, P. K., and J. M. Singer. 1993. Large sample methods in statistics.
Chapman & Hall, Inc., New York, N.Y.
22. Spijkerman, I. J. B., M. W. Langendam, P. J. Veugelers, E. J. C. van
Ameijden, I. P. M. Keet, R. B. Geskus, A. van den Hoeck, and R. A. Coutinho.1996. Differences in progression to AIDS between injection drug users and homosexual men with documented dates of seroconversion. Epi-demiology 7:571–577.
23. U.S. Department of Health and Human Services. 1994. ACTG virology manual for HIV laboratories. Publication 94-3828. National Institutes of Health, Bethesda, Md.
24. Vella, S., M. Giuliano, M. Floridia, A. Chiesi, C. Tomino, A. Seeber, S.
Barcherini, R. Bucciardini, and S. Mariotti.1995. Effect of sex, age and transmission category on the progression to AIDS and survival of zidovu-dine-treated symptomatic patients. AIDS 9:51–56.
25. Vlahov, D., J. C. Anthony, A. Mun˜oz, J. Margolick, K. E. Nelson, D. D.
Celentano, L. Solomon, and B. F. Polk.1991. The ALIVE study: a longitu-dinal study of HIV-1 infection in intravenous drug users: description of methods. J. Drug Issues 21:759–776.
26. Vlahov, D., N. M. H. Graham, D. Hoover, C. Flynn, J. G. Bartlett, J. B.
Margolick, C. M. Lyles, K. E. Nelson, D. Smith, S. Holmberg, and H. Farzadegan.1998. Prognostic indicators for AIDS and infectious disease death in HIV-infected injection drug users—plasma viral load and CD41 cell count. JAMA 279:35–40.