© 2016, IRJET ISO 9001:2008 Certified Journal Page 43 indirect method used for shallow subsurface study.
Recently there has been an increased interest in the magnetic and 2-D resistivity in engineering and environmental prospect. 2-D resistivity prospecting involves the detection of surface effects produced by electric current flow in the ground. The magnetic method measures variations in the Earth's magnetic field which is contributed from the earth’s core. The earth’s outer core has convection processes which naturally occurring electrical currents. From a methodological viewpoint, this research further demonstrates the potential of 2-D resistivity effect the magnetic field values. As a first step, all magnetic reading must be taken without 2-D resistivity but for the second step, all magnetic reading was conducted on the same time with 2-D resistivity. Once the geophysical data have been obtained, the graph were plotted to see the effect of 2-D resistivity towards magnetic field which gives a realistic different with the data. The magnetic field values were drop during the magnetic survey was conducted simultaneously with the 2-D resistivity. However the profile pattern of the results obtained are the same during magnetic survey conducted without and with 2-D resistivity. The magnetic method was not affecting the 2-D resistivity data if the magnetic method conducted at the same time with 2-D resistivity. As a conclusion, 2-D resistivity can be conducted with magnetic method once but the magnetic method cannot be employed during the 2-D resistivity measurement. The best solution is that both 2-D resistivity and magnetic method must be conducted separately in the site.
Key Words:
2-D resistivity, Magnetic method, Effect,
Electrical current, Magnetic field
1. INTRODUCTION
Magnetic and 2-D resistivity were used routinely for the mapping of archaeological sites, engineering, mineral exploration and geological subsurface. Although very efficient for fast and accurate mapping, these methods
mapping distribution of subsurface materials.
Geophysical techniques sometimes produced
disappointing results to solve engineering and environmental problems, particularly when a method, which lacked the precision required in a particular site investigation has been used, or when a method has been specified that is inappropriate to the problem under consideration. In some cases these difficulties could have been avoided by taking expert advice before initiating the survey. In other cases the planning stage of the geophysical data acquisition may also contributed to the problem during interpretation. Sometimes due to insufficient time some geophysicists trying to carry out an investigation using the two methods at once to save time in the field. Due to the improper planning, interpretation of the geophysical data by the geophysicist has not yielded the information expected by the engineer or client. It is often advisable to undertake a feasibility study at the field site to assess the suitability of the proposed geophysical techniques for the investigation of the geological problem. In this paper, two geophysical techniques were chosen (2-D resistivity and magnetic method) to see the effect of 2-(2-D resistivity towards magnetic field data if the data acquisition was conducted at the same time.
2. MAGNETIC METHOD
© 2016, IRJET ISO 9001:2008 Certified Journal Page 44 Fig -1: The generation of earth’s magnetic field [1].
The resistivity in homogeneous earth can be estimated using two potential electrodes (purple) placed between the two current electrodes (red and green). Let the distances between the four electrodes be r1, r2, r3 and r4 as shown in Figure 2. The potential computed along the surface of the earth is shown in the Figure 3. The voltage observed with voltmeter is the difference in potential at the two voltage electrodes, ΔV [2] [3] [4].
Fig -2:Four electrodes principle to measure resistivity or conductivity [2] [3] [4].
[image:2.595.36.297.109.296.2]
Fig -3: Potential along the surface and potential difference [2] [3] [4].
Knowing the locations of four electrodes, and by measuring the amount of current input into the ground, i, and the voltage difference between the two potential electrodes, ΔV, the apparent resistivity, ρa, of the medium can be calculated using equation (1) [5].
(1)
3. STUDY AREA
The study was carried out in the area Universiti Sains Malaysia, Penang (Malaysia) (Figure 4) located at Cahaya Gemilang field. The total of one 2-D resistivity survey line and four magnetic survey lines were conducted with length of 40 m trending from North to South. The North part of the survey line (0 m) and the south part was 40 m. A magnetic survey was carried out with inline moving station with 3 m separation of each line. The distance was set at 0.5 m for each station for magnetic method and 1 m electrode spacing for 2-D resistivity method to cover the survey area.
0 10 20 30 Distance (m)
De
p
th
(m)
0
-5
-10
-15
-20
r
1r
2r
3 [image:2.595.30.274.439.599.2]© 2016, IRJET ISO 9001:2008 Certified Journal Page 45 Fig -4: Study area at Universiti Sains Malaysia (USM),
Penang, Malaysia [6].
4. METHODOLOGY
Two geophysical methods were employed for this study; magnetic and 2-D resistivity. All magnetic measurements were collected with reference to the same grid (Figure 5), which consisted of individual survey lines of 40 m oriented N-S and separated by 0.5 m. The spatial sampling interval along each line was 3 m. As a first step in conducting the magnetic method, all magnetic reading must be taken without 2-D resistivity but for the second step, all magnetic reading was conducted on the same time with 2-D resistivity. As a first step in the exploitation of the data, magnetic field value conducted with and without 2-D resistivity results were presented on the same graph.
A test of 2-D resistivity was conducted at L1 magnetic survey line to see the effect of 2-D resistivity current towards magnetic field values. A pole-dipole array was used with a fixed 1 m electrode spacing with two cables. A total profile length of 40 m was acquired, yielding 1230 data points and 10 data levels. The pole-dipole resistance
Fig -5: The orientation of 2-D resistivity and magnetic survey lines.
5. RESULTS AND DISCUSSION
From a methodological viewpoint it was also interesting to evaluate the potential benefits of using multiple techniques on such a site and to integrate their findings to achieve an understanding of the geophysical response beyond two different techniques conducting on the same time.
[image:3.595.35.273.67.468.2] [image:3.595.308.560.184.299.2]© 2016, IRJET ISO 9001:2008 Certified Journal Page 46 Fig -6: The effect of 2-D resistivity method with magnetic
[image:4.595.36.295.293.457.2]field on L1.
[image:4.595.309.581.457.531.2]Fig -7: The effect of 2-D resistivity method with magnetic field on L2.
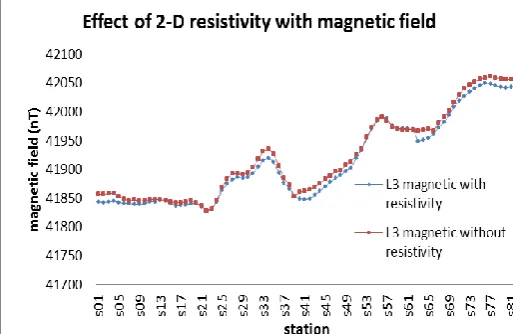
Fig -8: The effect of 2-D resistivity method with magnetic field on L3.
Fig -9: The effect of 2-D resistivity method with magnetic field on L4.
[image:4.595.36.293.497.664.2]Figure 10 and 11 show the 2-D inversion model resistivity conducting with and without magnetic method respectively on the same line. Measurements were carried out to investigate the effect of magnetic method towards 2-D resistivity data. The RMS error for 2-D resistivity profile is 3% (with magnetic method) and 12.2% (without magnetic method). Although the two profiles show different RMS error, the apparent resistivity values and the resistivity image are almost the same. This is shows in the Figure 12 after the standard value for each profile was included during data processing. From the result obtained, the magnetic methods will not affecting the apparent resistivity values and resistivity images interpretation.
Fig -10: The 2-D inversion model resistivity conducted on the same time and line of magnetic.
Fig -11: The 2-D inversion model resistivity conducted not on the same time but on the same line with magnetic.
[image:4.595.307.580.571.649.2] [image:4.595.309.581.692.776.2]© 2016, IRJET ISO 9001:2008 Certified Journal Page 47
6. CONCLUSSION
This research involves with the knowledge of the fundamental physical properties of the geophysical method. With this input of precise information, it will help geophysicist to have a proper plan during data acquisition at the real site. The influence of a current applied by 2-D resistivity may affect the magnetic field values. In these studies, the magnetic method is largely dominated by the current effect produced by 2-D resistivity method which leads to the decreasing magnetic field values. However, the magnetic method is not affecting 2-D resistivity data at all. The best plan for geophysicist is that the 2-D resistivity and magnetic method cannot be carried out on the same time. Based on the data, further investigation can be done to see the optimum distance for magnetic method that can be conducted away from the 2-D resistivity survey.
ACKNOWLEDGEMENT
The first author would like to thank to all her final year students, postgraduate students and the lab assistants for their help during data acquisition.
REFERENCES
[1] Website
(hyperphysics.phy-astr.gsu.edu/.../magearth.html) J. Breckling, Ed., The Analysis of Directional Time Series: Applications to Wind Speed and Direction, ser. Lecture Notes in Statistics. Berlin, Germany: Springer, 1989, vol. 61. [2] Burger, C. D. (1990), The self-potential method for
environmental and engineering applications in Ward, Stanley H., ed., Geotechnical and environmental geophysics; Review and tutorial: Society of Exploration Geophysicists Investigations, Geophysics, 1(5), 127-145.
![Fig -3: Potential along the surface and potential difference [2] [3] [4].](https://thumb-us.123doks.com/thumbv2/123dok_us/8204360.816394/2.595.30.274.439.599/fig-potential-surface-potential-difference.webp)
![Fig -4: Study area at Universiti Sains Malaysia (USM), Penang, Malaysia [6].](https://thumb-us.123doks.com/thumbv2/123dok_us/8204360.816394/3.595.35.273.67.468/fig-study-area-universiti-sains-malaysia-penang-malaysia.webp)