© 2015, IRJET.NET- All Rights Reserved
Page 315
SNR IMPROVEMENT FOR MONOCHROME DETECTOR USING BINNING
Dhaval Patel
1, Savitanandan Patidar
2, Pranav Parmar
31
PG Student, Electronics and Communication Department, VGEC Chandkheda, Gujarat, India
2
PG Student, Electronics and Communication Department, VGEC Chandkheda, Gujarat, India
3
PG Student, Electronics and Communication Department, L.D. Engineering College, Gujarat, India
---***---Abstract – In remote sensing application, images are
captures with very weak strength and very high noise levels. To improve that signal’s SNR here in this paper we have simulated binning hypothesis to improving SNR with Monochrome detector using integrator sphere.
Key Words:
Binning, SNR, Monochrome detector,
integrating sphere
1. INTRODUCTION
In geological remote sensing most gases which we are sensing in our atmosphere gives very less amount of signals and unwanted (noise) signals are more, so SNR of our system is very low. So to improve SNR of detector we have done some experiment. Section II is consists of Concept of SNR; in section III we have covered binning concept and how it will improve SNR. Section IV covered the Integrating sphere which we have used to capture uniform intensity images, in Section V results are covered and conclusion is in section VI.
2. SIGNAL TO NOISE RATIO
A key parameter for any detector is signal to noise ratio or SNR, SNR measure the sensitivity performance of a Detector. This is of major significance parameter in Detector which is used Remote sensing detector.
There are a various ways in which the noise performance of a Detector can be measured. The generally technique is to evaluate the signal and noise levels for a known signal level which means SNR. Clearly,the large Detector radio receiver sensitivity performance.
2.1 Concept of signal to noise ratio SNR
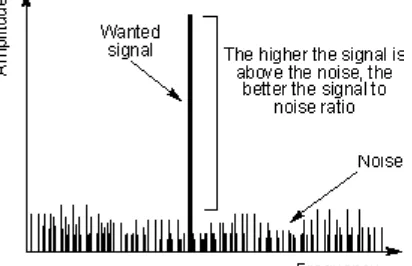
[image:1.595.311.517.232.365.2]There are various ways of evaluating the sensitivity performance of a Detector, still it has a many limitations, and even if it is extensively used, other methods used noise figure more often. Yet the SNR is a significant specification and is extensively used as a measure of Detector sensitivity.
Fig 1:- General representation of Signal to noise ratio
The dissimilarity is generally shown as a ratio between the signal and the noise and it is normally expressed in decibels. Typically a certain input level required to give a 10 dB signal to noise ratio is specified.
The signal to noise ratio is the ratio between the desire signal and the undesired background noise.
SNR =
But commonly SNR expressed in a logarithmic basis using decibels:
SNRdb = 10
The equation can be simplified to:
SNRdb =
-
3. BINNING TO IMPROVE SNR
© 2015, IRJET.NET- All Rights Reserved
Page 316
Photon Noise =Readout noise is variation of electron generated while read out of a detector. The noise distribution is close to Gaussian like.
Dark Noise to understand dark noise one must understand dark current which is the detector output when no light is incident on it. The noise in this output is referred as dark noise.
Electronics Noise is basically the noise generated due to the electronic components such as amplifiers, transistor etc. which are required to extract the information from the detector.
System Noise =
But in our case noise other than Photon noise are negligible. Thus
System Noise =
This system noise equation is written from Poisson distribution.
SNR = = =
If we take signal n times or capture target n times then
SNRn
=
=
So as we bin the target SNR should be increase by (square root of n) times.
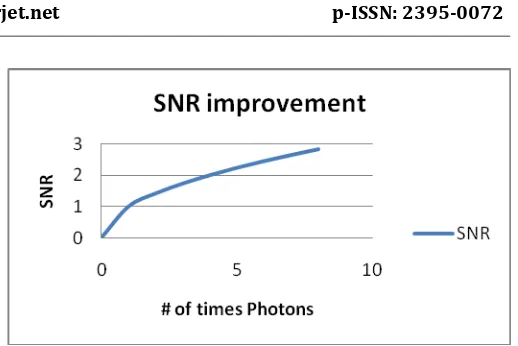
[image:2.595.305.564.65.238.2]If we plot a graph then it should be as follows:
Fig 2:- Expected Results of Binning
if we derived equation for this, then equation will be : Y= and x should be nearly equal to 0.5.
4. INTEGRATING SPHERE
Integrating spheres are very versatile optical elements, which are designed to achieve homogenous distribution of optical radiation by means of multiple Lambertian reflections at the sphere's inner surface. The primary radiation source can be located either inside the sphere or in front of the source's entrance port. In the latter case, only the optical radiation entering the sphere is relevant for the sphere's internal radiation distribution. As long as we restrict ourselves to those regions which are shielded from direct irradiation by the primary source and are thus only illuminated by reflections at other of the inner surface, the theory of the ideal integrating sphere leads to two important conclusions:
© 2015, IRJET.NET- All Rights Reserved
Page 317
Fig. 3:- Integrating sphere used as a standard source foroptical radiation. Multiple Lambertian reflections inside the sphere result in a homogenous radiance and existence distributions at the sphere's exit port.
Conclusion 2: Radiance reflected by a region of the sphere's inner surface shielded from direct illumination is constant in its directional distribution and independent from the specific location where the reflection occurs. Thus, the sphere's exit port can be used as an ideal Lambertian source as optical radiation leaving the sphere is characterised by homogenous radiance and existence
[image:3.595.309.559.138.323.2]distributions. This property becomes especially important when a sphere is used as a standard calibration source. Fig. 4:- Commercial integrating sphere
5. RESULTS
[image:3.595.75.228.255.385.2]Test 1: One set of 300 Uniform intensity Images In this test we have capture 300 images of uniform intensity as shown in below.
Fig. 5:- Uniform Intensity image capture by integrating sphere for test 1
Then we made stack of 300 images and we binned in temporal direction. When we bin by factor 2 we simply add 2 images (1st and 2nd , 3rd and 4th so on). so we have
stack of new 150 images.
Then we bin by factor 3 (add 1st, 2nd , 3rd and 4th, 5th , 6th
so on). We have bin up to 10.Results are shown below.
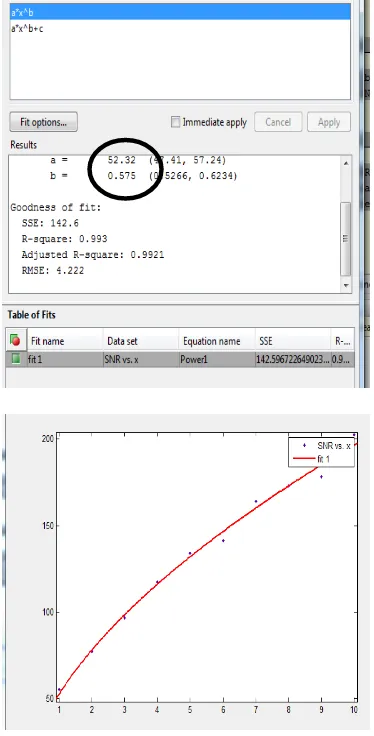
Fig.6:- SNR vs Binning for test 1
[image:3.595.307.494.383.751.2]We have fit the curve (shown in below figure) and we get results as expected as we can see here. We have expected answer around 0.5 and we get 0.575.
[image:3.595.37.286.509.685.2]© 2015, IRJET.NET- All Rights Reserved
Page 318
Test 2: One set of 360 Uniform intensity ImagesIn this test we have capture 360 images of uniform intensity as shown in below.
Fig.8:- Uniform Intensity image capture by integrating sphere for test 2
Then we made stack of 360 images and we binned in temporal direction. When we bin by factor 2 we simply add 2 images (1st and 2nd, 3rd and 4th so on). So we have
stack of new 180 images.
Then we bin by factor 3 (add 1st, 2nd , 3rd and 4th, 5th , 6th
so on). We have bin up to 10.Results are shown below.
Fig.9 SNR vs Binning for test 2
We have fit the curve (shown in below figure) and we get results as expected as we can see here. We have expected answer around 0.5 and we get 0.4427.
Fig.7:- Curve fit for SNR v/s Binning for test 2
6. CONCLUSION
From results we can conclude that binning technique is very accurate technique to improve SNR of system. But it still got some limitations. We need to capture same image over and over again, As this test was taken under lab conditions but in practical condition there are chances we might add different pixel and we might degrade SNR. So need to take care of this limitation other than this it is very good method.
REFERENCES
[1] Gilles Hennenfent, Felix J. Herrmann, “Seismic Denoising with Nonuniformly Sampled Curvelets” 2006 IEEE Computer Society
[2] http://www.qimaging.com/support/pdfs/RoleraEM C2-binning.pdf
© 2015, IRJET.NET- All Rights Reserved
Page 319
derivative-domain wavelet shrinkage, IEEE Trans.Geosci. Rem. Sens. 42, no. 2pp. 397-408, 2006
[4] S.-E. Qian, H. Othman, Method and system for increasing signal-to-noise ratio, US patent 60/763,381, 2007. International patent application PCT/CA2007/000114.
[5] Hong-Yi Huang, Conge, P.A, Li-Wei Huang, “CMOS image sensor binning circuit for low-light imaging”, Industrial Electronics and Applications (ISIEA), 2011 IEEE Symposium on, 25-28 Sept. 2011
[6] Hassebo, Y. Y., B. Gross, et al.. "Polarization discrimination technique to maximize LIDAR signal-to-noise ratio for daylight operations." App. Opt. 45: 5521-5531. (2006)
[7] Andrew Wilson, “Binning techniques increase signal-to-noise ratio in CMOS imagers”
[8] http://light-measurement.com/integrating-spheres-tutorial/