© 2016, IRJET | Impact Factor value: 4.45 | ISO 9001:2008 Certified Journal
| Page 936
STUDY AND IMPLEMENTATION OF VIRTUAL DESIGN CONCEPT AND
BUILDING INFORMATION MODELING IN RESIDENTIAL PROJECT
D.Lingaeswar
1, Krishnaraj.L
2, Veena.P.Kaimal
3, B.Vignesh
41,4
Assistant Professor, Civil Engineering Department, Coimbatore Institute Of Engineering And Technology,
Coimbatore, Tamil Nadu, India,
2
Assistant Professor, Civil Engineering Department, SRM University, Chennai, Tamil Nadu, India,
3Senior Engineer Planning, L&T construction ITC Green center project, Maruti sevanagar, Bangalore,
Karnataka, India,
---***---Abstract -
The infrastructure growth has envisaged theneed for the project engineers to plan the activities in a more accurate and orderly manner. Proper planning can result in optimized use of resources and thereby reduce delay in a greater extent. This paper deals with the improvement of planning by developing a virtual Reality (VR) model of the project which depicts the building in 4D, with time as the fourth dimension. The model is logically integrated such that they can access shared data, and if a user highlights or changes some data, it gets highlighted in the model. The model is said to be multi-disciplinary in the sense that it will represent the Architect, Engineering, contractor (AEC) and Owner of the project, as well as relevant sub disciplines.The model is known as performance models in the sense that they predict some aspects of project performance, track many that are relevant, and can show predicted and measured performance with respect to the stated project performance objectives. It also included the comparison with their experience in using the conventional method of planning for the project through a questionnaire survey. The results were analyzed using SPSS software. The 3D modeling of the building was done using building information modeling (BIM) tools REVIT ARCHITECTURE and the MSP schedule of the same was embedded in to the model using NAVIS WORKS software. The result concluded with the analysis result obtained from survey and their interpretations that virtual model turned to be more efficient and effective in proper planning and identifying the clash detections and quantity estimation in fast pace manner.
Key Words: Virtual Reality model, Building information modeling (BIM), Questionnaire survey, Planning, Clash detections
1.INTRODUCTION
Construction project planning has been considered as a critical process in the early project phases that determines the successful implementation and delivery of project. During this stage, project planners need to develop main construction strategies, to establish construction path and assembly sequences, to arrange construction methods and resources required for the execution of work packages. The Building Information Modeling (BIM) is an architectural, engineering and construction workflow of utilizing information which has been loaded into a building design project. The information in a virtual model is commonly utilized in the areas of building design and engineering, material takeoff and cost estimating. Industry focus continues to be on the 3D value of a model which allows the building team to better plan, design, visualize, and construct the built environment. (J. Vinoth Kumar and Mahua Mukherjee (1). Department of Architecture and Planning, Indian Institute of Technology, Roorkee, India. (IIT), reported (3rdNov 2009).These sophisticated 3D computer models allow the project team to see the finished project before any construction work begins, resolve. Construction clashes, and ensure that every team member understands the design exactly as it was intended. On the job site, BIM allows us to save time, save money, and build higher quality projects through
Better coordination of subcontractors
Better integration of various construction elements Fewer subcontractor change orders in the field More opportunities for prefabrication
Fewer construction delays Higher productivity
2
Scope and Objectives
To create a customer friendly model, which can be used as a single data warehouse.
This study is done to enhance the pre planning of the construction projects.
© 2016, IRJET | Impact Factor value: 4.45 | ISO 9001:2008 Certified Journal
| Page 937
To reduce the time loss, which is spent in loiteringaround for data’s and other project related papers by making a user friendly model.
To create a customer and friendly project model. The main objectives of this paper are as follows: Creation and analysis of virtual model
The main objective of the project is to create a 4D model of a building and to analyze and monitor the construction work. Time is taken as the fourth dimension. The model is further used as a single platform to access whole details of the building at any stage and there by analyze the performance, error, delay and detect any clashes in the drawing.
Comparative study
Apart from creating a virtual model a questionnaire survey is conducted. The results are analyzed and a comparative done is done based on conventional based planning and planning done using virtual model
.
3. Methodology
The above said methodology is for developing a virtual design for a residential project and track the activities with respect to time. The detailed methodology can be explained as follows:
• Data collection
• Questionnaire survey and analysis based on conventional planning
• 4D model preparation
• Questionnaire survey based on virtual model • Analysis and comparison of results.
Fig 1 Data collection
The project starts with the data collection from AKSHAYA site, which is a residential project with 13 stories. The project includes 3 bedroom flats with square feet’s ranging from 1451-1571 Sq.ft. The basic details of the site and the program used for current execution of the project is got and analyzed.
3
.2 Questionnaire survey and analysis based on
conventional planning
The project is half way through and so a questionnaire survey is conducted based on their conventional mode of planning implemented on the project. The questionnaire is analyzed using SPSS (Statistical Package for the Social Sciences) software. Using SPSS we can manipulate data, make graphs and performs statistical techniques varying from means to regression. The result gives an idea of how the project managers feel about the usage of CAD drawings, complexity and level of understanding using it and also about the conventional mode of planning adopted in the project.
The survey is conducted on a set of 30 companies based on below mentioned factors. The survey is based on companies involved in doing residential projects. The samples were taken and analyzed using SPSS.
S.NO 2D Drawings Domain
1 2 3 4 5 6 7 8 9 10 11 12 13 14 15 16 17 18 19 20 21 22 23 24 25 26 27 28 29 30 31 32 33 34 35 36 37
Better Overview of Project
Understanding of work environment Better Detailing
Sufficient to experience future work
Understand details outside field of expertise Building looking alike as imagined
Easy to explain the details Easy to Remember Easy to make decisions
Internal environment understanding External environment understanding Cooperation within same group Cooperation outside group
Understanding detailing of other area More information required
Future need of cad Difficult to plan Documentation Good accuracy High complexity level Easy resource planning Schedule
More errors
Freq schedule revisions More time delay
Quality Cost
Time consumption for understanding High cost
More time Face clash
Frequent plan change due to error Freq plan change due to clashes Difficult to locate clashes Misunderstanding of drawing
© 2016, IRJET | Impact Factor value: 4.45 | ISO 9001:2008 Certified Journal
| Page 938
3839 40 41 42 43
Difficult to analyze dimension Less accuracy Time consuming
Size of new env
Assurance of client satisfaction Delivery
Timely finish
3.3 4D model preparation
[image:3.595.334.475.445.541.2]3D model is prepared using RIVET ARCHITECTURE software. Modeling is done based on all the details obtained from site. The model is based on the correct dimensions of each element so that the project can be seen in its real form in a virtual platform. (JP Zhang, Z.Z Hu (2010), Automation in Construction 155-166). Cost estimate of the whole project is also prepared from the same. We can also have a walk through effect through the model. A detailed schedule for the project is made using MSP (Microsoft Project) software based on the base program. Care is taken to avoid all delays and optimize the resources at the scheduling phase. Once the schedule is done, this is followed by clubbing of data’s of MSP with RIVET using NAVISWORKS software. Hence a 3D model with time scale embedded in to it results in a 4D model which helps to monitor the project throughout the execution stage at any point of time. The model can also be oriented at any angle to view any part or element of it. It also shows the details of the structural elements and shows if any clashes occur during the execution. A model of the 13 storied residential apartment is done using RIVET ARCHITECTURE for sample reference. From the model, clash detections and quantity estimation can be done.
Figure 3.1 RIVET model of the 13 storied building By appending the rivet model in to the NAVIS WORKS software, a 4D model is obtained with time as the fourth dimension. As the time scale is moved we get to know the progress in the building by changes in the model. The main advantage of this is that we can analyze the performance of the activities in the project in a single platform. The screen shots of the performance at various stages are shown below:
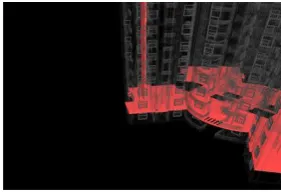
Figure 3.2 4D MODEL showing the progress of the building at 27th week
The red circle in the above Figure 3.2 shows the time liner, which when moved shows the progress of the building at a particular time period, which can be mentioned in minutes, seconds, days, weeks or months. The blue circle shows the day, date and the time in terms of week and days. The yellow outline in the figure shows the schedule being appended in to NAVIS WORKS at the beginning.
3.3.1 Clash Detection
:One of the significant features of NAVIS WORKS is that we can find the clashes or interferences in a building before executing so that future errors can be eliminated. A sample of the report is given below in Figure 1.6 Along with the descriptions of the type and positions it will also show the image view of the clashes.
Figure 3.3 Clash detection
3.4 Questionnaire survey based on virtual model
Once the 4D model is prepared it is shown to the employees and a questionnaire is prepared based on its performance, easiness, complexity, usefulness etc. Apart from the factors mentioned in pre-analysis survey, the following factors or domains and variables as mentioned in below table are also included in the survey based on virtual model. The answers are analyzed using SPSS software.Domain Variables
Age 21-30
31-50 >50 Educational qualification Diploma
[image:3.595.37.290.520.605.2]© 2016, IRJET | Impact Factor value: 4.45 | ISO 9001:2008 Certified Journal
| Page 939
Sex classification MaleFemale Nativity of client Rural
Urban Metro
3.5 Analysis and comparison
Once the survey is conducted, the answers are analyzed using the SPSS software and both the survey analysis are compared and studied. The result includes the correlations and descriptive statistics between and of different variables. The model is done and analyzed and it’s used to find out the clashes and errors in the drawings and lag in schedule. (Youngsoo Jung, Mihee Joo, and Automation in Construction 20 (2011)126-133).The virtual model which is constructed can be used for advanced level of planning and thereby reduce the time and cost factors involved in conventional method planning. The final result is based on the comparative analysis of questionnaire and the result interpretations from model.
3.5.1 Pre-Analysis
The results are analyzed based on questionnaire survey using SPSS 11.5.The analysis factors are:
• Experience of participants using CAD. • Planning
• Information processing • Time, cost and quality • Execution
• Estimation • Client satisfaction
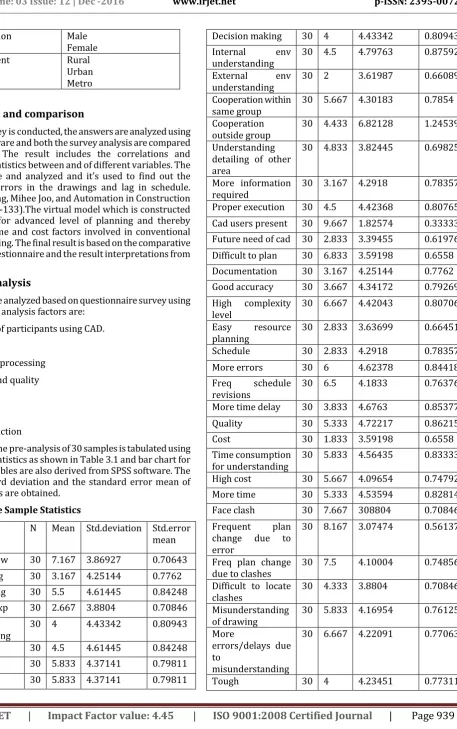
[image:4.595.96.554.70.800.2]The result of the pre-analysis of 30 samples is tabulated using one sample statistics as shown in Table 3.1 and bar chart for different variables are also derived from SPSS software. The mean, standard deviation and the standard error mean of various factors are obtained.
Table 3.1 One Sample Statistics
Variable N Mean Std.deviation Std.error mean
Better overview 30 7.167 3.86927 0.70643 Understanding 30 3.167 4.25144 0.7762 Better detailing 30 5.5 4.61445 0.84248 Sufficient to exp 30 2.667 3.8804 0.70846 Understand
outside detailing 30 4 4.43342 0.80943 As imagined 30 4.5 4.61445 0.84248 Explanation 30 5.833 4.37141 0.79811
Remember 30 5.833 4.37141 0.79811
Decision making 30 4 4.43342 0.80943 Internal env
understanding 30 4.5 4.79763 0.87592 External env
understanding 30 2 3.61987 0.66089 Cooperation within
same group 30 5.667 4.30183 0.7854 Cooperation
outside group 30 4.433 6.82128 1.24539 Understanding
detailing of other area
30 4.833 3.82445 0.69825
More information
required 30 3.167 4.2918 0.78357
Proper execution 30 4.5 4.42368 0.80765 Cad users present 30 9.667 1.82574 0.33333 Future need of cad 30 2.833 3.39455 0.61976 Difficult to plan 30 6.833 3.59198 0.6558 Documentation 30 3.167 4.25144 0.7762 Good accuracy 30 3.667 4.34172 0.79269 High complexity
level 30 6.667 4.42043 0.80706
Easy resource
planning 30 2.833 3.63699 0.66451
Schedule 30 2.833 4.2918 0.78357
More errors 30 6 4.62378 0.84418
Freq schedule
revisions 30 6.5 4.1833 0.76376
More time delay 30 3.833 4.6763 0.85377
Quality 30 5.333 4.72217 0.86215
Cost 30 1.833 3.59198 0.6558
Time consumption
for understanding 30 5.833 4.56435 0.83333 High cost 30 5.667 4.09654 0.74792 More time 30 5.333 4.53594 0.82814 Face clash 30 7.667 308804 0.70846 Frequent plan
change due to error
30 8.167 3.07474 0.56137
Freq plan change
due to clashes 30 7.5 4.10004 0.74856 Difficult to locate
clashes 30 4.333 3.8804 0.70846
Misunderstanding
of drawing 30 5.833 4.16954 0.76125 More
errors/delays due to
misunderstanding
30 6.667 4.22091 0.77063
© 2016, IRJET | Impact Factor value: 4.45 | ISO 9001:2008 Certified Journal
| Page 940
Difficult to analyze 30 3.333 3.79049 069205Less accuracy 30 4.667 4.34172 0.79269 Time consuming 30 7.167 3.86927 0.70643 Size of new env 30 3 4.27503 0.78051 Assurance of client
satisfaction 30 5.167 3.82445 069825 Delivery 30 5.167 3.82445 0.69825 Timely finish 30 3.667 3.45746 0.63124 Convince client 30 5.333 3.45746 0.63124 The bar charts are derived for various factors like respondents experience using CAD, planning, information processing, time cost and quality, execution, and estimation. The respondents feel that the drawing gives good overview but difficult to maintain good cooperation among other work groups.
Figure 3.4 Means of various factors affecting the experience of
Participants using CAD
From Figure 4.1 it’s noticed that, the experience using CAD was average and the mean rounds up to 4.57. The workers feel that it gives a good over view but difficult to explain the external environment and to maintain a good cooperation among other groups.
Figure 3.5 Means of factors affecting planning using conventional method
In the Figure 3.5 the various factors regarding planning is plotted against their means and it infers that planning using conventional method is tough which results in frequent schedule revision and the workers experience it as less accurate. The mean obtained is 4.81.
3.5.2 Post-Analysis
The results are analyzed of questionnaire survey using SPSS 11.5.The demographic details and other domains as mentioned in Table 3.1 are also added apart from the factors included in pre- analysis.
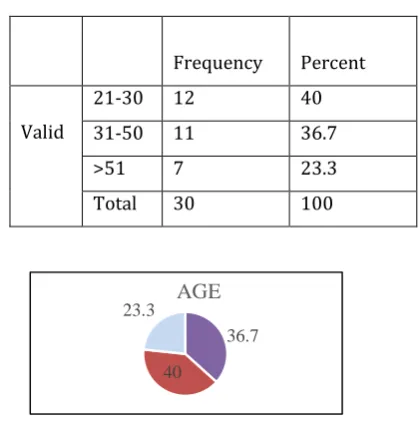
The frequencies of the age groups of the people who were interviewed are shown in Figure 3.6. The chart shows that nearly 37% are of age group 21-30, 24% of them are of age group above 51 and 40% of them between31-50. The output is tabulated using SPSS.
Table 3.2 Age Analysis - Frequencies
Frequency Percent
Valid
21-30 12 40
31-50 11 36.7
>51 7 23.3
Total 30 100
36.7
40
23.3
AGE
Figure 3.6 Age Analysis - Frequencies The qualifications of the people who were interviewed in different firms are shown in Figure 3.7 the persons who have done their under graduation are higher among the interviewed personnel’s. The tabulations are shown in Table 3.3
Table 3.3 Education Qualification
Education Frequency Percent
Valid
Diploma 4 13.3
UG 18 60
PG 6 20
Others 2 6.7
[image:5.595.30.293.101.238.2] [image:5.595.327.537.307.518.2] [image:5.595.57.232.325.458.2] [image:5.595.61.233.568.722.2]© 2016, IRJET | Impact Factor value: 4.45 | ISO 9001:2008 Certified Journal
| Page 941
Figure 3.7 Education Qualification
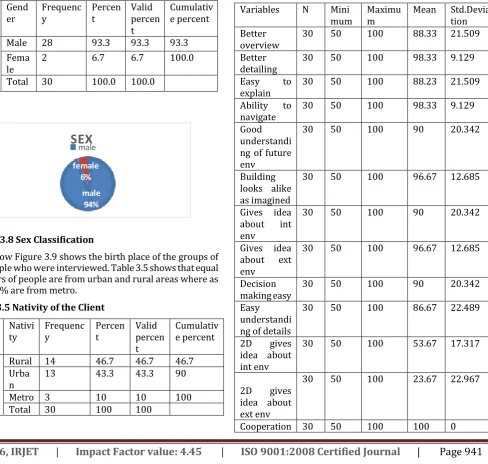
[image:6.595.38.281.329.561.2]The tabulations of the sex groups of the people who were interviewed are shown in Table 3.4. The result shows that out of 30 only 2 were ladies and the rest were gents. The schematic representation is shown below in Figure 3.8. Thus the result shows that males dominates in the industry. Table 3.4 Sex Classification
Gend
er Frequency Percent Valid percen t
Cumulativ e percent
Valid Male Fema 28 93.3 93.3 93.3
le 2 6.7 6.7 100.0
Total 30 100.0 100.0
male 94% female 6%
SEX
maleFigure 3.8 Sex Classification
[image:6.595.68.557.335.799.2]The below Figure 3.9 shows the birth place of the groups of the people who were interviewed. Table 3.5 shows that equal numbers of people are from urban and rural areas where as only 10% are from metro.
Table 3.5 Nativity of the Client Nativi
ty Frequency Percent Valid percen t
Cumulativ e percent
Valid Rural 14 Urba 46.7 46.7 46.7
n 13 43.3 43.3 90
Metro 3 10 10 100
Total 30 100 100
46.7 43.3
10
0 20 40 60
RURAL URBAN METRO
P
E
R
CE
N
T
PLACE OF BIRTH
Figure 3.9 Nativity of the Client
The below Table 3.6 shows the descriptive statistics of respondents experience using VR model. The mean and the standard deviation values shows that more than 2D drawing, the virtual model is easy to understand and for using as decision making tool and also gives good idea about the internal and external environment.
Table 3.6 Nativity of the Client Variables N Mini
mum Maximum Mean Std.Deviation Better
overview 30 50 100 88.33 21.509
Better
detailing 30 50 100 98.33 9.129 Easy to
explain 30 50 100 88.23 21.509
Ability to
navigate 30 50 100 98.33 9.129
Good understandi ng of future env
30 50 100 90 20.342
Building looks alike as imagined
30 50 100 96.67 12.685
Gives idea about int env
30 50 100 90 20.342
Gives idea about ext env
30 50 100 96.67 12.685
Decision
making easy 30 50 100 90 20.342
Easy understandi ng of details
30 50 100 86.67 22.489
2D gives idea about int env
30 50 100 53.67 17.317
2D gives idea about ext env
30 50 100 23.67 22.967
© 2016, IRJET | Impact Factor value: 4.45 | ISO 9001:2008 Certified Journal
| Page 942
with sameoccupationa l group Cooperation with other group
30 50 100 88.33 21.509
Valid N(list
wise) 30 50 100 32 36.615
4 . Conclusion
From the analysis of questionnaires based on importance and relevance of 2D drawing and importance and relevance of Virtual Reality, using SPSS software the result were obtained and the conclusion is made based on the comparison of both the result and are as follows:
As per the pre-analysis, the workers feel that CAD drawing gives a good over view but it’s difficult to explain the external environment and to maintain a good cooperation among other groups. It also infers that it’s tough to plan using conventional method which results in frequent schedule revision and the workers experience it as less accurate. The model of the building is done using RIVET ARCHITECTURE. The interference reports and the quantities are derived and the cost is calculated from it. The 4D model with time as the fourth dimension is made using NAVIS WORKS. The progress and the clashes can be identified from it which can be identified in a single platform. The clash detections are also obtained from this.
From post-analysis, it is understood that most of the respondents are in the age group 21-30 yrs. So switching over from conventional method of planning to 4D will be easy for them to learn and adopt in future and it’s easy to adopt and be aware of the technology changes since most of them have done under graduation or above.
Comparison of the post and pre SPSS result analysis says that, the virtual model is easy to understand and a better decision making tool which also gives good idea about the internal and external environment. The respondents feel the model is not costly and it is easy to understand and which makes planning easy and thereby detecting clashes and update the progress in a fast pace compared to the conventional planning. Hence the objectives are satisfied.
Domain Variables Post-analysis Frequ
ency Percent Cumulative percent
Age 21-30
31-50 >50
12 11 7
40 36.7 23.3
40 76.7 100
Educational
qualification Diploma Undergraduat e
Post graduate Others
4 18 6 2
13.3 60 20 6.7
13.3 73.3 93.3 100
Sex classificatio n
Male
Female 28 2 93.3 6.7 93.3 100
Navity of
client Rural Urban Metro
14 13 3
46.7 43.3 10
46.7 90 100
5. ACKNOWLEDGEMENT:
My sincere thanks to my guide Mr. Krishna Raj L for his full support in guiding me with simulating suggestions and encouragement and also my special thanks to VEENA.P.KAIMAL for helping me to go ahead in all the time of the thesis work.
6. REFERENCE:
[1] J Vinoth Kumar and Mahua Mukherjee “Scope Of Building Information Modeling (Bim) In India”, Journal of Engineering science and technology Review 2 (1) (2009) 165-169. [2] Benedict D.Ilozor and David J.Kelly, “Building Information Modeling and Integrated Project Delivery in the Commercial Construction Industry: A Conceptual Study”, Journal of Engineering, project, and production management 2012, 2(1), 23-36.
[3] Ahmed F.walid Y.Thabet (2002)”A Virtual Construction Environment for Pre-Construction Planning”, Automation in construction 139-154.
[4] Aizhu re (2004) “Modeling of Irregular Structures for the Construction Simulation in Virtual Reality Environments Based on Web”, Automation in construction 122-136. [5] Borje Wester Dahl, Kaj Suneson, Claes Wernemyr, Mattias Roupe (2005) “User Evaluation Of A VR Architectural Model Compared With The Experience Of The Completed Building”, Automation in construction 150-165.
[6] Brian Wilkins, John Barrett (2000), “The Virtual Construction Site: A Web Based Teaching/Learning Environment in Construction Technology “, Automation in Construction 169-179.
[7] FF-Cheng, Y.W.Wang, X.Z.Ling, Y.Bai (2011) “A Petri Net Simulation Model for Virtual Construction of Earth Moving Operations”, Automation in construction 188-188