International Journal of Emerging Technology and Advanced Engineering
Website: www.ijetae.com (ISSN 2250-2459,ISO 9001:2008 Certified Journal, Volume 3, Issue 1, January 2013)
36
Statistical Evaluation of Critical Flashover and Withstand
Voltage for Small Airgap
John Tarilanyo Afa
Dept of Electrical Engineering, Niger Delta University, P.M.B. 71, Wilberforce Island, Yenegoa
Abstract—Insulation co-ordination and the risk of failure for insulation can be predicted if critical flashover (CFO) and insulation withstand voltages are known.
The paper aims at using the statistical method of evaluating the critical flashover and the withstand voltage for an airgap distance of 10cm. The work was carried out with a point-plane electrode (needle point) arrangement using air as the dielectric medium for the given gap.
Ten shots were allowed in each test and the breakdown probability was found. From the experimental values the critical flashover or the V50%, and the percentage breakdown
probabilities were found. The withstand VN at 10 percent was
estimated from the cumulative distribution function.
From the knowledge of the withstand voltage and the statistical over voltage at 90 percent probability, it was possible to estimate the risk of failures if desired for the given insulation.
Keywords—Breakdown probability, critical flashover voltage, cumulative distribution function, dielectric medium, Gaussian distribution, risk of failures
I. INTRODUCTION
The most important factors by which engineers describe the breakdown voltage of various gaps are the critical flashover and the withstand voltages. The critical flashover (CFO) voltage is the voltage that yields flashover of 50 percent of the given number of shots, known as probability
of voltage flashover (V50%).
The withstand voltage which is critical to the designer could be determined in various statistical form.
Due to large number of variables involved in insulation design, it tends towards a statistical procedure because each of these variables has its own characteristics probability of occurrence either alone or in conjunction with other variable [1, 2, 3].
Also the probability of most events occurring simultaneously is also remote, therefore a flashover once in many operations is allowed. The most usual case is to allow one flashover in 100 switching operations. This could form the basis for the design of airgap insulation.
Some designers use 0.2% probability of flashover (1 in 500 operations). In insulation design and operation, the withstand voltage is of outmost importance. Thus, the low probability region of flashover, 0.1% or 0.2% must be obtained from flashover probabilities of higher values [4,5].
The aim of the statistical evaluation of the test methods is to establish procedures for relevant interpretation of the parameters characterizing the insulation behaviour and to determine secure limits for the data obtained. The results following the application of a voltage stress to insulation is a discharge or withstand, and has a random nature [2, 6].
The main characteristic of interest in insulation is the disruptive discharge which may occur during the application of stress. Because of the randomness of the physical processes which leads to disruptive discharge, the same stress applied several times in the same conditions may not always cause disruptive discharge. Also, when discharge takes place, it may occur at different times. In addition, the application of stress, even if it does not cause discharge may result in a change of the insulation.
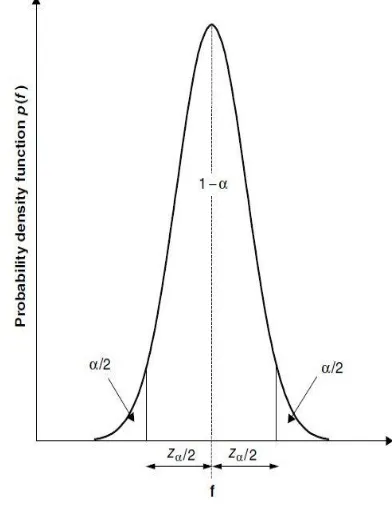
[image:1.612.333.529.448.703.2]Hence the parameters characterizing the behavior of the insulation must be handled statistically [2, 7, 8]. The most commonly used distribution function is the normal (Gaussian) distribution, which has a bell shape as shown in Fig. 1.
International Journal of Emerging Technology and Advanced Engineering
Website: www.ijetae.com (ISSN 2250-2459,ISO 9001:2008 Certified Journal, Volume 3, Issue 1, January 2013)
37 When the applied voltage (v) becomes the variable the Gaussian distribution function used takes the form
(1)
Where V50 is the voltage which leads to 50 percent
probability of discharge and σ is the standard deviation. A more convenient form of the normal distribution is the cumulative distribution function which has the form of
(2)
The CFO and the withstand voltage could be related as
(3)
II. MATERIALS AND METHODS
[image:2.612.55.288.364.491.2]The impulse voltage was used for the breakdown test. The equipment (single stage H.V) operates up to 140kv on impulse voltage. The circuit configuration is shown in fig.2
Fig. 2: Circuit Configuration of H.V. Equipment
The electrode stand TG was constructed from dried wood
and ebonite pipes. The wooden cross bar is made to carry a threaded iron rod of 320mm length where the electrode was fixed. The rod was also used for adjusting the airgap distance. The plate electrode (earth) is made of mild steel square plate (400mm x 400mm) which was earthed.
A needle electrode of 0.25mm radius (tip) was used as the positive point electrode as shown in fig 3.
Fig. 3: Needle Electrode
With the help of the electrode stand TG, the needle
electrode was fixed and connected to the high voltage terminal of the high voltage equipment.
A gap distance of 10cm was maintained and the voltage
and the spark gap Kf were adjusted to give a number of
breakdowns. This was repeated for four different voltages and the breakdown probability was taken. For comparison the gap was adjusted to 5cm and 3cm and the probability of breakdown was also recorded.
During the experiment the temperature, pressure, the wet and the dry mercury bulbs thermometer readings were recorded.
III. RESULTS ANALYSIS
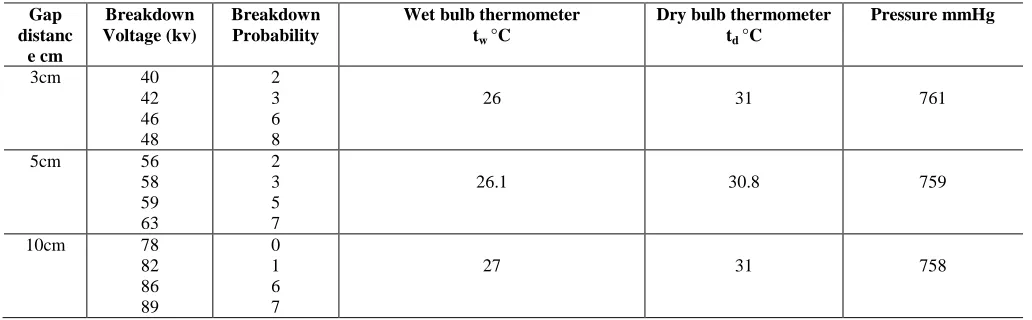
[image:2.612.43.559.541.701.2]The results of the tests are given in table 1.
Table 1
Breakdown Probability Voltage for Gap distances (3cm, 5cm and 10cm).
Gap distanc
e cm
Breakdown Voltage (kv)
Breakdown Probability
Wet bulb thermometer tw °C
Dry bulb thermometer td °C
Pressure mmHg
3cm 40
42 46 48
2 3 6 8
26 31 761
5cm 56
58 59 63
2 3 5 7
26.1 30.8 759
10cm 78
82 86 89
0 1 6 7
International Journal of Emerging Technology and Advanced Engineering
Website: www.ijetae.com (ISSN 2250-2459,ISO 9001:2008 Certified Journal, Volume 3, Issue 1, January 2013)
38 From the values given in table 1 for 10cm gap, the Gaussian cumulative distribution was drawn as shown in fig. 4
Fig. 4: Gaussian Cumulative Distribution Function
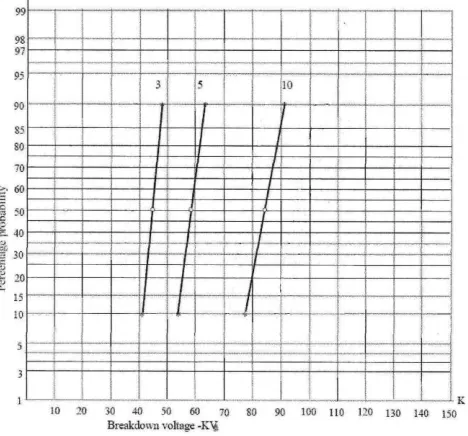
[image:3.612.72.267.174.339.2]The experimental values of Breakdown Voltage were plotted on a probability graph for 3cm, 5cm, and 10cm and is shown in fig. 5
Fig. 5: Breakdown Probability Graph
IV. CALCULATION OF V50% AND STANDARD DEVIATION
The distribution of flashover voltage of the gap is characterized by two parameters.
– called the critical flashover (CFO) or mean
flashover voltage
- called the standard deviation
The flashover voltage of the airgap expressed through
the 50% flashover level ( ), 10percent and the 90percent
were read out from the graph of fig. 5
(Mean or critical flashover voltage)
The standard deviation was calculated as
The standard deviation , and the mean is
The coefficient of variation
[image:3.612.53.287.412.630.2]The percentage of occurrence of overvoltage for the airgap of d = 10cm are tabulated using the Gaussian distribution as seen in table 2.
Table 2
Different Range of Voltage flashover probability in a Gaussian distribution
From the normal (Gaussian) distribution curve, the withstand voltage was estimated. The voltage range over
which the probability of flashover (CFO) was
1. is known as the statistical withstand
voltage and represents the point with flashover probability 0.13 percent.
2. is known as the statistical flashover
voltage (SFOV) and represents the point with flashover probability of 99.87 percent.
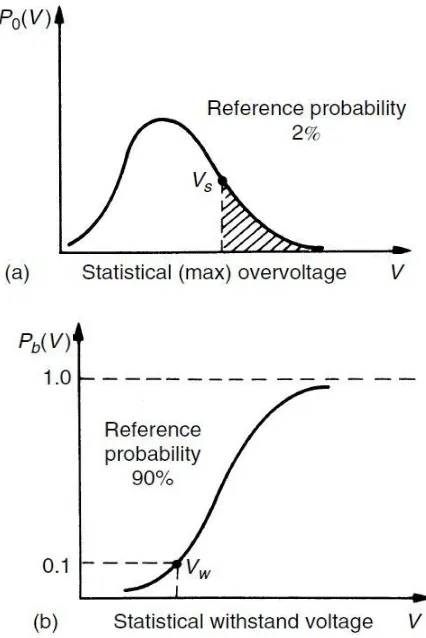
The 2% over voltage which is shown by the shaded portion is in fig. 6(a)
78 92 71 99 64 106
International Journal of Emerging Technology and Advanced Engineering
Website: www.ijetae.com (ISSN 2250-2459,ISO 9001:2008 Certified Journal, Volume 3, Issue 1, January 2013)
[image:4.612.64.277.146.465.2]39
Fig. 6: Statistical Overvoltage and Withstand Voltage
[image:4.612.51.279.565.695.2]It was not possible to find insulation such that the withstand distribution does not overlap with the overvoltage distribution. In the statistical analysis, the insulation is selected such that the 2% overvoltage probability coincides with the 90% withstand probability. This is shown in fig. 7.
Fig. 7: Method of describing the risk failure and safety factor
V. DISCUSSION
The experiment was carried out in February and the relative humidity was low, the pressure was almost equal to the normal atmospheric pressure, therefore, the correction factor had little effect on the flashover voltage.
The gap under test has a breakdown voltage between 80KV to 110KV and the CFO was 85KV. It was therefore necessary to use the standard lightning impulse test with the wave of 1.2/50µSec. Estimating the critical flashover voltage (CFO) using the statistical method (probability graph) gave a very close approximation to the values given by the formula for breakdown of small gap [9, 10, 11].
In engineering practice it would become uneconomical to use the complete distribution function for the occurrence of over voltage and for the withstand voltage of the insulation [2, 12, 13].
Fig. 6a represents probability of occurrence of over
voltage of such amplitude that only 2 percent (shaded
area) has a chance to breakdown. In figures 3 and 6b, the impulse breakdown occurs at 10 percent, and the voltage
is known as the statistical withstand voltage. When
fig.6a and fig.6b were plotted together as shown in fig.7, the failure risk could be determined from the figure (fig.
7).The failure risk fr is
(4)
Where
Probability of breakdown
Probability of occurrence of over voltage
the values of over voltage.
VI. CONCLUSION
Many researches have been carried out on long gaps because most practical situations are based on long gaps. The work was necessary because in small gaps, the calculation of field distribution will lead to a better understanding of breakdown characteristics because the secondary phenomena could easily be controlled. Once these mechanisms are thoroughly understood, the breakdown characteristics of very long air gaps have been known to follow the same pattern as small gaps.
International Journal of Emerging Technology and Advanced Engineering
Website: www.ijetae.com (ISSN 2250-2459,ISO 9001:2008 Certified Journal, Volume 3, Issue 1, January 2013)
40 The statistical approach of insulation co-ordination relates directly the electric stress and electric strength which requires the knowledge of distribution of both the anticipated stresses and the electrical strength.
For the purpose of co-coordinating the electric stresses with electric strength it was convenient to represent the breakdown voltages distribution in form of probability density function (Gaussian distribution curve) and the insulation breakdown probability by the cumulative distribution function.
The combination of these distribution functions became a viable tool for finding the risk of failure and the statistical safety factor for the insulation.
It is known that increasing the statistical safety factor (Ѕ.F) reduces the risk of failure but at the same time will increase in insulation costs. This will enable designers choose the level of statistical safety factor in terms of the type of insulation required (self restoring insulation etc).
Correction factor need to be applied because of the seasonal variation as a result of change in humidity pressure and temperature.
REFERENCES
[1 ] Begamudre, R.D. 2008. Extra High Voltage A.C. Transmission Engineering (3rd Ed.) New Age Int. Publishers.
[2 ] Kuffel, E., Zaengi, W.S., Kuffel, J. 2000. High Voltage Engineering Fundamentals. Butter Worth – Heinemann, Oxford. (2nd Ed.), pp.
460 – 499.
[3 ] Marzinotto, M., Mazetti, C., Schiaffino, P. 2005. Statistical Approach to the Insulation Co-ordination of Medium and High Voltage Cable lines. Power Tech, IEEE Russia.
[4 ] Farouk Rizk, A.M. 2009. Modeling of Proximity Effect on Positive Leader Inception and Breakdown of Long Air Gaps. IEEE Trans. On Power Delivery, Vol. 24, No. 4, pp. 2311 – 2319.
[5 ] Shunguang, G.U., Chen, W., Chen, J., He-Hengxin Quan, G. 2010. Observation of the Streamer Leader Propagation Processes of long airgap Positive Discharges. IEEE Trans. On Plasma Science, Vol. 38, No. 2, pp. 214 – 217.
[6 ] Fengnian, H. 2003. A New Statistical and Optimum to Lightning Insulation Co-ordination of Substation. Electrical Power Research, Vol. 23, No.2, pp. 129 – 137.
[7 ] Kara, A., Kalenderli, O., Marodikyan, K. 2006. Effect of Dielectric Barriers to the Electric Field of Rod-Plane Air Gap in Pro. Of the COMSOL, Users Conference, Prague.
[8 ] Fofana, I. Beroual, A. 2002. A model for long airgap discharge using an equivalent electrical network. IEEE Trans. Of Dielectrics and Electrical Insulations, Vol. 3, No. 2, pp. 273 – 282.
[9 ] Afa, J.T. 2010. Comparative Analysis of Breakdown Characteristics for small and long Airgaps. European Journal of Scientific Research Vol. 45, No. 1, pp. 324 – 332.
[10 ]Naidu, M.S., Kamaraju V. 2007. High Voltage Engineering. Tata McGraw-Hill Publishing Company Ltd., New Delhi.
[11 ]Razevig, D.V. 2008. High Voltage Engineering, Khana Publishers, New Delhi, India.
[12 ]Nowel, S.R. 2003. Electric Power Substations Engineering: CRS Press LLC, pp. 1 – 21.