2017 International Conference on Computer Science and Application Engineering (CSAE 2017) ISBN: 978-1-60595-505-6
Data Mining of Perishable Food Safety Sampling based on Voting
Anqi Hu* and Tongjuan Liu
Information School, Beijing Wuzi University, 101149 Beijing, China
ABSTRACT
Different models had been made, which by selecting the neural network algorithm, classification and regression tree algorithm and Bayesian network algorithm in the data mining software. Then the three concrete models were combined and the conditional statements were derived from the derived nodes. According to the principle that the minority is subordinate to the majority, an accurate and credible forecasting model had been built by the way of "vote for". The prediction model can predict the condition of perishable food, which innovatively guiding the safety inspection work; by choosing the safety rapid detection for typical effective sample of perishable food, effectively improve the efficiency and effectiveness of the inspection work. The prediction model avoids the deterioration of perishable food flowing into the market, and ensures the safe transportation of perishable food.
INTRODUCTION
analyses in-depth and applications of a large number of agricultural food test data, there are still no effective means so far [9-10].
Through consulting the current literatures both at home and abroad concerning the data mining [1-14]and food testing technology [15-18], it’s not common to apply data mining to food transportation metamorphism monitoring forecast to guide the actual food safety sampling work. It’s rarer to select a typical and effective sample for testing. Therefore, in order to meet people's requirements for perishable food’s quality and safety in transit, The three models, which were the neural network model, the Bayesian network model and classification and regression tree (CART) model, were established respectively and used to predict the same result simultaneously, and then the most accurate prediction result of the perishable food transportation metamorphism monitoring system was obtained to guide the actual typical sample test for perishable food safety, which had a strong practical value in ensuring the safety and quality of perishable food in transit.
EXPERIMENTAL DESIGN OF THE DATA MINING PROCESS
The process of data mining can be roughly divided into six stages [1-2]: 1) Business understanding
Business understanding was divided into three parts: the first part was the interpretation of the business background, the second part was the assessment of the resources, and the third part was target mining. Personnel, data, software and hardware were the four aspects of resource evaluation. This paper took strawberry metamorphism monitoring in transit as an example, personnel included those who can provide relevant basic data (such as the staff or partners of perishable food transportation monitoring companies) and those who can find out the mining target, obtain the mining result and get information for decision support (for example, the leadership of the logistics company’s monitoring center). Data referred to the data of business and logistics companies; Hardware referred to the response sensor which was used to collect temperature, humidity and mechanical damage during monitoring of perishable food metamorphism in transit. The software referred to taking the temperature, humidity and mechanical damage collected by hardware system during monitoring strawberry metamorphism in transit, as the source data. Then used data mining software clementine12.0 in the training set and test set to select the neural network algorithm, CART algorithm, Bayesian network algorithm and modeled them separately. According to the definition that the specific problem of the study object was transformed into the data mining problem, determined the mining target. For example, the specific problem of perishable food transportation metamorphism monitoring was "the prediction of whether or not degenerate".
2) Data understanding
metamorphism in transit and to the corresponding data description and then to the corresponding data quality test.
3) Data preparation
For data preparation, there were three steps: the first step was data selection, the second step was data preprocessing, and the third step was data transformation. Data selection was to simplify the process of data mining in order to achieve the purpose of obtaining raw data quickly. The process of data scrubbing, integration and protocol was data preprocessing. The quality of data preprocessing directly affected the effect of data mining. During preprocessing, if the parameter redundancy occurred, this problem will be solved by data transformation and dimensionality reduction, In order to reduce the dimension, performed the data transformation, and found a really useful feature from the initial characteristics of the data, thereby reducing the features and the number of variables, both of which need to be considered during the data mining process.
In this paper, took monitoring strawberry deterioration in transit as an example to perform the three steps to describe the data preparation:
The first step, the main reason for the deterioration of strawberry is microbial pathogens. Microbial pathogens are caused by changes in temperature, humidity, light and mechanical damage (mechanical damage can also cause the epidermal injury of perishable food, resulting in producing microbial pathogens), or directly brought from the field (infected leaves and soil). Therefore, selected the data from 6:00 a.m. to 24:00 PM, every fifteen minutes, measured temperature, humidity and mechanical damage of 1000 strawberries during monitoring them in transit to get 73 groups of data as experimental data, to use process of, and took the number of metamorphosed strawberries as the target data.
The second step, the data preprocessing is mainly to discretize the continuous values of temperature and humidity collected. For example, the temperature from -0.70C to 260C was divided into four stages respectively and expressed by 1 (low temperature: -0.90C ~ 0.90C), 2 (medium-low temperature: 10C ~ 100C), 3 (medium-high temperature: 110C ~ 200C), 4 (high temperature: 210C ~ 300C) ; humidity from 50% RH to 95%RH was divided into six stages with 1 (90% RH ~ 95% RH), 2 (76% RH ~ 89% RH), 3 (70% RH ~ 75% RH), 4 (65%RH ~ 69%RH), 5 (56%RH ~ 64%RH), 6 (50%RH ~ 55%RH), strawberries metamorphosed were indicated by 1, strawberries which had not been deteriorated were indicated by 0; mechanical damage data was got via calculating the number of strawberries with mechanical damage, so the data could meet the requirements of data mining.
The third step, data transformation was to reduce dimensions of monitoring data of perishable food in transit. In order to make monitoring data collected during the transportation dimension reduction, in the data mining experiment about perishable food metamorphism monitoring in transit, time and sequence number were both filtered, only three parameters, which include temperature, humidity and mechanical damage, and the discrete data corresponding to three parameter were saved.
4) Mining model building
attribute information, which was collected, as input, and taking the result of prediction as output. The neural network algorithm, the classification and regression tree algorithm, the Bayesian network algorithm were modeled respectively in the training set and the test set via the data mining software Clementine12.0, and then the three specific models were combined in series, allowing them to "vote" for the prediction of a model, obeying the principle that the minority is subordinate to the majority, thus obtaining the relatively accurate and reliable prediction model of perishable food metamorphism monitoring system in transit.). The second step was to select the mining technology, the third step was to choose the mining tool (In this paper, the data mining software clementine12.0 was used to model and predict based on the collected data), the fourth step was to build the model and the fifth step was to evaluate the model.
5) Mining result analyzing and decision making for the research purpose
Data mining result analyzing referred to the process of the analysis of the results of data mining using the useful pattern or the data that described the useful pattern, which had been presented via the visualization technology and the knowledge representation technology. Decision making for the research purpose referred to the process of developing strategies that were conducive to the research purpose based on the useful results derived from data mining, thus providing decision support for the research purpose. In this paper, took the strawberry metamorphism monitoring in transit as an example, based on the result of data mining model to judge whether strawberries were deteriorated to avoid the deteriorated strawberries' access into market, thus protecting the food safety interests of consumers.
Network Model Evaluation Standard
Data mining software Clementin12.0 provides a combination of three universal evaluation methods [11-12]: The first is numerical assessment; the second is graphical assessment; the third is to use the verification data (data segmentation) test model is good or bad.
Numerical Evaluation Standard
The numerical evaluation index includes three: the overall accuracy rate, precision rate (hit rate) and recall rate (coverage). The overall accuracy rate can be obtained directly from the correct rate shown in the partition table in the analysis report. The recall rate is based on the percentage of the coincidence matrix in the analysis report. In general, in predicting the final effect of the model, we must first ensure the overall accuracy of the model forecast, and then ensure that the model predicted hit rate, and then on this basis, try to improve the coverage of the model.
The overall accuracy rate: the correct rate of the entire sample. A represents a level (overall classification) probability. P represents the positive and negative numbers of the correct forecasts. With T means the total number of samples, the overall correct rate is calculated as.
A=P/T (1) Hits: Indicates the percentage of perishable food that is predisposed to perishable food by the model, which is an indicator of the accuracy of the model. The formula is:
(2) where V is the hit rate, p indicates the correct number of positive forecasts, and t
indicates the total number of positive forecasts.
Check the rate (coverage): that is accurately predicted by the model of food deterioration of the sample concentration of the actual percentage of deterioration. It uses an indicator to describe the accuracy. The formula is:
S = p/a (3) (3) where S denotes the coverage rate, p indicates the positive number of instances to be correctly predicted, a represents the actual number of positive instances.
Evaluation Chart Evaluation Standard
The higher left side of the cumulative chart represents a better model, rather than the cumulative extension of the left side of the graph, and the lower part of the right side shows a better model. Profit charts, response charts, performance charts, profit charts, and ROI charts are the most common assessment of universality. This paper selects the income table, response graph, and performance chart as the evaluation criteria based on the selected three models.
Gain charts: The judgment of a gain chart is mainly determined by the sign whether or not the line in the table steeply raised to 100% and then gradually became gentle. If yes, it was a good model, if not, it was a bad one.
Lift charts: The judgment of a lift chart was mainly up to whether or not the line in the table started from the left just at above 1.0 and its height kept stably at the same level when the user moved to the right. If it was, then the model was a good model. Otherwise, it was a bad one.
Response charts: The judgement of a response chart lied on whether or not the line in the table declined from 100% or more than 100% value, if it was yes, then it was a good model, or else, it was a bad one.
ESTABLISHMENT OF A NETWORK MODEL BASED ON PERISHABLE FOOD TRANSPORTATION DETERIORATION MONITORING
In the model development process, through the unused data to verify the model was a standard for the development of models, and this criterion can validate the model’s robustness. Before the model was built, data segmentation was required, in this paper, the sample data were split respectively by the training data in 50%, 60% and 70% proportions. That was the final samples were split into two parts including training data set which was used to train models and build models and the test data set which was used to evaluate the accuracy of the model.
Neural Network Model Evaluation Based on Perishable Food Transportation Deterioration Monitoring
but also has the very strong ability of parallel processing of distributed information [19-20], ANN has stronger robustness and fault tolerance of noise data.
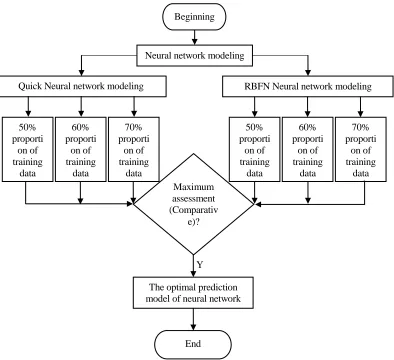
[image:6.612.102.496.114.474.2]Flow chart of neural network algorithm modeling evaluation map were shown in the Figure 1.
Figure 1. Flow chart of neural network algorithm modeling.
1) Numerical evaluation of Quick and RBFN parameter neural network with different proportion of training data
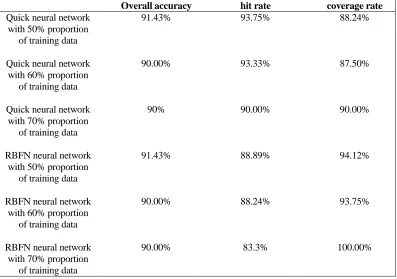
The corresponding formula was calculated by the analysis report data, the numerical evaluation of the Quick parameter neural and RBFN parameter neural network was shown in the TABLE I with different proportion of training data:
The following conclusion was drawn via comparing the data which were in the following statistical tables: Data segmentation was performed using neural network with 50% proportion of training data, both of the overall accuracies obtained respectively by taking the RBFN parameters calculated on the test set and taking the Quick parameters are 91.43%. But if the hit rate took Quick parameters, the obtained overall accuracy of the neural network would be higher than that calculated by RBFN parameters on the test set. Therefore, when the data segmentation was carried out with 50% proportion of training data, the prediction effect was better through the neural network model obtained by taking Quick parameters.
70% proporti on of training data Beginning 50% proporti on of training data
RBFN Neural network modeling
The optimal prediction model of neural network
End
Neural network modeling
TABLE I. COMPARISON OF THE NUMERICAL EVALUATION OF QUICK AND RBFN NEURAL NETWORK WITH DIFFERENT PROPORTION OF TRAINING DATA.
Overall accuracy hit rate coverage rate
Quick neural network with 50% proportion
of training data
91.43% 93.75% 88.24%
Quick neural network with 60% proportion
of training data
90.00% 93.33% 87.50%
Quick neural network with 70% proportion
of training data
90% 90.00% 90.00%
RBFN neural network with 50% proportion
of training data
91.43% 88.89% 94.12%
RBFN neural network with 60% proportion
of training data
90.00% 88.24% 93.75%
RBFN neural network with 70% proportion
of training data
90.00% 83.3% 100.00%
2) Evaluation chart evaluation
The Quick neural network and RBFN neural network evaluation map were shown in the Figure 2, Figure 3 and Figure 4:
Figure 2. Comparison of Response graph of the Quick neural network and RBFN neural network in training set and test set.
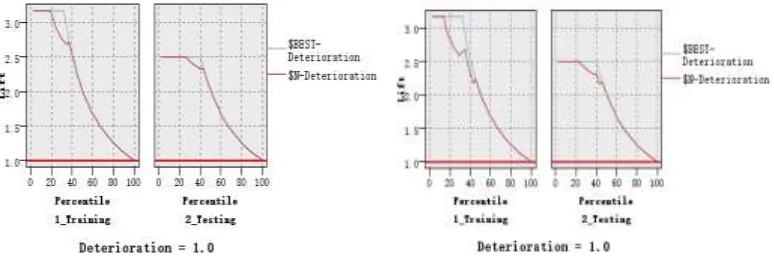
[image:7.612.128.494.426.581.2]Figure 3. Comparison of Gain graph of the Quick neural network and RBFN neural network in training set and test set.
Figure 4. Comparison of graph of Lift the Quick neural network and RBFN neural network in training set and test set.
It could be seen from Figure 2, Figure 3 and Figure 4: The Quick parameter and the RBFN parameter neural network were similar in the test set with different proportion of training data from the effect diagram. However, we could see that the right end red line was higher of Quick parameter than that of the parameter RBFN from the effect diagram.
Therefore, the Quick neural network on the test set has better prediction effect by 1) 2) with 50% proportion of training data.
Classification and Regression Tree Model Evaluation Based on Perishable Food Transportation Deterioration Monitoring
Classification and Regression Tree (CART) is a kind of decision tree technology applying to data set classification. It can automatically detect the potential structure, important patterns and relationships of highly complex data. The potential structure,
RBFN parameters Lift chart Quick parameters Lift chart
[image:8.612.114.501.304.441.2]important models and relationships of these highly complex data which were detected automatically, can construct accurate reliable prediction models, which are widely used in customer classification, insurance fraud, credit risk management and so on[21-22].
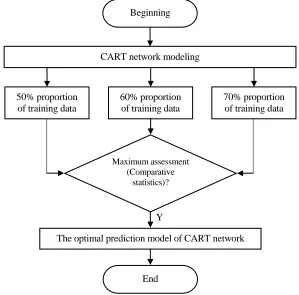
[image:9.612.147.446.124.419.2]Flow chart of CART algorithm modeling evaluation map were shown in the Figure 5.
Figure 5. Flow chart of CART algorithm network modeling.
The corresponding formula was calculated by the analysis report data, the numerical evaluation of the CART network was shown in the TABLE II with different proportion of training data:
TABLE II. COMPARISON OF THE NUMERICAL EVALUATION OF CLASSIFICATION AND REGRESSION TREE WITH DIFFERENT PROPORTION OF TRAINING DATA.
CART network with 50% proportion of
training data
CART network with 60% proportion of
training data
CART network with 70% proportion of
training data
Overall accuracy 80.00% 86.67% 85.00%
hit rate 77.78% 92.86% 88.89%
coverage rate 82.35% 92.86% 80.00%
The following conclusion was drawn via comparing the data which were in the above statistical tables: while performing the data segmentation with 60% proportion of training data, the obtained overall accuracy, hit rate and coverage rate via modeling on the test set were all higher than that of the other two methods both of which also modeled through data segmentation, therefore, data segmentation with 60% proportion of training data was finally performed on the test set to build the CART model in order to get a better predictive result.
Y
CART network modeling
60% proportion of training data
Maximum assessment (Comparative
statistics)?
The optimal prediction model of CART network Beginning
End 50% proportion
of training data
[image:9.612.95.498.528.609.2]Bayesian Network Model Evaluation Based on Perishable Food Transportation Deterioration Monitoring
Bayesian network combines probabilistic theory with graph theory to provide a natural and intuitive method for solving uncertainties. It is one of the most effective theoretical models in the field of uncertain knowledge representation and reasoning [23-24].
[image:10.612.100.497.189.552.2]Flow chart of Bayesian network algorithm modeling evaluation map were shown in the Figure 6.
Figure 6. Flow chart of Bayesian network algorithm modeling.
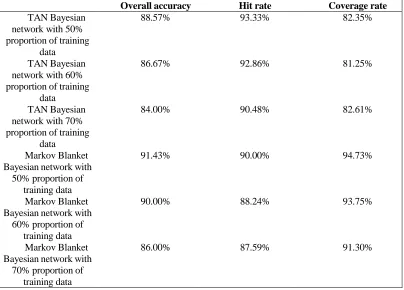
1) Numerical evaluation of TAN parameter and Markov Blanket Parameter Bayesian network with different proportion of training data
The corresponding formula was calculated by the analysis report data, the numerical evaluation of the TAN parameterand Markov Blanket Parameter Bayesian network was shown in the TABLE III with different proportion of training data:
70% proporti
on of training
data Beginning
50% proporti
on of training
data
Markov Blanket Bayesian network modeling
The optimal prediction model of Bayesian
network
End
Bayesian network modeling
Maximum assessment (Comparativ
e)?
Y 60%
proporti on of training
data
70% proporti
on of training
data
50% proporti
on of training
data
60% proporti
on of training
TABLE III. COMPARISON OF THE NUMERICAL EVALUATION OF TAN ANDMARKOV BLANKET BAYESIAN NETWORK WITH DIFFERENT PROPORTION OF TRAINING DATA.
Overall accuracy Hit rate Coverage rate
TAN Bayesian network with 50% proportion of training
data
88.57% 93.33% 82.35%
TAN Bayesian network with 60% proportion of training
data
86.67% 92.86% 81.25%
TAN Bayesian network with 70% proportion of training
data
84.00% 90.48% 82.61%
Markov Blanket Bayesian network with
50% proportion of training data
91.43% 90.00% 94.73%
Markov Blanket Bayesian network with
60% proportion of training data
90.00% 88.24% 93.75%
Markov Blanket Bayesian network with
70% proportion of training data
86.00% 87.59% 91.30%
The following conclusion was drawn via comparing the data which were in the above statistical tables: while performing the data segmentation with 50% proportion of training data, the obtained overall accuracy of the Markov Blanket Bayesian network was higher than that of the TAN Bayesian network, and got a better prediction result.
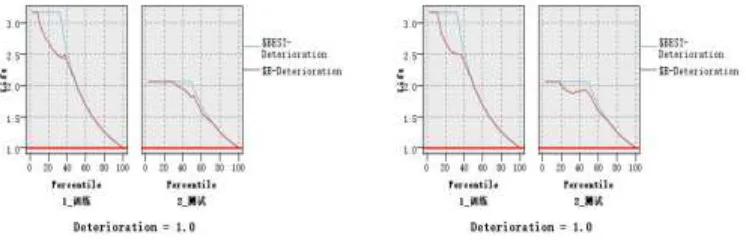
2) Evaluation chart evaluation
Figure 7. Comparison of response Graph Gain, graph and Lift graph of the TAN Bayesian network and Markov Blanket Bayesian network in training set and test set.
Figure 8. Comparison of Gain graph of the TAN Bayesian network and Markov Blanket Bayesian network in training set and test set.
Figure 9. Comparison of Lift graph of the TAN Bayesian network and Markov Blanket Bayesian network in training set and test set.
TAN parameters response chart Markov Blanket parameters response chart
TAN parameters Gain chart Markov Blanket parameters Gain chart
[image:12.612.121.494.497.617.2]It could be seen from Figure 7, Figure 8 and Figure 9: The TAN parameter and the Markov Blanket parameter Bayesian networkwith 50% proportion of training data were similar in the test set with different proportion of training data from the Profit Chart and effect diagram.
Therefore, Markov Blanket Bayesian network on the test set has better prediction effect by 1) 2) with 50% proportion of training data.
Combination Model Evaluation Based on Perishable Food Transportation Deterioration Monitoring
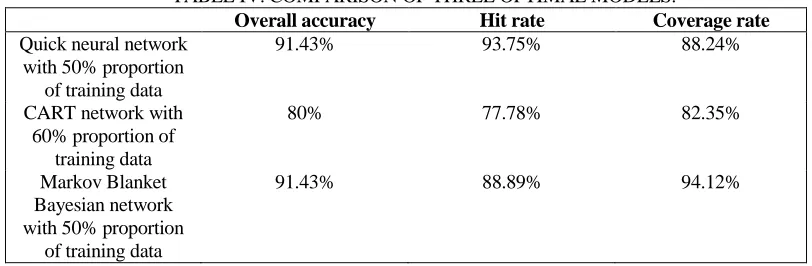
[image:13.612.94.500.324.457.2]The results of the numerical evaluation of the three models were shown in the TABLE IV.
It could be seen from TABLE IV: The Quick neural network model and the Markov Blanket Bayesian network model have the same prediction results, and are both higher than the prediction results of the classification regression tree model according to the principle that the minority was subordinate to the majority, The better prediction results of the poll were as follows. The accuracy rate was 91.43%, the hit rate was 93.75%, and the coverage rate was 88.24%.
TABLE IV. COMPARISON OF THREE OPTIMAL MODELS.
Overall accuracy Hit rate Coverage rate
Quick neural network with 50% proportion
of training data
91.43% 93.75% 88.24%
CART network with 60% proportion of
training data
80% 77.78% 82.35%
Markov Blanket Bayesian network with 50% proportion
of training data
91.43% 88.89% 94.12%
CONCLUSIONS
safety of perishable food in transit and protect the interests of consumers of perishable food.
In this paper, data mining technology was used to do a preliminary exploration of perishable food metamorphism monitoring in transit, and some results were achieved, but in theory and practice, there were still some limitations, and further study was still needed. At the same time, the number of samples also had limitations, in data mining, a large number of samples are needed to be collected, however, due to the conditional restrictions, in this research, only1000 strawberries were selected as samples. In order to meet the data mining requirements for large amounts of data, the number of samples needed to increase.
ACKNOWLEDGEMENT
This work was supported by funding project for Youth Talent Cultivation Plan of Beijing City University under the grant number (CIT&TCD201504051), this work was supported by Beijing outstanding talent training project (2014000020124G093) and Beijing Intelligent Logistics System Collaborative Innovation Centre.
REFERENCES
1. Xue W., CH HG. 2014. Data mining method and application of SPSS Modeler. Data Mining Technology Works, Inc., pp. 1-327.
2. Xiong P. 2011. Data mining algorithms and Clementine practices. Data Mining Technology Works, Inc., pp. 1-200.
3. He J. 2016. “The development trend of data mining technology,” Western leather, 24: 21.
4. Hsieh N. C., Hung L. P. 2010. “A data driven ensemble classifier for credit scoring analysis,” Expert Systems with Applications, 37(1):534-545.
5. Magpiesensing.com. 2013. “Sensing Cold Chain Analytics and Monitoring,” mapiesensing.com/wp-content/uploads/2013/01/Cold Chain Analytics Magpie Sensing-Whitepaper.pdf. (Accessed July 2013).
6. Centers for Disease Control and Prevention, Vaccine Storage and Handling, www.cdc.gov/vaccines/pubs/pinkbook/vac-storage.html#storage (accessed July 2013).
7. A. Zaleski. 2012. “Magpie Analytic System Tracks Cold-Chain Products to Keep Vaccines,
Reagents Fresh,”
technicallybaltimore.com/profiles/startups/magpie-analytics-system-tracks-cold-chain-products-to-k eep-vaccines-reagents-fresh (accessed February 2013).
8. Zhu J., Zhang P., Gao Zh. G. 2014. “Application of large data mining technology to early warning of agricultural food safety risk of imported and Exported Foods,” Agricultural Economy, 3:99-102. 9. Gao X. F., Yang D. J. 2014. “A comparative study of food safety risk warning at home and abroad,”
Chinese Health Engineering, 13(03):254-256.
10. Xue S. J., Chen F. 2011. “Research on data mining technology in telecom customer churn warning system,” Microcomputer and Application, 30(21):49-52.
11. Du S. J. 2013. “Evaluation of data mining model based on Clementine,” Software and Application of
Computer CD, 8:263-265.
12. Wu Zh. Y. 2006. “Application of data mining in customer churn,” University of Electronic Science and Technology of China, Chengdu: 63-64.
13. Ren X. D., Chen J. Y. 2016. “Research on current situation and development trend of data mining,” Information Communication, 02:171-172.
15. Yang W. Y., Shun Y. M., Zhou Y., Wu M. F. 2012. “Application of rapid detection technology in the safety control of fruits and vegetables,” Journal of Anhui Agricultural Sciences, 40(01):147-149. 16. Li X. Y. 2014. “Research and Discussion on rapid detection technology of food safety,” Food
Research and Development, 9(18):120.
17. Gao G. 2015. “How to improve the overall effect of food safety testing,” Changchun Shuanyang District Food and Drug Administration, 27:119.
18. Ma X. N., Du M. H. 2015. “Development and Prospect of rapid detection instruments in the field of food safety,” Journal of Food Safety and Quality Control, 05:1828-1833.
19. Morton H. 2011. “Municipal credit rating modelling by neural networks,” Decision Support Systems, 51(1):108-118.
20. Xu Y. Y. 2013. “Analysis and discussion of retail merchandise promotion data based on classification,” Regression Tree and Neural Network Model, 15(09):22-24.
21. Qin X. B., Chen Y. Y., Xu Q. S. 2013. “Personal credit objective scoring system based on classification regression tree,” Mathematical Theory and Application, 33(01):28-37.
22. Wang W., Xue F. Ch., Sh. DW, Wang X. J. 2016. “Study and application of summer drought prediction model based on CART algorithm,” Meteorological Science, 15(09):22-24.
23. Liu Y. Ch., Cheng Sh. W., Feng J. D., Xu X. J., Zhu T. L., Fang Y. Sh. 2012. “Traceability and early warning of vegetable quality and safety based on Bayesian network,” Meteorological Science, 20:188-190.