DYNAMIC SHEAR DEFORMATION IN ZINC CRYSTALS
Thesis by
Kenneth Robert King
In Partial Fulfilhnent of the Requirem.ents For the Degree of
Doctor of Philo50phy
California Institute of Technology Pasadena. California
PART
1.
II. III. IV.V.
VI.TABLE OF CONTENTS
TITLE ACKNOWLEDGEMENTS ABSTRACT
LIST OF TABLES LIST OF FIGURSS INTRODUC TIO:\"
MATERiAL AND SPECIlvlEN PREPARATION EQUIPMENT AND TEST PROCEDURE
Stress Application
rV;:easur2-,~cnts of Stress and Strain Static Tests
Temperature Control and Measurement Method of Observing Dislocations
EXPERiMENT .t\L RESULTS Static Tests
Rapid Loading Tests Etch-pip Observations DISCUSSION OF RESULTS
Proposed Dislocation Mechanism
Determination of Density and Average Velocity of Moving Dislocations
Quantitative Comparisons Between Zinc~ Lithium Fluoride. and Silicon-Iron
Plastic Resistance
ACKNOWLEDGEMENTS
The author wishes to express his thanks to Professor
Do S. ·Wood and Professor D. S. Clark~ who directed this research, for their guidance and support, as well as for thei r patience.
Professor T. Vreeland, Jr., contributed many valuable suggestions during the course of this research and his continuing intere st and assistance is appreciated. Mr. K. H. Adams and Mr. R. C. Brandt were especially helpful in providing advice and instruction in the proper techniques for obtaining etch-pip observations in zinc.
The author is indebted to the Union Carbide Corporation and the Shell Oil Company for fellowship grants. The course of the experimental work was greatly facilitated by a grant from the
American Society for Testing and Materials which was employed to purchase one of the oscilloscopes. The testing program was
ABSTRACT
The initial stages of yielding in single crystals of zinc have been investigated at temperatures of _292oF (_180oC), _930F (_70oC) and +750 F (24oC), by means of rapidly applied constant stress pulses to produce slip along the basal planes of these crystals.
The experimental results are interpreted in terms of a disloca-tion mechanism based upon the assumpdisloca-tions that the average velocity of dislocations remains constant during the period of constant applied stress and that the density of moving dislocations increases in linear proportion to the plastic strain. The experimental curves of plastic strain vs. time exhibit the form predicted by the assumed dislocation mechanism. The average dislocation velocity is found to be propor-tional to the 2. 5 po~er of the excess of the applied stress over the static yield stress. The purity of the specimen and the test tempera-, ture are found to influence the average dislocation veloci ty only through
their influence upon the static yield stress.
These results show that the behavior of basal slip dislocations In Zlnc is qualitatively the same as the behavior of slip dislocations in lithium fluoride and silicon-iron, as reported by Johnston and
Gilman and by Stein and Low, respectively. Hence it is concluded that the concept of a lattice resistance to dislocation motion proposed by Gilman to explain the observed behavior of lithium fluoride and silicon-iron can be applied equally well to explain the observed behavior of
TABLE
I
II III
LIST OF TABLES
TITLE
Critical Resolved Shear Stress in Static Tests Results of Rapid Loading Tests
Experimental values of
v
and p for k = 57 cm-l oPAGE
26
LIST OF FIGURES
FIG. NO. TITLE
1. Test Specimen.
2. Schematic View of Shock Tube Showing Methods for
Applying Load Rapidly to Specimen. (a) Shock Tube
PAGE
8
Operation. (b) Quick-Opening Valve Operation. 12
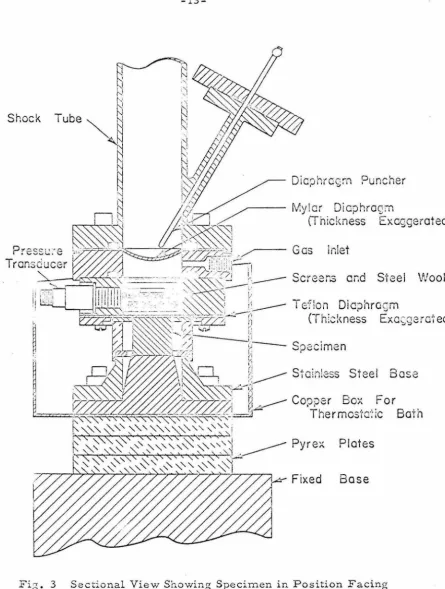
3. Sectional View Showing Specimen in Position Facing
End of Shock Tube.
4. General View of Rapid Loading System.
50 Static Stress vSo Strain Curves for Nitrogen Doped Specimen.
6. Static Stress vs. Strain Curves for Specimen of
99.99
Per Cent Purity.
7. Static Stress vs. Strain Curves for Specimen of
99.999
Per Cent Purity.
8. Oscilloscope Records of Rapid Loadi.ng Tests.
Nitrogen Doped Specimen. (a) Shock Tube Operation)
13
17
23
24
25
75 of. (b) Quick-Opening Valve Operation~ -93 OF . 28
9.
Plastic Strain vs. Time and Strain Rate vs. Time.Nitrogen Doped Specimen~ 750F. Applied Resolved Shear Stress 37.4lb/in.2•
10. Plastic Strain vs. Tinle and Strain Rate vs. Time.
Nitrogen Doped Specimen. -2920F. Applied Resolved
29
Shear Stress 63.3 Ib/in.2. 30
11. Plastic Strain vs. Time and Strain Rate vs. Time.
Specimen of
99.999
Per Cent Purity (No. 38)~ 750F. [image:6.535.63.490.102.681.2]FIG. NO. TITLE
12. Plastic Strain vs. Tirrle and Strain Rate vs. Tirrle. Specirrlen of
99.99
Per Cent Purity. 7SoF. Applied Resolved Shear Stres s 2b.3 Ib/in. 2, Interrupted. 13. Plastic Strain vs. Tirrle and Strain Rate vs. Tirrle.Specirrlen of
99.99
Per Cent Purity, -292oF. AppliedPAGE
33
Resolved Shear Stress 34.0 Ib/in. 2. 34
14. Plot of kV: vs. (1"-'f ). Y
15. Etch-pips on (IOTO) Plane in Nitrogen Doped Specirrlen, lOOX. {a} After Rapid Loading Test at -930 F in which a Total Plastic Shear Strain of 375 x lO-b in • lin. was Measured. (b) Annealed in Vacuo at 7000F for 1 hr. and Re-etched.
37
[image:7.542.58.473.91.719.2]
-1-1.
INTRODUCTIONThe dislocation concept was first introduced into the field of crystal plasticity nearly thirty years ago. Since that time it has won universal acceptance and has been employed as the basis for the ex-planation of a wide variety of experimentally observed phenomena. However, it is only in the last ten to fifteen years that workers have begun to find techniques to isolate and study individual dislocations.
Thus, although the experimental evidence strongly supported the case for the existence of dislocations, very little was known about their individual properties. Attempts to describe the macroscopic plastic deformation of crystals, and of polycrystalline materials as well, in terms of these poorly defined entities led to many conflicting theories based upon differing assumpti?ns as to their individual and collective properties. As more is learned about the properties of the individual dislocations, it becomes possible to resolve some of these questions and to eliminate some of the theories.
Macroscopic plastic flow depends on how many dislocations are moving in a crystal and on how fast they are moving. In the past~ it was assumed that the dislocations were not severely limited in velocity, . except as the velocity of shear waves in the crystal was approached.
-2-source or dislocations pinned by Cottrell atmospheres or
Peierls-Nabarro forces. Various efforts were made to explain the observed
flow behavior in terms of intersections between the moving dis10cations
and other dislocations and defects in the crystal lattice but these
explanations were often found to be inadequate.
>:C
Three years ago. however, Johnston and Gilman (l) were
able to measure, for the first time, the mobilities of individual
dis-locaticns. Dislocations in lithium fluoride crystals were caus ed to
move by the application of stress pulses,. Etch-pit techniques were
used to locate the dislocations before and after their movements. It
was found that dislocations in lithium fluoride accelerate very quickly
and then move with constant velocity if a constant stre ss is applied to
them. Below a certain stress, no dislocation motion occurs, but
once having begun to move, dislocations increase their rates of motion
very rapidly with further increases in the applied stress. At the lower
stresses, corresponding to low dislocation velocities, the dislocation
velocity increases approximately as the twenty-fifth power of the
applied stress.
These observations led Gilman (2) to the conclusion that there is
a quasi-viscosity Or "plastic resistance" associated with dislocation
motion in lithium fluoride. Gilman also showed that the macroscopic
yield stress of a crystal could be explained on the basis of its plastic
resistance. This was done by showing that a definite correlation exists
-3-between the yield stresses of different lithium fluoride crystals, or crystals subjected to different treatments, and the stress that is needed to make dislocations move in them at a certain velocity. Specifically~ it has been found that the difference in stress required to produce the
same dislocation velocity in two crystals is just equal to the difference in their yield stresses (1,3). Finally, Gilman showed that the flow stress of crystals varies in a systematic way with the lattice structure of the crystal, with the elastic modulus, with the glide planes on which the dislocations move, and with the electronic structure or chemical bond type of the crystal. In this way, the plastic resistance of the crystal was related to the lattice structure and to the core structures of the
dislocations.
Stein and Low (4) have us ed techniques similar to those us ed by Gilman and Johnston to observe the mobility of edge dislocations in silicon-iron- crystals, and have found that these crystals exhibit plastic resistance and behave qualitatively much like lithium fluoride. Thus, in two rather different types of crystals, there is now direct evidence that plastic resistance controls plastic flow. Gilman (2) presents a strong argument that this is true for all crystals. If so, then the earlier mechanisms, such as Cottrell locking, Frank-Read sources, and the various dislocation intersection mechanisms, while still valid, will no longer be assumed to dominate the flow behavior. The adoption of this
-4-To investigate the applicability of the plastic-resistance concept
to other materials, the mobilities of individual dislocations in these
materials should be studied. In addition, the macroscopic yield
behavior of these materials should be re-examined in the light of the
plastic-resistance concept to determine whether an interpretation on
this basis presents an acceptable alternative to previously suggested
inte rpretations. An application of the plastic -resistance concept to
macroscopic yield behavior is illustrated by the following example.
A distinct delay time has been observed for the initiation of
yielding under constant stress in polycrysta11ine steel (5) and
moly-bdenum (6) {body centered cubic metals}. An initial preyield
micro-strain~ attributed to the build-up of dislocations at the grain
boundaries (7)~ is followed by a rapid increase in both strain and strain
rate as the dislocations are able to break through the grain boundaries
and cause macroscopic yielding in the specimen. Recent studies (8)
indicate that the presence of grain boundaries is necessary for the
existence of the delayed yield phenomenon in steel. Evidence to the
contrary has been presented by Kramer and his co-workers (9,10,11,12),
however. They have reported the existence of delayed yielding in single
crystals of iron and f3-brass (b. c. cJ~ zinc (h. c. p.), and in prestrained
aluminum and copper (f. c. c.).
The behavior observed in single crystals may be the result of a
different mechanism than the one causing the delayed yield in
poly-crystalline materials, however. An examination of a strain vs. time
record for an aluminum single crystal (11) indicates that the plastic
-5-during the early stages of plastic deforlnation. In this case the de-finition of a delay tilne depends upon the arbitrary choice of the
lnagnitude of plastic strain that defines the beginning of macroscopic yielding. This differs considerably from the case of polycrystalline steel.. The delay tilne for yielding in steel is defined by the transition from a period in which the strain rate is slowly decreasing to one in which it increases rapidly and quickly reaches a large value. If the dislocation velocities in the crystals studied by Kralner are strongly dependent upon stress, as they are in lithium fluoride and in silicon-iron. then the apparent delay time reported by Kralner lnight be ex-plained in terms of the time r~quired for a sufficient amount of dis-location lnotion to produce a lneasurable plastic strain. Thus7 a cOlnbination of the plastic resistance concept with some type of
dis-location multiplicationproces s lnight provide a more reasonable interpre-tation of this phenomenon.
The purpose of the present investigation is to learn lnore about the yield lnechanism in zinc single crystals by means of rapid loading experilnents, and to deterlnine whether the concept of a plastic
resistance, as obs erved in lithium fluoride and in silicon-iron, can be applied to the observed behavior of zinc. This is accomplished by experilnents in which macroscopic strain is measured as a function of
,'c tilne while the crystal is subjected to a constant stress. Etch-pip'
,!-=
-6-observations are employed to determine the number of dislocations
taking part in the plastic flow. The stress dependence of the average
dislocation velocity can then be deduced from these measurements.
The effects of temperature and impurities in the zinc crystals upon
the results are investigated. The possible existence of a d~lay time
for yielding is also considered.
Considerable care has been taken to develop a method of loading
which gives a sufficiently uniform stress distribution to obtain a
well-defined yield point under static te sting conditions. This point is
emphasized because previous work (13,14) has shown that the sharply
defined static yield stress in zinc single crystals is easily suppressed
by small stress concentrations. Such stress concentrations also are.
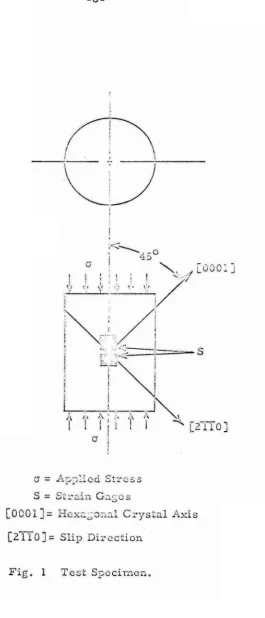
-7-II. MA TERIAL AND SPECIMEN PREPAR..I\ TION
Zinc crystals of three purities were investigated: 1) 99.999
per cent; 2) 99.99 per cent; and 3) 99.99 per cent with nitrogen added.
The addition of nitrogen was accomplished by bubbling gaseous nitrogen
through the melt for 10 hr 0
Spherically shaped single crystals 1-3/4 in. in diameter were
grown in ~uo in graphite coated pyrex glass molds by means of the
procedure described by Stofel (lS). Cylindrical specimens 1 in. in
diameter and 1 in. long were cut from these spherical crystals by
means of acid machining techniques in order to avoid damage to the
crystals. The orientation of the specimen with respect to the
crystal-lographic axes was chosen so that both the slip plane (0001) and slip
direction <2TIO> of the crystal were inclined at 450 to the cylinder
axis} as shown in Fig. 1. Thus when a given axial compressive stress
was applied to the cylinder the maxir"-lUm possible resolved shear
stress was obtained on a single slip system.
The details of the technique employed to produce test specimens
of the desired orientation from the spherical crystals were as follows:
First, the approximate orientation of the spherical single crystal was
determined by etching with a 1:1 solution of hydrochloric acid and
water. This etch produces six broad bands on the surface which meet
at two common poles. The direction defined approximately by the
diameter passing through these two poles is the hexagonal axis of the
-8-fT\
I ; \
,
.
----~'---~
;
~
S == St::. .. ain GaGes
[zTIoJ
== Slip Direction [image:15.535.160.426.45.665.2]-9-50F/min (30C/min), to liquid nitrogen temperature. (This low cooling
rate was employed in order to prevent plastic flow and the formation
of cracks due to thermal stress.) Several thin chips were then
successively removed from the surface at one of the poles by cleaving
on the basal planes. A flat surface about 1 in. in diameter was thus
obtained which served as a crystallographic reference surface·. The
slip direction was determined from observations of twin traces on the
basal plane of removed chips.
After cleaving, the spherical crystal was cemented to a fixture
which permitted a second flat surface to be machined at 450 to both the .
,',
basal plane and the slip direction. An acid lapping wheel' was used
for this operation. This new surface then became the reference
':C':C surface for the machining of the cylindrical surface on an acid lathe.
This procedure produced a cylinder 1.000 in. in diameter and about
1-1/2 in. long. An acid saw )!c** was then employed to cut the specimen
to within about 0.020 in. of the finished length. Finally~ the sawed
ends of the specimen were flattened with wet 600 silicon carbide paper,
afte r which an additional 0.003 to 0.004 in. was removed with nitric
'!<':c'!<
The acid lapping wheel is a rotating disc which dips into a 1:1 nitric acid and water solution and rubs against the spherical crystal. The crystal is rotated about an axis perpendicular to the surface of the wheel as it is being lapped.
The acid lathe has been described by Stofel (14).
-10-acid. Examination under a microscope indicated that this last step
was sufficient to remove the deformation introduced by the abrasive.
Since only the initial stages of yielding are being studiedin this
investigation, very little deformation is introduced into a specimen in
a. ,::;iven test. For this reason, it is possible to perform repeated tests on the same specimen and thus to avoid errors arising from differences
between specimens. After each test, the specimen is annealed at a
temperature of 7000 F {370oC} for one hr. Fresh strain gages are then
attached and allowed to dry for at least two days at room temperature.
To verify the effectiveness of this annealing treatment in returning
the specimen to its original state, several static tests were performed
on one specimen, annealing after each test. A systematic change in
the yield stress was not observed in these tests, although random
variations of 1 to 2 Ib/in.2 were found to occur from one test to the
next {see Figs. 5 and 6}. Sitnilar observations on the effect of
annealing procedure were made by Li, Washburn and Parker (16).
A total of six specimens were studied: one nitrogen doped, one
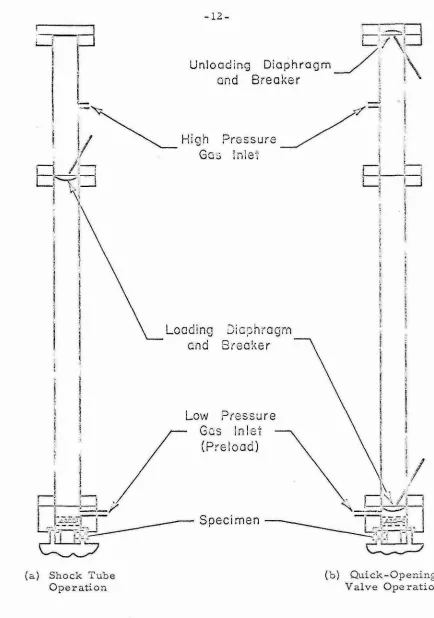
-11-III. EQUIPMENT AND TEST PROCEDURE
Stress Application
A shock tube 1S employed to apply a uniformly distributed
pressure rapidly to one end of the cylindrical specimen. This shock
tube is 31 ft. long, has an
1.
D. of 1-1/2 in., and is mounted in a verticalposition as shown schematically in Fig •. 2. The specimen faces the
bottom end of the shock tube and is supported as shown in Fig. 3. The
specimen rests on a flat stainless steel base, separated from it by a
0.002 in. layer of teflon to improve lubrication and load distribution.
A thick-walled brass cylinder surrounds the specimen and is also
supported by the stainless steel base. This cylinder supports a plate
with a hole in it about 0.010 in. larger than the specimen diameter.
The height of the bras s cylinder can be adjusted so that the top surface
of this plate is flush with the top surface of the specimen. A 0.002 in.
thick teflon diaphragm covers both the plate and the specimen and is
fastened to the end of the shock tube. Thus, the end of the shock tube
is sealed while at the same time the shock pres sure acts uniformly on
the specimen. The stainless steel base rests in a copper box which
serves as the container for liquid thermostatic baths. Beneath the
copper box are three 1/2 in. thick glass plates for thermal insulation.
The stainles s steel base, copper box, and glass plates are all bolted to
a heavy steel back-up block. This block is arranged to travel up and
down on a short vertical track to permit installation of the specimen and
positioning of it against the end of the shock tube.
Loading Dic:Jhragrn
and Breaker
Low Pressure
Gas !nlet
(Preload)
I
I
I
t /
r-'i
1-,
'-,
<
;i,
I
~-
..
-1
J_y
~
1
J~J-Jj
L,:-t~:~~~
Specimen
~~~~~L
25
es
(a) Shock Tube Operation
(b) Quick-Opening Valve Operation
[image:19.534.51.485.41.659.2][image:20.539.53.498.62.651.2]
-14-pressure cylinder is adm.itted to the section of the tube above the thin
m.ylar diaphragm. near the top {see Fig. 2a} and the pressure is
adjusted to som.e predetermined value. A 10 to 20 1b/in.2 preload
pressure is also applied to the specimen by adm.itting nitrogen to the
lower section of the tube. The diaphragm is then broken by m.eans of
a solenoid-operated puncher and a shock wave travels down the tube
and reflects off the specimen, thus applying a uniformly distributed
load. The load rem.ains on the specimen until an unloading wave
reaches it from. the top end of the tube. Screens and steel wool are
placed in the bottom. end of the tube, just above the specimen, to
,Pre-vent the pressure from. rising so rapidly that elastic waves are
excited in the specimen or its back-up support. The pressure rises to
its final value in about 0.4 millisec and remains constant for about 10
millisec. Pressures up to about 125 lb/in.2 have been employed in
the se experiments. The equipment is capable of much higher
pressures. Difficulties are encountered in m.aintaining a constant
shock pressure on the specim.en at the higher operating pressures,
however.
When longer load durations are desired, the shock tube is
operated as shown in Fig. 2b. The diaphragm is moved to a position
just above the specimen, where it can be broken by another
solenoid-operated puncher. - In this case, there is no time for a shock front to
build up and the pressure behind the diaphragm is the pressure that is
applied to the specim.en. Thus, the bre.aking diaphragm. simply serves
-15- .
final value in about 0.8 rnillisec in this case and remains until
released. Since repeated tests are made on the same crystal, it is
usually desirable to release the pressure rather quickly in order to
avoid deforming the specimen exces sively. For this reason, the upper
section of the tube is inverted so that the upper diaphragm-breaker
faces the top of the tube. A delay circuit makes it possible to break
the diaphragm at this end of the tube, thus releasing the load, at any
desir~d time interval after the lower diaphragm has been broken. The
total resolved shear strain produced in each test was limited to 0.1
per cent or les s.
Measurements of Stress and Strain
The pressure acting on the specimen during a test is measured
by means of a SLM Pressure Indicator manufactured by the Kistler
Instrument Company. This device consists of a quartz piezo-electric
pressure transducer and an amplifier unit. The transducer is located
near the bottom end of the shock tube, just above the specimen. The
output from this unit is displayed on one channel of a Tektronix 555
dual beam oscilloscope.
Four SR-4 type A-18 resistance strain gages are cemented to the
specimen and connected together to form a bridge circuit. The strain
measurements are obtained by amplifying the strain gage output by
means of a high gain preamplifier on the other channel of the 555
oscilloscope ~ Usually, the strain gage output is also displayed at a
different gain on a second oscilloscope. The oscilloscope sweeps are
diaphragm-
-16-breaker. Polaroid cameras are used to record these signals. The
total strain occurring during a test is also measured independently
by means of a Baldwin Type-N Strain Indicator. A general view of
the rapid load testing system is shown in Fig. 4.
Static Tests
Static tests are performed by bleeding gas slowly into the shock
tube and recording the pres sure as indicated on bourdon tube pres sure
gages together with the strain as indicated on the Baldwin Strain
Indicator. This method does not produce the immediate drop in stress
generally associated with a sharp yield point because the loading
system is an extremely "softl! one. The pressure is reduced manually
as soon as rapid yielding is observed, however. This usually prevents
excessive strain in the specimen. If the strain is not excessive, the
pressure is again increased slowly and additional strain readings are
taken. Since these latter measurements generally show strain to be
taking place at stresses below the upper yield stress, a drop in stress
is actually observed in such cases, although not in the form obtained in
the more conventional II stiff" testing machines. In the cases whe re the
pressure is not increased again, the amount of strain which has taken
place is itself an indication of the sharpness of the yield point and the
associated drop in load.
Temperature Control and Measurement
The method employed to obtain the lower test temperatures
-18-tnediutn in each case, but the tnain features are the satne. The
specitnen is first installed and raised into position facing the end of
. 0
the shock tube, as in the room tetnperature (75 F) tests. The cooling
medium is then introduced at a controlled rate into the copper box
surrounding the specim.en assembly. Cooling is achieved entirely by
means of conduction through the stainless steel specimen support and
by contact between the specimen and the cold gases in the box; the
specimen is never submerged in the liquid coolant. The rate of cooling
is limited to 50F Itnin (30C/m.in) or less in order to avoid plastic flow
due to therm.al stresses.
For the tests at _930F, freon 11 (CC'('3F) is poured into the
copper box to a depth of about 3
14
in. Freqn 11 remains in the liquido 0
state from. 75 F to be low - 93 F and serve s as a he at conduc ting
m.edium. between the specimen assem.bly and the dry ice which is used
as the cooling medium. The specimen temperature is continuously
monitored during the cooling proces s and dry ice is added at regular
and frequent intervals in such amounts as are necessary to maintain
the de sired cooling rate. When the equilibrium temperature is reached,
the bottom of the box is covered with dry ice.
o
For the tests at -292 F, liquid nitrogen is continuously dribbled
into the copper box from one or more of three styrafoam containers.
The cooling effect in this case is achieved by the vaporization of the
nitrogen and through the nitrogen vapor itself. The rate of cooling is
controlled by varying the rate at which liquid nitrogen is allowed to
-19-the bottom of -19-the box is filled with liquid nitrogen to a depth of l/Z to 3/4 in. The strain gages on the specimen are covered with small pieces of felt in order to eliminate high frequency thermal noise caused by contact with the nitrogen vapor.
Iron-constantan thermocouples are used to measure the temperatures in the neighborhood of the specimen. The accuracy of measurement is estimated to be ± ZOF. A brass dummy specimen, with thermocouples located in the center and on the top surface, was employed to determine the amount of temperature variation within the specimen and between the specimen and surrounding parts. The thermal conductivities of brass and zinc are approximately the same. A difference between the temperatures at these two positions in the specimen could not be detected at any stage during cooling or testing. The application of the preload pressure did not produce a measurable change in the temperature of the specimen. The maximum error in the measurement of temperature differences and temperature variations
o is 0.5 F.
A thermocouple located in the brass cylinder which surrounds the specimen was used to indicate the temperature of the specimen during the actual tests. The temperatures at this point were found to be about 50F cooler than the specimen itself during cooling and either 3 or 60 F warmer than the specimen at the equilibrium temperature, depending upon the temperature of the test. The bottom end of the
-20-carbon dioxide or nitrogen gas in the copper box is somewhat warmer than it would otherwise be, however, so that the specimen temperature at equilibrium is 10 or 2SoF warmer than the dry ice or liquid nitrogen. Once equilibrium is reached. the specimen temperature remains
constant to within ± 10F.
Method of Observing Dislocations
Observations of dislocation densities and distributions in annealed and deforlTIed specilTIens provide a link between the macroscopic strain measurelTIents and the behavior of individual dislocations. These
observations are obtained by means of an etching technique developed by Brandt. AdalTIs and Vreeland (17). ·The surface of the specimen is first prepared by chelTIical polishing, after wh'ich the spe cilTIen is dipped in a solution which introduces lTIercury to the surface. A subsequent polish results in the formation of slTIall pips at each point where a dis-location intersects the surface. This technique reveals disdis-locations on
{loTo} prism planes of zinc. The cylindrical surface of the specimen is tangent to {loTo} planes along two elements of the cylinder on
opposite sides of the specimen from one another. These are the same . positions at which the strain gages are attached to the specimen. as
shown in Fig. 1. Good etch figures can be obtained on surface s
oriented within 50 of the {loTo} planes. so that dislocations in a band about 0.1 in. wide on each side of the specimen can be observed by this method.
-21-that these observations can only be znade after the final test on a
given speciznen. Therefore, in order to obtain observations of the
same specimen in both the defortned and annealed states, the defortned
specitnen is polished and etched iznznediately after its final test and
photoznlcrographs are tnade of the areas of interest. Then the
specitnen is given a standard annealing treatznent of one hr. at 700oF.
It is annealed in vacuo, however, rather than in a hydrogen atmosphere,
in order to remove as much of the tne rcury as pos sible frotn the
surface. Finally, the specitnen is repolished and re-etched to reveal
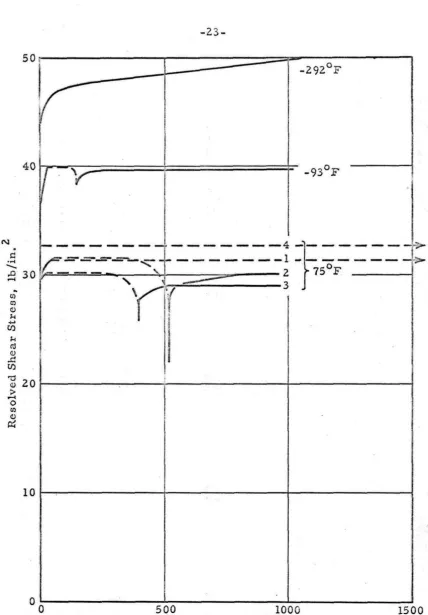
-22-IV. EXPERIMENTAL RESULTS
Static Tests
Curves of resolved shear stress vs. resolved shear strain as
detertnined by static tests are shown in Figs. 5, 6, and 7 for the
nitrogen doped specimen, the specimen of
99.99
per cent purity, andone specimen of
99.999
per cent purity, respectively. Dashed linesare regions where the strain took place so rapidly that it was imposs ible
to obtain readings on the strain indicator. Four tests were performed
at 750F ~240C) on the nitrogen doped specimen, and three at this satne
temperature on the specimen of
99.99
per cent purity. The curves forthese tests are numbered in the order in which the tests were
per-fortned. These are the only two cases in which more than one static
test was performed on a specimen at a given temperature. The curves
shown in Fig. 7 for a specimen of
99.999
per cent purity are typical ofthe curves obtained for the four specimens of this purity which were
tested.
The values obtained for the critical resolved shear etress in
these tests are listed in Table
1.
The critical resolved shear stress istaken as the stres s at the beginning of rapid straining for the case s in
which a sharp yield point is exhibited. In all other cases, the plastic
flow curve has been extrapolated back to zero plastic strain and the
value of the stress at this point taken as the critical resolved shear
-2
3
-40
II
\
N
~
C-=--=-":--=---"'
,T
-
-
- - - -
-~
-
750F- - - - - j >1 - - - -
- - -
1
- - -
- - - - 4
-f.
---
r
:>
;9
30,,'
~
3CJl co C)
..
....
CJ)..
III
v .s:!
CJ)
\(
Y
]
20~---~----~---+---~
i
I
~
lO~~---~---4---~
°O~---5~O~O~---lO~O-O---1~50-0
Resolved Shear Strain, 10-6 in.
lin.
[image:30.550.58.486.35.650.2]-24
-50~---~r---.---'
.
40~---~---~---;
~_---
_292o
Fd
___________
r-....
?
30~---~~~~---~---~
i
l
~
'
0.t
__
--,i- -
93 Fl
~~
~
20
~
~~~---+---~---~---;
~
IL
- - - -
!
- - - - -
- - - i - - - ,
~
1
3
Z
I
10
~---+---+---~--~o
~0---~5~0~O~---~I~OO~0~---1~5~OO
Resolved Shear Strain,
10":6
in. lin. [image:31.511.42.470.67.635.2]
-25-50
40
,
N
.
Ii
~ 30
...
--
0~
~ -292 FI
~
___ 930FV
-i
.0
...
~ C) U) <ll
H
.;..> CI)
r-.
CI! <ll
.£:
20
CI)
"0
<ll
:-....
0
7SoF
CJl <ll
cr:
10
I
o
o
500 1000 1500Resolved Shear Straih, 10-6 in. lin.
[image:32.528.46.481.60.647.2]
-26-TABLE I
Critical Resolved Shea:r Stress in Static Tests
Specimen Temperature
Specimen Purity
_292 o F _930F 750F
No. (per cent)
31. 5 Ib/in.
2
28 99.99 47.3 Ib/in. 2 40.0 Ib/in. 2 31. 6 Ib/in. 2
+
nitrogen 3 0.2 Ib/in. 232.71b/in. 2
18.01b/in. 2
30 99.99 27.11b/in. 2 20. 1 Ib/in. 2 17.3 Ib/in. 2
17.0 Ib/in. 2
36 99.999 16.2 Ib/in. 2
37 99.999 15.1 Ib/in. 2
38 99.999 21. 1 Ib/in. 2 16.5 Ib/in. 2 15.2 Ib/in. 2
[image:33.537.66.498.194.472.2]
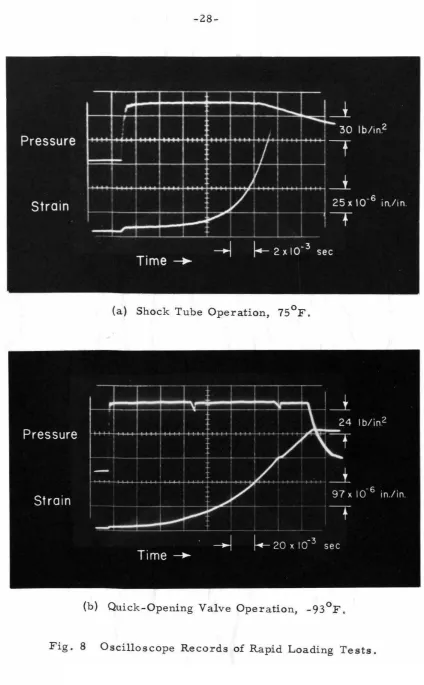
-27-Rapid Loading Tests
Typical records of rapid loading tests are shown in Fig. 8 for both the shock tube m.ode of operation and the quick opening valve m.ode. The initial level of the pressure vs. tim.e signal corresponds to the preload on the specim.en. The sm.al! step in the strain signal upon application of the load corresponds to the elastic strain in the crystal. The two sm.a11 disturbances in the pressure vs. tim.e curve of Fig. 8b are caused by an unloading pressure pulse, originating in the short "preloadl l section between the loading diaphragm and the specimen (see Fig. 2b). This pulse is propagated up and down the
. tube, after the diaphragm is broken, with a round trip time of about 70 millis ec.
Graphs of plastic shear strain vs. time and strain rate vs. tim.e, with both strain and strain rate plotted on a log scale, are shown in Fig. 9 for a rapid load test at 7SoF on the nitrogen doped specimen. Sim.ilar graphs are shown in Fig. 10 for a rapid load test at -292oF on. the sam.e specimen. The results shown in these figures are typical of those obtained for the nitrogen doped specimen and for the specimen of 99.99 per cent purity. Graphs of plastic shear strain vs. time and strain rate vs. tim.e for a test at 7SoF on a specimen of 99.999 per cent purity are shown in Fig. 11. These are typical of the results obtained for tests on specimens of that purity.
-28-(a) Shock Tube Operation, 7SoF .
(b) Quick-Opening Valve Operation, -930F .
[image:35.540.62.486.33.718.2].
s::-2
9
-10
-
3r-
---,.---.---~
·1
]
J
~
r
.9
~
I
:
()
o C}
...
s::
s::
...
10-
s
'- - - r - / - l - - - l - - - - , I ! - - - l10-2 ....
~
[
i
£
r
/
f-
/
~
//
-y
lO
J
t
0,
~
I
! /
.
f
/
:
.
_7
I
j
/
10 0
40
-3
Time, 10 sec
80
-4
120 10
Fi
g
. 9
Plas tic Strain vs. Time and St!"ain Rate vs. Time. NitrogenDoped Specimen. 7SoF. Applied Resolved Shear Stress
-
30
-10
-3
t
..-
----
--.---.---,
r
l
I
t
,I
,
--L
10-4
10
-
1
u Q) (/)
s::
--....
.
--
....
.:
.:/
--.
...
~/
.:
>- )(-\0/
....
c
-<_-\ / •>-....
«l/
/ ' Q)k ...
...,
/
«lCI)
0::
u
/
s::
.
...
...
.
....
<0 oj
«l
..
...
lO-2
...,
p..
10
-
5
CI)10
-
6LL
---~---L---~10-3
o
4 8 12-3
Time,
10
secFig.
10
Plastic Strain vs. Time and Strain Rate vs. Time. NitrogenDoped Specimen, _292cF . Applied Resolved Shear Stress
;:::
...
--
.
....
;::: ~ >-;:::.
....
«l ~ ~ U1 U...
...,
Ul III...
p..-
3
1
-10
~r-
---
-r--
--
---r:==~======
~10
-
2
10-4
t
u! 0
...
UlL
--..
~
...
--..
.
t::.
....
.>-<!J "'-' r.:l CC; ~.
....
III J.< ~ U1 10-4-
6~
/
____________
~
__
____
__
______
~
__________
~
~10
-
5
10 0 40 80 120
-3
Time, 10 sec
Fig.
11
Plastic Strain vs. Time and Strain Rate vs. Time. Specimenof 99.
9
r9
Per Cent Purity (No. 38), 75°F. Applied ResolvedC'," '
',
-~
St"'es" 20 2 lb/l'n 2 [image:38.540.47.506.47.728.2]
-3Z-The results of a test in which this process was repeated five times
are shown in Fig. lZ. The short gaps in the two curves correspond
to interruptions in loading of about 15 minutes each.
The results of a test of relatively long duration at -Z9ZoF are
shown in Fig. 13. The periodic reductions in both ulagnitude and rate
of increase of the strain rate coincide with the arrival at the specimen
of the small unloading pulse which propagates up and down the shock
tube. This effect was observed in all of the longer duration rapid load
tests at -930 F and -29ZoF. However. it was not observed at +7SoF in
either this type of test or in tests of the type shown in Fig. 12. Only
three tests of the latter type, each involving only one interruption ln
loading~ were performed at the lower temperatures and the effect of
the interruptions in thes e tests is not clear.
The complete results for all of the rapid load tests are given in
Table II. These results are presented in terms of the slope, kv. of the
log strain rate vs. tiITle curve and its intercept" p by, with the time :::
o
o
axis. In cases where the slope was apparently affected by the lowpressure pulses described above, the initial slope, prior to the arrival
of the first disturbance. was taken as the best value. The static yield
stress, T , for each specimen and the applied shear stress, 'T, are also y
tabulated. The 'T values listed are the aveTages of the corresponding
y
critical resolved shear stress values from Table I.
Figure 14 is a plot of the quantity log kv vs. log ('1-'1 )$ the
y
increment of the applied resolved shear stress above the static yield
stress for that test. The points for all of the tests fall along one
[image:39.545.55.508.58.729.2].
I=:....
--
....
I=:-33
-10-3 • ...-_ _ _ _ _ -;--_ __ _ _ -;-_ _ _ _ _ -,~ 1
I
I
.
.:;..0/'
0"':"
.U
.~ 1
10
-
4~
---
~
---
~~~
---
~10
--<
-
~'"
r
I
r
I
u
U
l~
--
.
~
.
...
"
.~ lO-~ ---~~---~+---~
r
r
--
.
...
I=:~
---
~
---~---
~.10
-
4
20
4
0
60
Fig. 12
Tirne,
10
-
3 secPlastic Strain vs. Time and Strain Rate vs. Time. Specimen
of 99.99 Per Cent Purity, 7SoF. Applied Resolved Shear
.
2
[image:40.527.44.491.46.699.2].
~....
-
....
~ - >-~.
...
c;j 1-< ... U) U...
... til c;j ~ ~-34-10-4~----________ - r ____________ ~ ____________ --.10-2
10- 5
I
I
~
.Q:'O' ~
t::')
;;-
.
"".t.. 0 10- 3 10-410- 7 ~ ____________ ~ ______________ ~ ____________ ~10-5 360
o
120 3 240 Time, 10- secu Q) C)
-
~.
.
...
-
.
~....
- .>-Q)...
C'd ~ ~.
... rd 1-1....
U)Fig. 13 Plastic Strain vs. Time and Strain Rate vs. Time. Specimen o
of 99. 99 Per Cent Purity, -292 F. Applied Resolved Shear
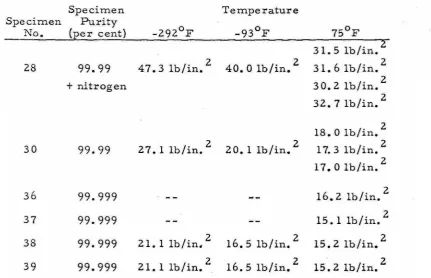
[image:41.539.60.498.53.658.2]TABLE II Results of R a pid Loading Tests
Static Yield Applied Shear
S · T t Stress Stress peClnlen es Specimen Purity Tem!6erahue Ty 2 'f 2 _No. __ {p~~cent) ( F) (lb/in.) (lb/in. ) 28
99.99
75+
nitrogen -93-292
3099.99
75-93
-29231.5 40.0 47.3 17.4 2 O.
1
27.
I
46.7 37.4 36.7 51.
7
43.9
63.3 54.6 35.0 31.2
29.8 26.3 25.8 22.8 22.5 34.
7 2'1. 4 2 5 . '(
3').1
34.0
Yo
Log Strain Rate ys, Stress Slope I"j·~~~"",t Time[pbV)
~.lI,,,""".L '-''''''.1-''... 0 Ll~:;'ll~lHkv
p bvkv
(lb/i~.
2) (sec -1){lO~6in./in.
sec) (10-6 in ./ in .)15.2 5.9 5.2
11.
7
3.9
16.0 '1.3 17.6 13.
'7
12.4
8.9
8.
4
504
5.1
1
4
.6
7.3 5.8 12.
0
6.9
-490 51.7
21.7
42139.3
28199
460 320271
11
6
98
22,5 23.02
45 1'( 21.2
123 92
7.5 93 110 4,100 350 1,
130 90
69
110 190 11.2 18.2 560640
510395 2,600 3 4 .4 33
0.25 1.
78
0.35 0.22 2.80
14.5 3.54 2.46 0.28 0,25
0.96
1.92
0.50 0.79 2.3
13.6 21
6.6
0.96T AB LE II ( CON T. ) Resu lt s of Rapid L oad i ng T es ts Yo S ta t ic Applied L o_~St r ai!: R a~ ~_s~m~ Y ie l d S h ea r Stress
(
P
o
~Y
)
Test S tress St r ess I ncr e me n t Slope In t e r cept T T T T-T kv P bv k v empc r a t u r e y2
2
Y
2
-1
(
_
6
0(10-6
in . li n .) ( o F) (l b /i n .) ( lb /i n, ) (l b /i n, ) ( sec )10
i n, /i n . s ec ) -. - - ~--. --S pecimen S pecimen Purity No. _ _ (p ~ r cen t) _ __ : __ _36
99.999
7
5
1
6.2
29.4
1
3.2
299
1
3.
0
0
0
4
3
.
5
37
9
9.999
75
1
5
.
1
30,0
1
4
.
9
509
9~OOO17.
8
I7
5
1
5.2
2
9.2
1
4,
0
393
3.200
8
.
15
w 0 ...
1000
7
10
()
(!) <Il
1
r
c
I
I
•
..
°2
0
"
C
,
/ '
A
-37
-7SoF
L
_93°F
8*
7
0_292°F
/
I
J
)
rv
/
!o
c
V
13.
)
..
c
6
°8~
V
/
4
Fig. 14
~
8
10'1"- '1" • Ib/in. 2
y
Plot of kv vs. ('1"- '1" ).
y
[image:44.544.62.506.57.696.2]
-38-the room temperature (7SoF) tests and for the tests at higher values of (-r-,.). Errors in the measurement of both,. and,. , as well as
y y
small variations in the specimens themselves from one test to the next, have a much larger effect at low values of (-r-'T ) than at the
y
higher values. In the nitrogen doped specimen, for example, the yield stress in four successive static tests at room temperature was found to vary between 30.2 and 32.7 lb/in. 2. Such variations can have
a relatively large effect in rapid load tests where the total applied stress is of the order of only 37 lb/in. 2. The difference between the coefficients of expansion of zinc and of the SR-4 strain gages is another source of error at the lower temperatures. The strain gages are of the paper type and are bonded to the specimen by Duco cement. Thermal stresses may also have a significant effect. The larger scatter of the low temperature results as seen in Fig. 14 is also reflected in the more erratic behavior observed in some of the strain vs. time curves for tests at these temperatures.
Etch-pip Observations
Three specimens, each of a different purity, were etched after their final rapid load tests to reveal the dislocations in the areas
where the strain gages had been attached. An area on the surface of a deformed specimen is shown in Fig. lSa. A total resolved plastic
shear strain of 375 x 10- 6 in. lin. had been recorded by the strain gages during the last test, of .this specimen. The test was performed
o
-39-Compr e s sion
Axis
t
Slip Direction
[1210
J
r
"'
.. .
0( .. .
(a) After Rapid Loading Test at -93_~F in which a Total Plastic Shear Strain of 375 x 10 in.
lin.
was Measured.0'
(b) Annealed in Vacuo at 7000 F for 1 hr. and Re-etched.
-40-The appearance of these areas is typical of many areas in all three specimens. Although considerable variation was observed in dis-location density and in the distribution and configuration of the small-angle boundaries, no major differences were observed between
different specimens. Those small-angle boundaries which appear broader and more diffuse in the deformed specimens are seen to disappear upon annealing. The boundary in the center of Fig. l5a is an example of this type. The sharply defined boundaries are
relatively unaffected by the annealing proces s. The boundary just to the right of center and both of the boundaries in the upper left corner in Fig. 15 are of this second type. (The one which appears to have disappeared was probably inclined at an angle to the surface so that the removal of a layer of zinc during the re-etching process caused the intersection between boundary and surface to shift toward the upper left corne r. )
Several Ilrepresentative" areas in the photographs of the
nitrogen doped specimen were selected and etch-pip counts were made to determine the dislocation densities. These areas were chosen so as to exclude the sharply defined small angle boundarie s. The counts for seven different areas in the deformed specimen gave values
ranging from 5.0 to 26.4 x 10⁵ ern -2, with the average being
2 · 5 -2
12. x 10 cm • In the annealed specimen, counts made in
approxi-5 -2
mately the same areas gave values ranging from 3.1 to 4.9 x 10 crn ,
5 .... 2
,
-41-V. DISCUSSION OF RESULTS
A comparison of the static tests shown in Figs. 5, 6 and 7
shows the effect of purity and the addition of nitrogen on the yield
stress and sharpnes s of the yield point in zinc. At 75 OF (2.4 °C) the
yield stress of the nitrogen doped specir.1en is almost twice that of
the other specimens, while the specimen of 99.99 per cent purity does
not appear to be very much stronger than the specimen of
99.999
percent purity. The yield point is the sharpest and most well defined in
the nitrogen doped specimen. This specin-.:.(;n exhibits a plastic strain
in excess of 2000 microin. lin. at 750F with no indication of the onset
of work h3.rdening. In the specimen of 99.99 per cent purity at this
temperature, a plastic strain greater than 1000 microin. lin. occurs
with no increase of applied stress. In specimens of
99.999
per centpurity, little or no drop in applied stress is observed at yielding, and
the strain proceeds slowly enough that it can be followed continuously
on the strain indicator. Vlork hardening in these specimens can be
detected after a strain of only a few hundred microin. lin. Only one
specimen of
99.99
per cent purity and one nitrogen doped specimenwere studied; therefore the nume rical results obtained fo r thes e
specimens are not. necessarily typical of the purities which they
represent. The amount of impurity introduced into the nitrogen doped
specimen could not be measured. There is a definite trend in the
directic"-l of increased strength and sharpness of yield with an increase
in inlpurity content, however.
-42-the same. Both -42-the yield stress and the work hardening rate increase with decreasing temperature. The increase in yield stress is greatest in the nitrogen doped specimen and least in the specimen of
99.999
per cent purity. The nitrogen doped specimen~ which had the sharpest yield point at 750F~ has the smallest work hardening rate at the lower temperature s.
The strain vs. time curves obtained in the rapid load tests show a smooth and continuous increase of both strain and strain rate for all of the specimens studied and for all temperatures, from _2920F (-ISOoC) to +7SoF (240C). Thus, it is impossible to define a "delay time for the initiation of sliplt without resorting to an arbitrary choice of an amount of plastic strain corresponding to the beginning of macro-scopic yielding. No such choice is required in the case of polycrystal-line steel and molybdenum because the strain vs. time curves exhibit two distinct regions and the delay time is defined by the transition froi.n one region to the other. This difference in the general form of the two curves, together with the fact that grain boundaries are present in one case and not in the other. indicates that basically different mechamisms are operating in :he two cases. Thus the concept of a delay time may have no real significance for zinc single crystals. Therefore, this interpretation will not be considered further~ and the results of these experiments will be interpreted on the basis of an alternative
-43-Proposed Dislocation Mechanism
The dislocation mechanism chosen for this purpose 1S based
upon the following as sumptions:
1. The re is an initial density, Po' of weakly pinned dislocations
in the annealed crystal which are free to move under the
action of a shear stress 'I
>
1" •Y
2. The average velocity,.
v
~ of all dislocations taking part inthe slip process at a given temperature is a function only
of 1".
3. The total length of active dislocations per unit volume ta.1.cing
part in the slip process, p, increases in proportion to the
total area of slip plane pe r unit volume that is swept out by
the lUoving dislocations. (This is equivaleat to the as
SUlUp-tion that p increases linearly with increasing plastic strain.)
Assumption 2 is consistent with the experimental observation (l, 4) that
individual dislocations in both lithium fluoride crystals and
silicon-iron crystals accelerate very quickly and then lUove with constant
velocity when a constant stress is applied to them. Assumption 3 is
consistent with the observation (l~ 18) that new dislocation loops form
in lithium fluoride at many different sites in the wake of a moving
dislocation and tha t the number of thes e new loops is proportional to
the distance traveled by the original dislocation loop.
The third assumption give s the relation
p
=
Po+
kA, (1)
-44-begins to move immediately when stress IS applied, A is the total area of slip plane per unit volume swept by dislocations, and k is 2..
constant. The resolved plastic shear strain,
Y,
in the c17stal and the strain rate,), > expressed in terrns of the motion of the$edis-locations~ are
y = Ab (2)
and
" pvb,
y = (3 )
whe::.::e b is the Burgers vector and v =
v{rr!
IS the average dislocation velod.ty. Combining these equations,Integrating t):lis equation gives
log (Po
+~
Y
)=kvt +c.Then, since y
=
°
at t ·- 0> C = log Po' and hencewhere
The plastic strain rate is then given by
• .- kvt Y
=
p bv e o.Equation 5 predicts that a plot of log y vs. t should be a line 'vv1th slope
J<v
and an intercept on the t = 0 axis of lode bv).~ . 0
"., "
-45-experi"1:"D.ental results, as illustr3.ted in Figs. 9-13, show that 102 y vs.
t is in fact quite linear up to stl"a:':lS of the order of 100 to 2 GO
"1:"D.icroin. /in. Equation 4 predicts that a plot of 100 ("\/
+
')1 ) V C t.... .... b '\ I 0 ... Q
should also be a straight line" rI'l:.ese plots are shOV,rn as dashed 1:':1.85
in Figs. 8-12, with the value for y oo;::ained by cocloining the values
o
for p bv and
kV
from the respective p2.ots of log Y vs. t .o
Figure 10 shows that the behavior of the specime:.-;.s of 99.999
50 .- ,0,-.., ' , ,(" ...
per cent purity at 7 F ~L-'± v I c.eparts SOHlewnat :rorr. LS. ::;. at the
higher strain values. A sirnilar d.ifference bet\Vecn theory al1.Q CX:)~l~l
-ITlent is observed in all spccirnerls at the lowe::: ::ernp8::a::ul""cs. 1'his is
pl'"obaoly due to a y;.rorlc h.3.~"cien.ing effect since ti".A.e obseTved stl"2.il~,;. 1"at8s
are less tt ... 2.n tl1.e tl18oretiC2..1 values aftel'" a certain arr10unt of stl~airl
has taken place. Tl-lere al),?2ars to be a defin.ite correla::ioY'l between
t}-~is effect in t:'lc rapid load t\:!sts and the :relative degrees of wc:::k
hardening observed in the various static tests. Thus the theory ap::-.>ileS
only to the very early stages of plas-.::ic defo::cmation be£o:ce worl;;: ~'la
:cden-lng becOnleS significant.
The behavio::c predicted by the proposed mecl1.anism agrees \vith
-..:.-.c experimental ::cesults fOl" all of the specimens and at all temp:,:::ca
-tu:-es. This is an in'l.portant result~ and is of course a necessary
pl-erequisite for the further consideration of the Inechanisrn"
The linear relationship between t~'"le logarithl'n of
t:-...2
pl2.stics::rain rate and tirne simplifies the task of classifying and tabulating
-46-the two parameters, kV' and pobV', plus the speciiicatio!1 of temperatu:;:c,
applied stress, and specirr.cn tested. These values, for all "he tests
made in this investigation, are ziven in Table 1. Figure 14 is a plot
of log kV'vs. log (rr--: ). The figure shows that the experimental
y
results for test specimens of aE the degrees of purity investizated and
for all test ternperatures fall upor. the same stl"aight line, withi:1.
experimental accuracy. This result, together with the results of the
static tests, leads to the following conclusions:
1. The const&nt k n--.ust l-.:.:::.ve tne san1.e v&lue for all of the
tests. Ii this Wel"e not so~ k would have to Val"y lir;.early with V' or i·, would have to depend upon
'i-,
in exactly they
same way tl--.atv depencs upon ' i - i > ar.d in either case l (
y
would have to be otherwise unaffected by variations in
ten1.perature, pu:;:ity and the absolute value of the applied
stres s. There is no reason to expect k and v to have a
close interdependence.
2. The n1.ean dislocation velocity~ v, depends only upon the
excess of the applied stress) i . over the static yield stl"ess,
T •
Y
3. The dependence of mean di.slocation velocity upon cl"ystal
puri ty and ternperature arise s solely froD""]' the deper.dencc
of the s·.:atic yield stress upon these variables.
4. The slope of the line in Fig. 14 gives the result th&t t~""].e
average dislocation velocity increases with the 2 • .5 pov;rz,_'
of
i-, .
[image:53.541.84.494.259.706.2]
-47-Qualitatively, these conclusions agree in almost every respect with the findings of Gilman and Johnston (i., 2~ 3, 19) regal'ding the
behavior of individual dislocations in lithium fluoride and of Stein and Low (4) for silicon-iron. The effects of impurities and of changes ::.n temperature have been studied in lithium fluoride, as well as the
effects of radiation damage, stl'ain hal'dening, and differing heat treat-ments. These various treatments all have an effect on the yield
stresses of the crystals, often a very strong effect. Nevertheless
in all cases the main effect of such changes is simply to shift the
position of the Curve of dislocation velocity vs. stress alor-kg the stress coordinate (when the dislocation velocity is plotted against the total applied stress rather than against the stress increment as in ?ig. 14). The curves for crystals having different yield stresses are parallel to one another and the amounts of shift are found to be equal to the
corresponding changes in the yield stress. Silicon-iron crystals behave in the same ITlanner with respect to changes in temperature (4); namely, the yield stress increases at lower temperatures and this increase is
accompanied by a corresponding increase in the stress required to pro-duce a constant velocity of dislocation motion. The res1.7.lts of the pl'e-sent investigation show that the effects of tem.perature and purity upon the velocity of dislocation ITlotion are qualitatively the saITle in zinc as in li thiuITl fluoride and silicon-iron.
One qualitative difference between the re sults reported for lithiuITl fluoride and the results of the present investigation conce:::ns
-48-magnitude of the applied stress and t:pon the dislocation velocity. rp' . ..r.. nlS
investigation indicates that k for b2.sal slip in zinc is indep.:::ndent of stress, dislocation velocitY3 pu:: .. ity, and terrlperatu::e. In view of the
many differences between these rnaterials, and in view of the r elatively small range of stresses and velocities covered in t:'lE: pl'esent
investi-gation~ it is difficult to attach much significance to such a diiference in behavior.
Additional evidence tending to coniir:.n the proposed disloc2:~ion
mechanism is provided by the results of the inte:. .. : .. upt.:::d loading tests
at 750F, as illustrated in Fig. 12. This figure shows that a!te:;: 1n-terruptions in loading the plastic strain begins again as i.f it had never been inter::upted. This behavior is exactly what would be expected for
dislocations that move with a constant velocity when subjected to a
constant applied stres s (as suming that none of the dislocations bccar.o.e
pinned in some manne:: during the intervals between stress pulses).
These results also imply that~ at least for times of tne order of 15
minutes, Cottrell (or impurity) pinning is not an important factor at
At _930F and at -292oF, interruptions in loading have a
SOlne-what different effect. As was mentioned previously) however1 the effect
of the longer interruptions at these temperatures is not cle2.r.
There-fore only the short duration unloading pulses, as illustrated in :::~i:;s. 3b
and 13, will b,= discussed. These unloading pulses appeal' to produce
-49-returns to its original value. These dislocations then cease to
participate in the slip ?rocess~ thus reducing the overall rate of strain in the specimen. They also interfere with the motion of other dis -locations,. thus reducing the rate of increase of the strain rate. Since
this effect is not observed a:: 7So? ~ the additional thermal energy at
this temperature must b·e sufficient to dislodge the momentarily
pinned dislocations . . The se low ten"lperature pinning effects are
observed to occur only when the unloading pressure pulses arl'ive at
the specimen. Thus it appears that while a dislocation is in motion,
unobstructed portions assist the applied s~ress in pulling other po:::tions
through the various local obstacles and retarding fOl"CeS in the path of
the dislocation. When the applied stress is temporarily reduced,
how-ever. many of t