Comparative Performance Evaluation of Size Metrics
and Classifiers in Computer Vision based Automatic
Mango Grading
Suchitra Khoje
Research Scholar, Symbiosis International University,Lavale, Pune.
Shrikant Bodhe, PhD.
Principal,College of engineering , Pandharpur.
ABSTRACT
Any horticulture product is expected to meet the set quality standards in order to improve its market value. The mango is one of the most delicious tropical fruit from India. Exports from India account for 0.11 per cent of the total domestic production as against about 4 per cent in case of other exporting countries like Mexico, Philippines and Venezuela.
Case study of mango fruit from Maharashtra, India is being considered here for size grading purpose. Images of mango are captured using CCD camera and size analysis is carried out using the MATLAB package. The paper discusses various size estima-tion metrics which are used as feature vectors for two classifiers namely Feed Forward Neural network (FFNN) and Support Vector Machines. The performance of these classifiers in grading mangoes according to CODEX size standards is presented. Experimental results show that Statistical method give an average size grading efficiency of 97% irrespective of classifiers for mango size grading.
Keywords:
Mango fruit size grading, size metrics, Feed Forward Neural net-work.
1. INTRODUCTION
Mango belonging to the genus Magnifera Indica is a tropical fruit native to India. India is the leading producer of mangoes in the world, accounting for more than 50% of world production. However, according to NABARD (National Bank for Agricul-ture and Rural Development) report, India’s share in the world mango market is just about 15%.
At the international market, the varieties in demand include Alphonso, Kesar, Kent and Tomy Atkin. All these varieties differ in shape, color and flavor depending on their exporting countries. Thus automated mango gradation plays an important role to increase the value of produces. In general, the gradation indices are shape, size, color, maturity, defection, etc. Defects in shape and size tolerance are inspected while grading mangoes. The shape and size of horticulture products such as fruits, vegetables is one of the most important factors for their classi-fication and grading to decide their commercial quality. Thus, the appearance of fresh fruit is a primary criterion in purchasing decisions. The appearance of fruit is evaluated by considering their shape, size, color, firmness and finally absence of visual defects. All these contributed as an important quality indicator
throughout commercial utilization chain. Among the appearance feature, size plays a central role.
Size is a significant factor to decide market value of fruit. Variety certification can be based on general shape and size description [8]. Sensory analysis with panel test is carried out to decide fruit quality [6]. Nowadays, with the lower price of the digital camera and computer, a computer vision system may be used for inspection tasks [2]. Machine vision systems are replacing the subjective process of manual inspection of products in different industries [10]. Being an objective nature, machine vision can replace traditional expensive and subjective task [1].
In this context, image processing algorithms have been de-veloped by researchers to objectively describe size features of horticulture products. Due to natural variation in shape and size of horticultural products, it is difficult to develop computer algo-rithms to do so. Thus certain pattern recognition techniques such as neural networks, fuzzy logic, and support vector machine can be used with machine vision to design on-line sorting system of fruits [7], [5], [3].
Appearance of an object is characterized by its physical dimensional measures which are called Shape Features or Morphological Features. Area, perimeter, major and minor axes lengths, as well as the aspect ratio are some of the most commonly measured morphological features, widely used in automated grading, sorting and detection of objects in the industry.
Some shape descriptors consist of ratios calculated from measurements of length and width. Most of the researchers have developed shape algorithms to quantify the roundness, rectangularity, or elongation of the object, by calculating ratios of the projected area to its width.
Agricultural and Processed Food Products Export Development Authority of India (APEDA) promotes export of food and fruits. APEDA certifies export-quality fruits based on the international CODEX standards.
work is discussed. Materials and methods are elaborated in section 3. Section 4 discusses experimentation, while Results and Conclusions are presented in sections 5 and 6 respectively.
2. OBJECTIVE
The objective of this work is to determine the size of mangoes using computer vision. Statistical and morphological parameters such as area, perimeter, diameter and coefficient of deviation of the radius signature of the perimeter are required to be calcu-lated. This information has to be combined to identify size and to sort the fruit according to its size information. Fruit size de-termination is an important post harvest operation due to several reasons [4].
—To estimate the market value of the fruit based on size grading. —Size determination is obligatory for on-line density sorting; as density is related to most of chemical properties of fruit such as soluble solid contents (SSC).
—Size measurement is needed to estimate surface area of fruit which is used to enumerate microbiological population or for calculating throughput through peeling operation.
—In food industry, we need size estimation to meet requirements of further processing machines.
—Shape features can either be measured independently like Fourier Descriptors, Moments etc. or they can be based on size measurements including Compactness, Elongation, Convex-ity, Roughness etc. Thus size determination ultimately leads to shape sorting.
3. MATERIALS AND METHODS
3.1 Fruit varieties and size samples
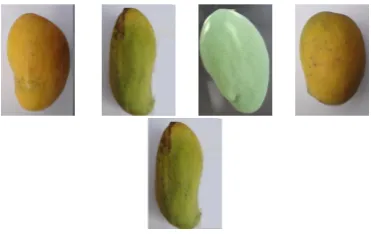
[image:2.595.321.541.106.267.2]This work is aimed at size grading of mangoes according to stan-dards. For this, a total of 275 mangoes of different varieties and sizes were collected at random from mango orchards. The mango varieties selected for study were Alphonso, Langra, Totapuri, Dashhari and Payari from orchards of Ratnagiri, Kankawali and Vengural (Sindhudurga Distict, Maharashtra, India) as shown in figure 1. All the fruits harvested in the production season 2012.
Fig. 1. mango database of different varieties (From left to right: Alphonso, Dashhari, Langara, Piary, Totapuri )
Images of mangoes were collected using the acquisition sys-tems described below. This sample set was used to obtain the results presented in this work. Sample sizes were roughly cat-egorized as small, medium and large. A sizing parameter ex-tracted from these samples was used to train the algorithms for grading them according to international CODEX STANDARDS (CODEX STAN 1841993) as shown in 1. CODEX standards as-sign size grades A, B and C according to the weights of the man-goes.
Table 1. Weight Based CODEX Size Standards for mango
Sr. No.
Size Code
Normal Size Range (weight in grams)
Permissible Size Range (weight in
grams) 1 A 200 - 350 180 - 425 2 B 351 - 550 251 - 650 3 C 551 - 800 426 - 925
Fig. 2. Proposed Size Estimation Techniques
3.2 Image Acquisition and Pre-processing
The image acquisition system used in this study consisted of a camera (Sony DSC-W290), a lighting system composed of backlighting. This helps easy elimination of the background to extract the mango images from the captured scene. The system had a CCD camera to capture the scene that consisted of the fruit. Using suitable methods as discussed in this paper, this digital image was analyzed to determine the fruits size.
The basic computer vision system consists of Personal computer with VGA color monitor, CCD camera and Illumination system. Sony (DSC-W290) camera with resolution of 12.1 Megapixels is used in the setup. A uniform diffused illumination system was used and distance from camera to the sample was kept con-stant while capturing clear images of the fruits. The captured scene from the experimental setup had the mango image includ-ing the background. To facilitate the segmentation process, black or white paper was used for the background. By means of selec-tive threshold value, the background was totally removed, thus retaining the mango image alone. The image was converted into binary form and then the edge of each mango was detected by applying appropriate filters. The extracted contour was then anal-ysed using various techniques proposed in this paper for size es-timation. The size information thus obtained serves as the basic input parameter for comparison and to assign appropriate grade for each of the mangoes. Mathematical and the relevant image processing analysis carried out in this paper are in MATLAB software which runs on Windows platform. The units of all mea-surements and results presented in the paper are in pixels.
3.3 Size Estimation
The proposed size estimation methods are classified as shown in figure 2.
It is required that the stem-blossom line of mango must be vertical oriented before analysis using analytical methods. So, if it is observed that the contour of a test mango image has an angle of tiltφ, it should be rotated with the same angle so as to maintain the stem-blossom line aligned along the vertical axis. The angle of tilt is calculated as follows [9].
IF contourCis denoted as an ordered sequence of N coordinate points,C=λi = (xi, yi)f or i = 0,1, ..., N−1andCis
closed. i.e.λi+N =λi.
Using moment of inertia, tilt of stem-blossom axis from horizon-tal is calculated as,
φ=1 2tan
−1[ 2Ixy
Ix−Iy
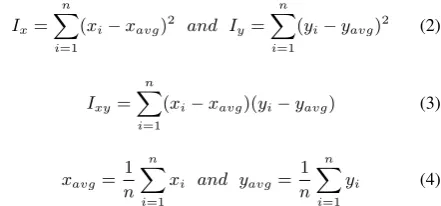
[image:2.595.76.262.526.643.2]where Ix and Iy are moment of inertia about X and Y axis re-spectively and Ixyis combined moment of inertia. xavgand yavg are averages of contour pixel points.
Ix= n X
i=1
(xi−xavg)2 and Iy= n X
i=1
(yi−yavg)2 (2)
Ixy= n X
i=1
(xi−xavg)(yi−yavg) (3)
xavg= 1
n
n X
i=1
xi and yavg= 1
n
n X
i=1
yi (4)
3.3.1 Morphological Size Estimation. While acquiring any image, three-dimensional (3-D) information is converted into two dimensional one, which restricts even size measurement in two dimensional digital images. The popular size measurements are length, width, area, and perimeter. The area and perimeter are calculated by counting the number of pixels belonging to the ob-ject, and summing the distance between every two consecutive contour pixels of the object, respectively [11].
Area Calculation:
Area is the most basic measure of size. A simple method is used to measure the area by counting number of pixels representing an object. First the image is converted to binary (I). Assuming I(x,y)=1 for object pixel and I(x,y)=0 for background, the area is computed as,
Area=X x,y
I(x, y) (5)
Diameter Calculation:
By scanning the mango contour from left to right and from top to bottom, row minimum point p1(x1,y1), row maximum point p2(x2,y2),column minimum point p3(x3,y3) and column maxi-mum point p4(x4,y4) are estimated. Estimate an imaginary circle passing through these points using the equation
x2+y2+ 2gx+ 2f y+c= 0 (6) where g,f and c are constants whose value can be estimated using Cramer’s rule as below:
g=∆1 ∆, f=
∆2
∆, c= ∆3
∆ (7)
|∆1|=−2
(x2 1+y
2 1) y1 1
(x2
2+y22) y2 1
(x2
3+y23) y3 1
|∆2|=−2
x1 (x21+y21) 1 x2 (x22+y22) 1 x3 (x23+y23) 1
|∆3|=−2
x1 y1 (x21+y12) x2 y2 (x22+y
2 2) x3 y3 (x23+y32)
Radius and Center of circle are calculated as:
r=pg2+f2−c and c= (−g,−f) (8) Diameter of circle used as a measure of size for circularly shape mango fruit.
As shape is indirectly related to the size of fruit, general shape descriptors such as area, mean diameter and perimeter are evalu-ated which are important shape characteristics in size classifica-tion.
3.3.2 Asymmetrical Size Estimation Method. In most of the cases mango fruits are asymmetrical about its stem-blossom axis, so a new method is proposed for size determination called the Principal Axis Method.
Principal Axis Method:
From the image contour, the dip points of stem P1(xstem, ystem) and blossom P2(xblossm, yblossom) are detected. The Principal axis is the line joining these two points P1 and P2and its length is given as
h=p(xstem−xblossom)2+ (ystem−yblossom)2 (9)
In this method sizing parameter is H which is defined as,
H =hA1 A2
(10)
where h denotes height of the principal axis and A1, A2are the areas on the either sides of the principal axis.
If contour with N pixel points[(xk,yk), k=0,1,2...N-1] is con-sidered, areas A1and A2are calculated using centroid of contour. If the sectoral area covered between any two radius connecting the pixel points xk,yk and xk-1,yk-1 with the centroid (xc,yc )is obtained as,
|∆Ak|=1 2
xk−xc xk−1−xc
xk−yc xk−1−yc
Considering N pixel point along contour, total area is estimated as,
A=1 2 n X k=0
xk−xc xk−1−xc
xk−yc xk−1−yc
The areas A1and A2are calculated by considering contour pixel in clockwise and anticlockwise direction respectively.
3.3.3 Statistical Method. Size of mango images can be com-pared using statistical method. The statistical methods are based on radius signature. The extracted contour is coded using the ra-dius signature as shown in figure 3, which is a one-dimensional array containing the Euclidean distance between the centroid of the object and each point on the contour. Radius (Rk)joining cen-troid (xc,yc)and equiangular contour pixel points(xk,yk) is given as,
Rk= p
[image:3.595.63.284.131.234.2](xk−xc)2+ (yk−yc)2 (11)
Fig. 3. Radius Signature (from left to right: Original Mango, Contour, Radius signature)
compare the variability in two fruit’s sizes. The relative measure like coefficient of dispersion is preferred over absolute measure of dispersion.
Relative dispersion that is coefficient of dispersion (CD) is cal-culated in two ways namely,
—Based upon size
—Based upon standard deviation
Coefficient of dispersion(CD) based on range is measured as,
CD= M−N
M+N (12)
where M and N are greatest and smallest values of radius or sec-toral area.
Based on standard deviation, coefficient of variation is calculated as,
CD= σ
xavg
(13)
CD= 100 σ
xavg
(14)
where xavgandσare mean and standard deviation of radius and area signature. The greater the CV, the greater is the variability in the parameter. This variation is taken as a measure to compare the mango sizes.
[image:4.595.317.541.175.229.2]3.3.4 Size Grading of Mangoes. All the proposed size met-ric such as area, diameter, perimeter, h, area1, area2, coefficient of variation for radius signatures are evaluated for all three size codes as shown in table 2.
Table 2. Size metric results for three size grades.
Sr.
No. Size Metric
Size Code A
Size Code B
Size Code C 1 Area 21837 26649 32805 2 Diameter 166 184.2 204.3 3 Perimeter 560 623.8 782.6 4 Area1 10318 14185 18267 5 Area2 11546 12304 16633 6 h 192 217.08 308.7 7 CD for range radius
signature (CDR-r) 0.103 0.120 0.256 8 CD for standard deviation
radius signature (CDSD-r) 10.29 11.1 25.64 9 CV of radius
signature(CV-r) 0.19 0.2 0.4
These size metric are input to two classifiers namely Feed Forward Back propagation neural network (FFNN)band Support Vector machines(SVM) and their size grading performance is evaluated.
The ANN classification model :
First section discusses the general structure of the ANN. In the second section, the different FFNN configurations are shown. ANN paradigm
ANNs are a collection of simple, interconnected neuron nodes. These nodes operate in parallel and store knowledge through connection weights between adjacent nodes. There are many types of ANNs ; including multilayer perceptron, probabilistic ANNs, radial basis function networks, learning vector quantisa-tion, etc.
Feed Forward Configurations:
The common parameters of all the Feed Forward configurations are shown in Table 3. Ten different Feedforward configurations have been implemented with different values for the number of
[image:4.595.332.528.277.388.2]neurons in the hidden layers, and the algorithm used for the Feed Forward training. Consequently, different configuration values in terms of number of neuron in hidden layer with Levenberg-Marquardt training algorithm are evaluated. As shown Table 4.
Table 3. Common parameter values used for all the FFNN configurations.
Parameter value Learning Rate 0.1 Maximum number of epochs 1000
Transfer function tan-sigmoid Training algorithm Levenberg-Marquardt
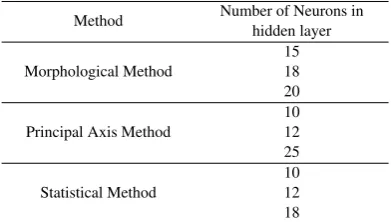
Table 4. The different parameter values of the FFNN configurations compared in this work.
Method Number of Neurons in hidden layer Morphological Method
15 18 20 Principal Axis Method
10 12 25 Statistical Method
10 12 18
Inside the neuron, a transfer function transforms the input value into the output of the neuron. The number of neurons in the input layer is given by the number of dynamic size features, whereas the number of neurons in the output layer is equal to the number of size codes to be graded (three size codes according to CODEX standards).
In addition to the input variables, there is a constant input, called the bias, which is fed to each of the hidden layers. The input is multiplied by a weight and added to bias to provide the sum which is going into the neuron. The final output of the classifier system, in response to the applied input vector, is obtained by selecting the intention in the output vector having the value closes to 1. While designing Feed Forward back propagation neural network, number of input node in input layer is kept equal to input feature vectors. The number of output node is kept equal to number of classes in which data to be classified. Thus three output nodes are selected needed to identify Size code A, B and C respectively.
Training and Testing: The Feed Forward backpropagation neural network is trained for all five varieties of mango namely Alphonso, Piary, Totapuri, Langra, Dashhari with total 55 sam-ples including 11 of each variety. For testing purpose, random sample from untrained database is selected for classification.
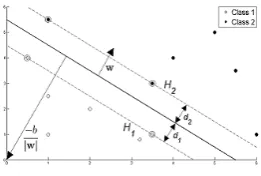
[image:4.595.56.285.425.581.2]Fig. 4. Support Vector Machines
4. EXPERIMENTATION
Firstly, the process to generate the database and validate the model is shown. Then, the experiment conditions and the clas-sification models to be compared with proposed size estimation method are explained. Finally, the results of the experimentation and their analysis are presented. Data collection and database generation
Objective of this research is to relate size of mango fruit which is actually based on weight to size metric which is extracted through image processing for grading purpose.
All collected mango images are weighed using automatic weighing scale and manually sorted into different size codes according to international CODEX standard. The collection data were classified by experts into three classes namely class A, class B and Class C.
Cross-validation is used to evaluate and compare the designed classification model of this study. It is a popular statistical method which is based on dividing data into two sections : one is used for training the classification model and other is to validate it. In typical cross validation, the training and validation sets must cross over over successive rounds so that every data has chance of being validate. Thus 4-fold cross validation method is used in this paper.
Initially data is partitioned into 4 equal groups. Then, 4 itera-tions of training and test are performed such that within every iteration a different data group is withheld for validation while remaining three groups are used for learning.
For all experimentation, the performance of the classification is expressed as 4-fold cross validation accuracy (correctly classified size code divided by the total number of classified samples).
5. RESULTS AND DISCUSSIONS
We present the experimentation results and the analysis of them. First, we include a comparison between FFNN configurations. Then, the FFNN is compared with SVM classification paradigms and finally, the error rate of size grading of mango using Feed Forward neural network and SVM is discussed.
5.0.5 Analysis of the different Feed Forward configurations . The accuracy in the size grading is tested for different Feed For-ward configurations by changing number of hidden layer neu-rons as shown in Table 5.
The analysis of the experiments for the different FFNN configu-ration showed that:
[image:5.595.312.547.117.253.2]—Best results are obtained by the FFNN configuration which has 12 neurons in hidden layer and was trained by statistical size metric (coefficient of deviation of radius signature). Statistical Size estimation method always outperforms other methods.
Table 5. The different parameter values of the FFNN configurations compared in this work.
Sr.
No. Method Number of Neurons in hidden layer
Average Size Grading Efficiency(%) 1
Morphological
15 84.67
2 18 93.40
3 20 90.34
4
Principal Axis Method
10 94.21
5 12 95.24
6 15 88.87
7
Statistical
10 93.33
8 12 97.14
9 18 83.81
—For efficient size grading, number of neuron used in hidden layer are varying for every method.
—Twelve neurons in hidden layer seem to be sufficient to solve grading problem. Increasing the number of neurons in the hid-den layer does not seem to offer any significant advantage; i.e. a FFNN with 20 hidden nodes achieved lower accuracy of a poorer generalisation.
According to the results statistical method with FFNN configura-tion is chosen; since it has best performance, using hidden layer with 12 neurons. Its confusion matrix obtained after classifying the test data of 220 mango image is shown in Table 6
Table 6. Confusion Matrix for Size Classification using Feed Forward Neural Network (Coefficient of variation method)
Actual Size Estimated Size
Size Code A Size Code B Size Code C Size Code A 130 0 0
(100%)
Size Code B 04 66 0 (94.28%)
Size Code C 0 02 18) (80%)
5.1 Comparison with SVM classification models
In table 7, the result of different SVM configuration; i.e dif-ferent kernel functions like linear, polynomial and Radial basis are shown. The size grading efficiency of SVM classifier is pre-sented.
Table 7. Size Classification efficiency using SVM
Sr.
No. Method
SVM Kernel Function Used
Average Size Grading Efficiency(%) 1
Morphological
Linear 89.9 2 Polynomial 93.4 3 Radial Basis 88.7 4
Principal Axis Method
Linear 80 5 Polynomial 94.29 6 Radial Basis 94.2857 7
Statistical
Linear 88.58 8 Polynomial 95 9 Radial Basis 94.29
The analysis of results showed the following facts:
—Polynomial kernel function of SVM gives better result as com-pared to other kernel functions.
[image:5.595.313.546.412.492.2] [image:5.595.313.546.590.712.2]—statistical size estimation method showed its feasibility to do the mango size grading as there is no significant change in classification efficiency using neural network or SVM. The confusion matrix obtained after classifying the test data of 220 mango image using polynomial kernel of SVM is shown in Table 8. Noticed from Table 8 that, the number of misclassified instances was increased in SVM classification and thus the diag-onal of the confusion matrix shows reduced results.
Table 8. Confusion Matrix for Size Classification using Support Vector Machine. (Coefficient of variation method).
Actual Size Estimated Size
Size Code A Size Code B Size Code C Size Code A 129 1 0
(99.33%)
Size Code B 05 64 1 (92.85%)
Size Code C 0 06 14) (70%)
5.2 Analysis of the performance comparison of classification methods:
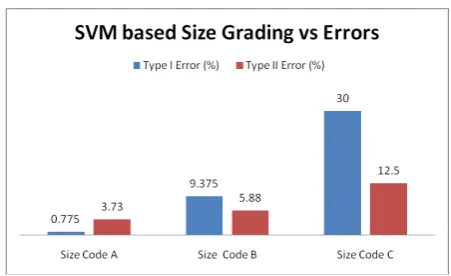
Both types I and II errors (Lyman, 2001) were considered in the study to evaluate the performance of the proposed grading meth-ods. Type I error is calculated as the number of misclassified samples divided by the total number of samples, while type II error is computed as the number of false classified samples over the total number of samples.
[image:6.595.53.286.216.296.2]The error rates for size grading using FFNN Neural Network and SVM are given in Figures 5 and 6, respectively.
Fig. 5. Feed Forward Back propagation Neural Network based size grading vs errors
Error analysis of result showed that both FeedForward Neural Network and SVM classifier has the lowest type II error for Size Code C and lowest type I error for size code A.
6. CONCLUSIONS
In this paper, a novel classification system based on various size metrics using for mango fruit grading has been proposed. The classification system can be used to develop automatic sorting and grading machine for mangoes.
The grading procedure starts with segmentation and then size features extraction is performed using various methods like morphological, principal axis method and statistical method. Size metrics such as area, diameter, perimeter,hand coefficient
Fig. 6. SVM based size grading vs errors
of variation of radius are evaluated for various size codes ac-cording to CODEX international standards. Feed Forward neural network has been successfully designed to perform size grading. Different Feed Forward configurations have been compared and the best configuration is found to be the Feed Forward with hidden layer of 12 neurons. Performance of various size metrics is evaluated for mango grading and it is observed that the most efficient size metric is coefficient of variation of radius signature.
The designed classifier configuration is tested with mango fruit images. Experimental results show that the best classification results of accuracy 97% are obtained by Feed Forward neural Network which is trained by statistical size metric.
Feed Forward classifier is compared with well known SVM classifier for mango size grading. SVM classifier is tested with various kernel functions such as linear, polynomial and Radial Basis, and results show that polynomial kernel function has the highest grading efficiency of 95% when trained with statistical size metric. Being a binary classifier, SVM is faster than FFNN but sacrificing 2% accuracy while grading mangoes.
Finally to compare performance of both classifiers, misclassifi-cation error rate is used. Type I and Type II errors are lowest for size code A and C respectively in both classifiers. Thus proposed classification method is appropriate for grading mangoes with CODEX size standards.
In future, additional data may be acquired to assess the robust-ness of the proposed method. More size metric features may have to be explored to improve the performance of automated mango size inspection.
7. REFERENCES
[1] Blasco and et. al. Automatic sorting of satsuma (citrus un-shiu) segments using computer vision and morphological features.Computer and Electronics in agriculture, 66:1–8, 2009.
[2] Tadhg Brosnan and Dawen Sen. Inspecting and grading of agricultural and food products by computer vision system-a review.Computer and Electronics in Agriculture, 36:193– 213, 2002.
[3] Tadhg Brosnan and Da-Wen Sun. Improving quality in-spection of food products by computer visiona review. Journal of Food Engineering, 61:3–16, 2004.
[image:6.595.51.285.453.586.2][5] Bundit Jarimopas and Nitipong Jaisin b. An experimental machine vision system for sorting sweet tamarind.Journal of Food Engineering, 89:291–297, 2008.
[6] Lawless and Heymann. Physiological and Psychological Foundations of Sensory Function, Chapter 2, Sensory Eval-uation of Food principles and practices. springer, second edition, 2010.
[7] Paolo Menesattia, Corrado Costab, Graziella Pagliaa, Fed-erico Pallottinoa, Stefano D’Andreab, Valentina Rimato-ria, and Jacopo Aguzzicand. Shape-based methodology for multivariate discrimination among italian hazelnut culti-vars.Biosystem Engineering, 101:417–424, 2008.
[8] Paulus and Schrevens. Shape characterization of new apple cultivars by fourier expansion of digitized images.Journal of Agricultural Engineering Research, 72:113–118, 1999. [9] P. Sudhakara Rao and S. Renganathan. New approaches for
size determination of apple fruits for automatic sorting and grading.Iranian Journal of Electrical and Computer Engi-neering, 1:90–97, 2002.