Non-Destructive Porosity Calculation of an Indian
Fermented Food “Khaman” using X-Ray
Microtomography and Image Processing
Hetal N. Patel
R.K.Jain
M.V.Joshi
Associate Professor Professor Professor EC Department, Food Processing Department, EC Department, A.D.Patel Institute of
Technology,New V.V.Nagar
A.D.Patel Institute of Technology,New V.V.Nagar
Dhirubhai Ambani Institute of Information and Communication
Technology, Gandhinagar
ABSTRACT
To meet the increasing demand of Indian fermented food which is health soothing and to maintain its quality, the automation of the process is a must. Automation helps in enhancing the quality of processed food products. The Indian food: “KHAMAN”, a fermented snack, is made up of pulses powder, oil, curd as starter and water. Thoroughly mixed batter is steamed to produce desired quality spongy “KHAMAN”. The microstructure of this food product is directly related with the textural properties of the food. This paper describes the image processing techniques for the calculation of the void space of the Indian fermented food known as “KHAMAN” using X-ray Microtomograpny (µCT).The X-ray Microtomogrphic images were used for the analysis of percentage void space in the cooked food. The analysis of void space (air measurement) was done using the volume analysis on the set of cross sectional images of the cooked food samples. The µCT is useful for full 3D imaging of large samples (e.g. khaman cake with a length of 10mm) with a resolution of about 6μm. The image analysis was used for the calculation of the % void porosity space in the food. The percentage of void space measured for different food samples using the algorithm were found close to the practical measurements.
Keywords:
Indian fermented food, khaman, voids space, X-ray Microtomogrphy (µCT).
1. INTRODUCTION
Indian fermented food, “KHAMAN” is known to be a popular snack item. It is prepared by batter of bengal gram flour, incorporating air by whipping/mixing action and fat. Right proportion of well mixed ingredients namely flour, water and fat followed by uniform slow rate of heating by steaming lead to expansion of air molecules incorporated during mixing. Right quantity of the fat gives the strength to the mould, which gives shape and structure. The whole product becomes spongy texture. The air bubble incorporated during the mixing process, expands its volume during steaming/heating. The microstructure will not only influence sensory properties but also the stability, shelf life and preparation time of the food products.
Computer vision system is applicable at various stages of production processes and they can offer quantification of various process or product related parameters. Authors in [1] have proposed a matching algorithm for aligning microscope images obtained using different modalities making use of cross-correlation of outputs from Prewitt’s edge filter. Bright
2. MATERIALS AND METHODS:
2.1
Sample Preparation
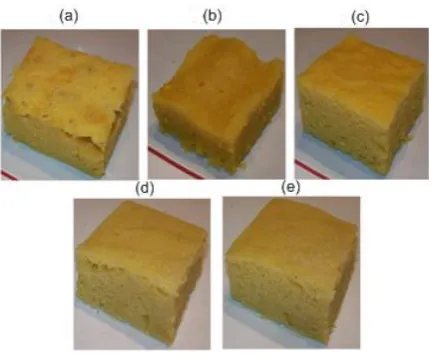
[image:2.595.318.534.70.248.2]The Indian fermented food: “KHAMAN” was prepared in the food-processing laboratory of A.D.Patel Institute of Technology. Differences in microstructure were achieved by application of different dough formulation with the variations in the raw material. The preparation of the fermented food started with the collection of raw materials such as Besan Gram Flour (300gm), Oil (7.225ml), salt (4.2gm), soda-bi-carbonate (1.68gm). The raw materials were accurately measured in an electronic balance (accuracy of 0.001gm). The raw materials were thoroughly mixed with water (225ml). The ingredients were mixed by gentle stirring. The prepared batter was used for the initial measurement of weight. The better poured in the circular vessel for steaming. Care is to be taken that lump formation doesn’t take place during mixing. Pre-decided quantity of slurry/batter (by volume) is poured in the container was subjected for open steaming for a pre-decided time. After steaming, the steamed salty cake was allow cooling at room temperature and weighed. Its size and volume was measured and recorded. A sample (4cm X 3cm) was cut trimmed from all sides and packed in nitrogen filled rigid container. The samples were sent to R&D laboratory at Belgium for X-ray Microtomography. The five kinds of batter were produced with the variations in the amount of oil and amount of soda-bi-carbonote while keeping the other parameters constant.The Indian fermented food known as “KHAMAN” was prepared in the food processing laboratory of A.D.Patel Institute of Technology, New V.V.Nagar. For the preparation of a spongy “KHAMAN” samples the formulations of flour/oil/air requirement is 100gm/4.82 ml/0.56gm. A set of five formulations of flour/oil/air ratio of 100 gm/2.41ml/0.56gm, a ratio of 100gm/4.82ml/0.28gm, ratio of 100gm/4.82ml/0.56gm, a ratio of 100gm/4.82ml/0.46gm and a ratio of 100gm/4.86ml/0.38gm was used to make a batter. A set of five batters were steamed in a circular vessel separately. The timing, weight of the batter and volume of the batter was measure initially. The weight, volume and height of the samples were measured once the food was cooked for further analysis. The set of five samples prepared with the variations in the amount of oil and sodium-bi-carbonate while keeping the other parameters constant (Fig 1).
Fig 1: Five set of Indian Food samples of “KHAMAN”
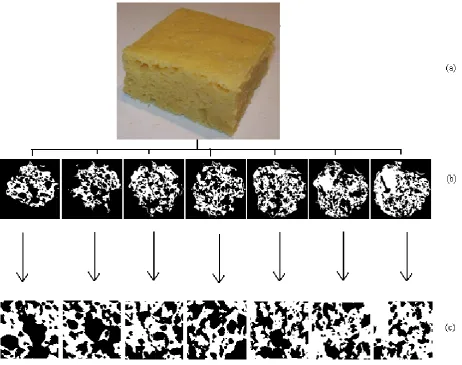
Fig 2 shows the picture of food sample of 3cm X 2.3cm X 1.5cm size. These samples were used for the scanning using X-ray Microtomography (µCT). The sample used for the imaging was of 10mm X 10mm X 0.8mm size. The µCT cross sectional images used in the algorithm were of different vertical depths ranging from 1µm to 800µm.The µCT cross-sectional binary images of this sample at an incremental depth of 100µm starting from 200µm to 800µm ,are shown in the fig. 2(b). Each cross sectional image was of 857 X 857 pixels. Total image area used in the algorithm, was calculated after eliminating the open pores of boundary and selecting a square region (351 X 351 pixels). The resultant images were shown in Fig 2(c).
2.2 X-Ray Microtomography(µCT)
Fig 2(a): Indian Fermented food sample of “KHAMAN”, (b) 2D µCT cross sectional images of the food sample at different incremental depth (100µm) from 200µm to 800µm, (c): Cropped µCT cross sectional images of the food sample at different
incremental depth (100µm) from 200µm to 800µm.
3. IMAGE PROCESSING ALGORITHM
For processing and analyzing the µCT scanned images, the image processing toolbox (www.mathworks.com) running under MATLAB (version 7, R2009 from Mathworks ) was used. The algorithm calculates the percentage porosity of 2D cross sectional images, which will be mathematically integrated to get percentage volume of the air space in the sample. The software was used on an Intel Atom Processor, 1.66GHz run on Windows 7.Many methods and systems were developed for 3D image display and visualization, these methods normally divided into two techniques: surface rendering and volume rendering. Both techniques produce the visualization of 3D volume images, and each has its advantages and disadvantages. The selection between these methods depends on the application and the result of the visualization [15].
Surface Rendering Techniques: it depends on the extraction
of contours, in which the surface of the structure is defined. These surface batches are placed at each contour point, then using the hidden surface removal and shading to render for contours. Also this techniques can take advantage of particular graphics hardware to speed the geometric transformation of rendering operations. The disadvantages of this technique based on the data required for building
contours, some image information is lost in this process. This method eliminates any interactive dynamic construction of the surface to be rendered.
Volume Rendering Techniques: it is based on ray-casting
algorithm that becomes powerful method for image visualization. 3D visualization of volume images is provided without the need of prior surface of object segmentation. The entire image volume is required in maintaining the original volume image data. This provide the capability and powerful of rendering the actual image data. Volume rendering techniques preserve high resolution details of the displayed structures. However, these techniques suffer from high computation to implement 3D visualization system.
3.1
Volume Estimation of Air Space
Volume estimation is an important step in the field of image visualization. Volume estimation means construction of 3D image from given cross-section 2D slice images. The procedure of construction depends on the following steps as shown in Fig 3[16]:
1) Read the input 2D µCT cross sectional images for food sample.
[image:3.595.65.528.70.435.2]3) Since in the binary image, the open pores don’t give the continuous boundary of the object (Fig 3), selectively crop the image from 270th row and 270th column pixel with the total width equal to height equal to the 350 pixels. So the resultant cropped images were of 351 X 351 pixels. Since the volume of the pore space is equal in the entire sample this step will not lost any useful data.
4) The 3D volume image after cropping the input images is shown in Fig 4. The 2D cross sectional images were now used for the calculation of the close pore space. The calculation of the pore area for each cross sectional image is the ratio of the black pixels (represent the air space) to the total no. of pixels. For every two consecutive cross sectional images, the pore area was computed.
5) The volume between two consecutive cross sectional images with the available pore areas from above step (4) was calculated as equation (2)[12].
√
Where, D is the distance between consecutive cross sectional images.
6) Above two steps were repeated for each consecutive pairs of µCT cross sectional image (Total no. of cross sectional images were N=600). Then the final air volume can be calculated using equation (3).
∑
[image:4.595.80.516.113.398.2]
Where, N is the number of cross sectional images and Vn is the volume between two consecutive cross sectional images.
Fig 3: Volume estimation from 2D slices
The scanned images were used by the algorithm for the measurement of percentage of void volume (porosity of 3D data), these values were compared with the known values measured manually in the laboratory of food processing department, A. D. Patel Institute of Technology (where cooking was made) regarding the amount of volume expansion from the batter to the cooked sample. The percentage of volume difference between the batter and the cooked food was used as a measure of the theoretical volume calculation for different food samples of “KHAMAN”.
4. EXPERIMENTAL RESULTS
The Indian fermented food “KHAMAN” samples were scanned using X-ray micro tomography for getting its microstructure. The scanned images at different projection angles varying from 0° to 360° with a step size of 0.300° resulting in an image of 1640 X 1640 pixels with pixel size of 9.94µm(resultant image is of 26734624µm), with frame rate of 0.226044 seconds, for the analysis of its quality parameters
like percentage of porosity ( 3D volume measurement of pore spaces). We proposed an image processing algorithms for the 3D Analysis of the Indian food sample known as “KHAMAN” in terms of its percentage porosity.
For image analysis, a set of 600 cross sectional µCT images for each sample of Indian food known as “KHAMAN” were used. The input images were converted to the binary images by using global thresholding technique suggested by Otsu (1979). The volume fraction of air bubbles was determined from the total stack of binary images by dividing the number of pixels identified as air bubbles by the number of pixels inside the sample holder. The size of the air bubbles were measured using a 3D measurement function (eq. 3).The results of the analysis were presented in Table I.
The amount of air bubbles varies as per the variations in the raw material during the cooking process (Fig 1). Table I shows the comparison between the manual results and the result of an image-processing algorithm.
TABLE I: Measurement (%) of Air volume of Indian food sample “khaman”
Sample No. Volumetric Calculation based Measurement (in laboratory during cooking )
Measurements results from the algorithm
Sample1 52.54 51.32
Sample 2 1.33 1.34
Sample 3 73.69 73.99
Sample 4 43.1 43.23
[image:4.595.88.506.251.401.2]The variation in results (in Table I) may be due to non-closed pore spaces.
Fig 4: 3D image of the cropped input cross sectional images (351 X 351 X 61) (6 cross sectional images shown for display purpose only)
As seen from the Fig 2, the image contains close and open pores of the food samples, During the processing of the cross sectional images the open pores was not used for the measurements, thus the values measured in the laboratory were different than that of the results obtained using the algorithm.
Many food products such as “KHAMAN”, “HANDVA and “DHOKLA” are manufactured in the form of an emulsion and subsequently aerated to foam. With these products, the protein present provides emulsion stability while the emulsifiers promote fat crystal agglomeration, which forms a matrix. This matrix provides structure and firmness to the foam.
The air bubbles are clearly visible (Fig 4) within the fat/protein/water matrix by their pixel values same as the background pixel values (low absorption coefficient). Air bubbles near the edge of the sampling holder are deformed. The volume fraction of the airs bubbles analyzed from the total stack of 2D images per food sample is listed in Table I. The graph of percentage pore area as a function of vertical distances is shown in Fig 5. The hardness of sample 2 is much higher than that of the sample 1, sample 3, sample 4 and sample 5. These were shown in Table I, having very low porosity as compared with the other samples. The green color plot in Fig 5 is the plot of percentage of pore area vs. the µCT cross sectional images for sample 2 (having very less amount of air).
Fig 5: Percentage of Pore area chart of Indian food samples :“KHAMAN”
4.1
Comparison with the existing Methods:
[image:5.595.316.535.306.497.2]Table II: Comparison in (%) pore area between our results and results from algorithm suggested in [5]
Cross sectional image of
Food sample 3
Dalen et. Al. [5] Results
Our Results
77.4667 51.5961
94.2196 67.3227
55.3626 61.2562
20.9248 77.1974
89.3503 57.0297
5. CONCLUSION
The Non-destructive Porosity Calculation of the Indian fermented food was made using image processing algorithm and X-ray microtomography (µCT). The processing algorithm can be conceptually applied to analyze and characterize micro-structure and internal properties of other types of micro-porous materials also. Combining 3D volume measurement and image processing techniques the proposed technique has proven to be an effective method for volumetric data segmentation and internal structure characterization. The results were quite similar to the original data. The computational efficiency improves greatly using the number of 2D cross sectional images for porosity measurement. Total 500 cross sectional sliced image per sample were used for calculation of quality parameters. The proposed algorithm proves to be providing best results for the processed food samples with variation in ingredients.
6. ACKNOWLEDGMENTS
The authors would like to thank to the Head of Electronics and Communication Engineering Department of A. D. Patel Institute of Technology for facilitating the work in the laboratory of the Department. The authors would like to thank Head of Food Processing Engineering Department of A. D. Patel Institute of Technology for availing laboratory of the Department .Authors also express sincere thanks to Dr. V. S. Patel, Director-SICART for his valuable suggestion, evaluation and encouragement during work carried out. Authors would express the sincere thanks to the R&D laboratory peoples for scanning the food samples using SKYSCAN 1172 instrument.
7. REFERENCES
[1] C.A. Glasbey and N.J.Martin, “Multimodal microscopy
by digital image processing”, Journal of Microscopy, vol. 181, pt.3,pp. 225-237,1996.
[2] G. Ginesu, D. Giusto, V. Margner and M. P. Meinlschmidt , “Detection of Foreign Bodies in Food by Thermal Image Processing”, IEEE Trans. on industrial Elect., vol.51, no. 2,pp. 480 -490, April 2004.
[3] G. van Dalen, “A study of Bubbles in Foods by X-Ray
Microtomography and Image Analysis”, Microscopy and Analysis, pp:S8-S12, 2012.
[4] G. van Dalen, P. Nootenboom, L.van Vliet, L.Voortman and E.Esveld , “ 3D Imaging and Analysis of porous cereal products using X-Ray Microtomography”,Image Analysis Stereology, vol.26, pp.169-177,2007.
[5] G. van Dalen, H.Blonk, H.Aalst and C. L.Hendriks, “ 3D imaging of Foods using X-Ray Microtomography”, G.I.T.Imaging and Microscopy, vol.3, pp.18-21,2003.
[6] J. Haedelt, S.T.Beckett, and K. Niranjan,
“Bubble-included Chocolate: Relating structure with sensory response”, Journal of Food Science, E: Food Engineering and Phaysical Properties, vol.00, no.0, pp:E1-E5,2007.
[7] Patel Krishna, A.Kar, S.N.Jha and M.A.Khan, “Machine
Vision System:a tool for quality inspection of food and agricultural products”, Journal of Food Science and Technology, Vol 49, No-2, pp.123-141, April-2012.
[8] M. Kuehn,M. Hausner, H. Bungartz, M. Wagner, P. Wilderer and S.Wuertz, “Automated Confocal Laser Scanning microscopy and semi automated image processing for analysis of biofilms”, Applied and Environmental Microbiology , vol.64, no-11,pp. 4115-4127,1998.
[9] N. Otsu "A Threshold Selection Method from Gray-Level Histograms," IEEE Trans. on Systems, Man, and Cyber. vol. 9, no. 1, pp. 62-66,1979.
[10] R. P. Haff and N.Toyofuku, “X-Ray detection of defects
and contaminants in the food industry”, Sensors and Instruments of Food Quality (Springer), vol.2, pp:262-273,2008.
[11] K.Kadhim and M. Shaban, “Efficient 3D Object
Visualization via 2D images”, International Journal of Computer Science and Network Security, vol. 9, no.11, pp.234-239, 2009.
[12] K SusheelKumar, V.Bhaskar Semwal, S. Prasad and R.C.Tripathi, “ Generating 3D model using 2D images of an Object”, International Journal of Engineering Science and Technology(IJEST), vol.3, no.1, pp.406-415,2011.
[13] K.Kadhim and M. Shaban, “Efficient 3D Object
Visualization via 2D images”, International Journal of Computer Science and Network Security, vol. 9,no.11,pp.234-239,2009.
[14] K SusheelKumar, V.Bhaskar Semwal, S. Prasad and R.C.Tripathi, “ Generating 3D model using 2D images of an Object”, International Journal of Engineering Science and Technology(IJEST), vol.3, no.1, pp.406-415,2011.
[15] Stephen M. Pizer, et al., “Deformable M-Reps for 3D
Medical Image Segmentation”, Internationa Journal of Computer Vision, 55(2/3), pp: 58-106, 2003. Kluwer Academic Publishers, Netherland.
[16] K. Krechetova et al., “3D Medical Image Visualization
and Volume Estimation of Pathology Zones”, NBC-14th


![Table II: Comparison in (%) pore area between our results and results from algorithm suggested in [5]](https://thumb-us.123doks.com/thumbv2/123dok_us/8099635.787362/6.595.49.289.95.417/table-comparison-pore-area-results-results-algorithm-suggested.webp)
