AN EFFICIENT IMAGE NOISE ESTIMATION TECHNIQUE
USING TYPE-2 FUZZY SET AND GENETIC ALGORITHM
1
T. MAHA LAKSHMI, 2DR. ALLURI SREENIVAS
1
Asst Professor, Prasad V Potluri Siddhartha Institute of Technology, Department of Electronics and Communication Engineering, India
2
Associate Professor, Gitam University, Department of Electronics and Communication Engg., India
E-mail: [email protected], [email protected]
ABSTRACT
Noise estimation in digital images plays an important role in various kinds of applications such as medical imaging, video processing and communication systems. Noise density estimation from an image can help to analyze the channel properties of a communication system. Some authors have been described with a few algorithms to estimate noise present in the images in the spatial and frequency domain. The quality of a captured image through image acquisition devices like camera or sensor will not be noise free because of some parameters like circuit noise and atmosphere conditions. The main objective of this project is to evaluate the noise levels at different parts of the image with the help of a new algorithm Interval Type-2 Fuzzy Sets Filter (IVT2 FSs) and Genetic algorithm (GA). In this, we have estimated the performance in terms of the Structural Similarity Index Metric (SSIM), Peak Signal to Noise Ratio (PSNR), Mean Square Error (MSE) and Noise Variation (NV).
Keywords: Interval Type-2 Fuzzy Sets Filter, Genetic algorithm, Structural Similarity Index Metric, Peak Signal to Noise Ratio, Mean Square Error.
1. INTRODUCTION
Image enhancement and the noise filtering are the major pre-processing steps in the digital image processing in various fields such as biomedical, photography, etc. These two tasks are very essential for image processing in the process of visual interpretation [1]. Many algorithms are reliable to image processing for estimation of noise levels in different parts of the images. The global illumination methods are one which used photo-realistic quality for generation of synthetic image generation. These methods completely depend on the stochastic paths which are generated by camera point of each pixel in the image [2]. Previously, linear filter has been used for image pre-processing to remove additional noise in the image. This Filter can preserve the edge and suppresses the noise. During this process, the data loss is the main limitation of the linear filter. The nonlinear filter has been used for edge preservation without any data loss. Due to the imperfection of camera points, the images commonly affected by noise. Impulse noise is mostly affected by memory location hardware, camera sensors and errors in the data transmission. Impulse noise is commonly classified
into two types such as random valued shot noise and salt and pepper noise. In the random values shot noise, an arbitrary value can be assigned to the noisy pixels. The noised pixels took only minimum or maximum values when compared to the surrounding pixel if the image is having salt and pepper noise. So, it is a bit hard to remove these kinds of noise using linear filters. To overcome this problem, fuzzy set (FS) based filters [3] are used to analyze the pixel variations in the spatial domain by using a fuzzy rule set.
system, the uncertainty of lively cutting forces for the micro milling machine was determined. With the sensor observations, we can also measure the instantaneous cutting force of the micro milling along with the noise estimation. Interval type 2(IT2) rule-based system gives much information regarding machine tool controller for its operation [5].
A new Type-2 fuzzy Gaussian Mixture Models (T2 FGMMs) were introduced for image noise estimation process and gives a good performance measure in denoising process. In this work, based on the spatial information of the pixels, the core region and the open region of the image were extracted. The GMM parameters of the core region and an open region were estimated with the support of the EM algorithm and finally. The Bayesian decision was applied on an image to get denoised image [6]. Ordinary filters were not able to eliminate the several types of noises, so to remove several kinds of noises classical filter has been introduced. It has the capability to remove the more than one type of noise from the images [7]. It is significant that routinely measure the quality of the image is precisely to characterize images of photographic quality. Many algorithms are a great concern in image compression (JPEG models) and in image synthesis. Image quality measures are usually divided into three models such as no reference [8], reduced-reference models and full reference (such as the SNR and measure SSIM [9]). Existing methods have some limitations such as low PSNR, SNR, SSIM and less optimized. The linear equalizer has been used for optimization with reference to the SSIM in the image restoration process [10]. The proposed method is going to overcome by optimizing significant peaks in each block separately with the different sets of chromosomes and gives better values of PSNR as well as SSIM values with the support of GA.
2. RELATED WORK
Samuel Delepoulle et al. [11] have showed the typical FS has included in image processing which is generally fuzzy numbers. FS defines the meaning demonstration of the vagueness related with a linguistic variable A in a natural language. However, it is not possible to say which Membership Function (MF) is the finest one. The amount of uncertainty is hard to compute in the instance of FS’s, and specifically when images were degraded noise. The major enthusiasm of this article is to remove the uncertainty of membership values by using interval-valued FS’s. Author algorithm has
explained the fixed values of the support value such as α =2 and 3.
Olivia Mendoza et al. [12] have showed the improvement of edge finders depends on the gradient measure with the support of IT2 fuzzy logic. The development is on the representation of vagueness in image gradients and their combination with the IT2 fuzzy integral. The insertion of uncertainty in gradients supports to find true edges which will be ignored with an alternative method. The method which was used in this article, to recognize shapes in images with very flexible contrast or in applications which necessity to find additional edges in images than the conventional methods. The aim of the author is to evaluate performance, the quality of the identified edges with conventional and enhanced edge detectors was measured by Pratt's figure of merit with synthetic images.
Samuel Delepoulle et al. [13] have proposed an innovative no-reference image content metric, based on type-2 FS’s. It does not need any earlier knowledge about the trial image or noise. Entropy value drops monotonically either when the image becomes distorted or noisy. Therefore, it would be useful in the detection of noise as well as blur. With reference, image quality degree is frequently expensive to obtain the results. This is the main drawback of Computer-Generated Images (CGI) use of global illumination methods. The key aim of global illumination methods is to produce CGI with photorealistic quality. To this tenacity light interaction and photon propagations with the matter have to be precisely simulated.
document image datasets and found the accurate results.
Miguel Fidalgo-Fernandes et al. [15] have explained the quality estimation model with the location, spatial and content factors content on the perception of quality. The major content of an image is the area where impairments might have more impact on the definition of quality. The disposition of the impairments and their global location should have a strong influence. The quality estimation by machine learning methods was based on the SSIM evaluation locally in small cells.
3. PROPOSED METHODOLOGY
The proposed method is going to minimize the MSE and noise variance but it increases PSNR and SSIM value of the CGIs. Let g be the noise corrupting image which is additive, unvarying and has zero mean (i.e., white noise):
( . ) ( , ) ( , )
G m n =g m n +η m n (1)
From Eqn (1) g (m, n) is the ideal image. G (m, n) is the observed image and η is the noise density component. The aim is to calculate the variance var(η) of η. Many researchers were presented algorithms to evaluate the features of noise in binary images. These methods attack the evaluation problem in one of the two ways
1.By filtering G to suppress the image structure and then evaluating var(η) from the filtered data
2.By evaluating var(η) from the variance of G, in a set of image regions initially classified as showing little structure.
This project is offering a method to fit the first family among two, starting from the smoothing of the image G. With the ultra-fuzziness index, new image filters were introduced for image denoising. Local and global properties of the pixels have been achieved by using this kind of filter. In this project presenting this index for effective measure noise level in the CGIs and for images noise estimation. The new image J can be obtained after the filtering noise of the image G.
The uncertainty of Membership function (MF) of a specific FS is demonstrated with the support of interval δ(x) in an Interval Type-2 Fuzzy Set (IVT2FS). Uncertainty is more for longer interval δ(x). Due to this reason selection of MF is greatly important. The proposed method for image de-noising and noise evaluation with GA is explained in forthcoming discussions.
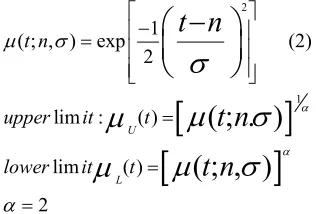
Let us define Gaussian fuzzy number is defined as
2
1
( ; , ) exp
2
t n
t n
µ σ
σ
− = −
(2)[
]
[
]
1
lim : ( )
lim ( )
2
( ; . )
( ; , )
U L
upper it t
lower it t
t n
t n
α α αµ
σ
µ
µ
σ
µ
= = =In noise power estimation of the CGIs using IVT2FS filter, we need to consider two parameters such as fuzziness degree and entropy are given by Eq. 3, & 4. These parameters support to measure the uncertainty in fuzzy logics.
Now let us define IVFS imprecision degree Ind (A) of an IVFS
U j L j 1
( ) (t ) - (t )
n j
Ind X µ µ
=
=
∑
(3)Define another parameter index of fuzziness
[
]
1
U L 0
1
( ) ( ) (t) - (t)
N t
t h t
AxB µ µ
−
=
Γ =
∑
(4)The eq(3) shows the movement of IVT2FS over the interval [0,N 1] of the histogram of the image by changing j with keeping σ fixed. MAX(Γ) is computed for all the blocks, for image X Γ(t) increases as image turn to be less noisy and which is used for further noise estimation.
[image:3.612.349.507.125.232.2]PSNR of the image, from this we achieve the noise free image.
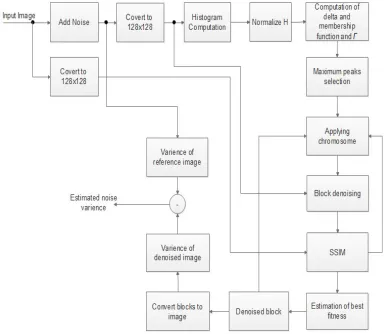
Figure 1: Block diagram of proposed method
The fig. 1 describes the block diagram of the proposed methodology. Initially, image G of size MxN is spitted into K blocks using MATLAB function and calculate the histogram for each block and normalized to 1. Set the position of MFs With the use of normalized histogram values and compute the entropy of each block. After calculate the Γ(t) for each block from equation (4), find the maximum peaks of the image. Once we obtained the maximum peaks then apply the chromosome set to each block for de-noising of the image and compute SSIM of each block. Here we have chosen 10 chromosome set for denoising of the each block, and each set is applied to patch to denoise the image
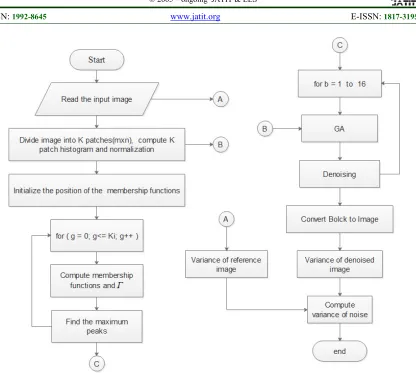
Figure 2: Flow Chart For Noise Estimation Algorithm Using IVFS Filter
The fig.2 shows the flow chart for the noise estimation algorithm using IVFS filter, here input image is noisy image and this noise can be eliminated by using an efficient GA based IVFS filter. By using different set of chromosomes, the noise free image are obtained and estimated the performance of the system.
Algorithm: Genetic algorithm
Input image: A x B gray level image G
Divide the image G into K sub-patches of size p x q
Choose the shape of the MF
Find the image histogram of each patch and normalized to1
Initialize the position of the MF
Move the MF on the gray-level range
for n = 0 to N− 1 do
for t = 0 to N − 1 do
Compute
Compute
Compute n( ) ( ) ( ) ( )
U L
t =h t
µ
t −µ
t ∆
end for
Compute
1 n 0
1
(t)
N n
t AxB
−
=
Γ =
∑∆
end for
Find the maximum peaks in each block
for b = 1 to the number of blocks do
for CS = 1 to maxCS do
Apply chromosome for block
end for
Obtain de-noised block
else
Normal operation
end if
Update the maximum fitness value
end for
Estimate the best fitness
Convert block to image
Estimate variance of de-noise image J and reference image G and variance of noise = G – J.
4. EXPERIMENTAL SETUP
The proposed method was implemented in MATLAB version R2015b to obtain the variance of noise that was present in the CGIs. The complete work was done by using the I7 system with 8 GB RAM. A different set of chromosomes was applied to each block of the image to obtain the best values of PSNR and SSIM.
5. RESULTS AND DISCUSSION
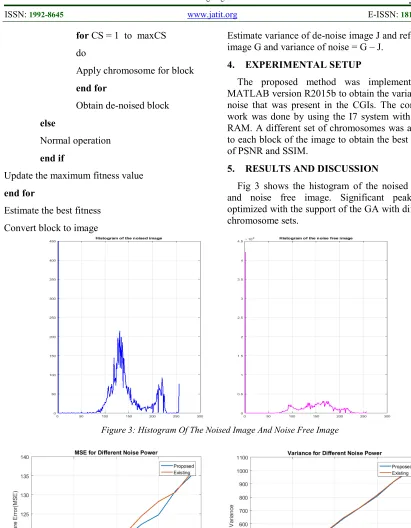
[image:6.612.86.497.64.592.2]Fig 3 shows the histogram of the noised image and noise free image. Significant peaks are optimized with the support of the GA with different chromosome sets.
Figure 3: Histogram Of The Noised Image And Noise Free Image
[image:6.612.96.514.513.673.2]Figure 5 (A): Comparison Of PSNR Value Figure 5 (B): Comparison Of SSIM Value
[image:7.612.89.525.66.255.2]The overall performances are shown in fig.4. (a), fig.4. (b), fig.5. (a) and fig.5. (b). The proposed MSE value and noise estimation values is less compare to the existing method, which is shown in fig.4. (a) and fig.4. (b). Similarly, PSNR value and SSIM value of the proposed method have been increased than existing method, which is shown in fig.5. (a) and fig.5. (b).
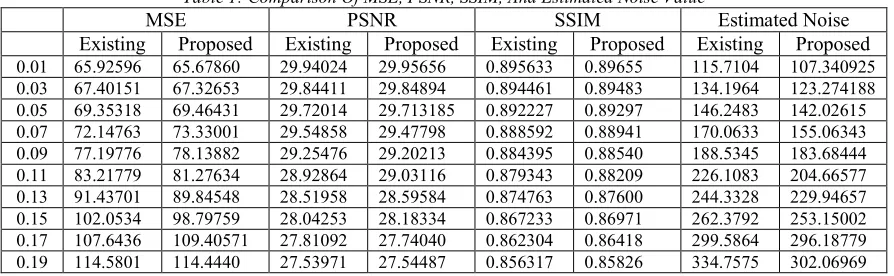
Table 1: Comparison Of MSE, PSNR, SSIM, And Estimated Noise Value
MSE PSNR SSIM Estimated Noise
Existing Proposed Existing Proposed Existing Proposed Existing Proposed
0.01 65.92596 65.67860 29.94024 29.95656 0.895633 0.89655 115.7104 107.340925 0.03 67.40151 67.32653 29.84411 29.84894 0.894461 0.89483 134.1964 123.274188 0.05 69.35318 69.46431 29.72014 29.713185 0.892227 0.89297 146.2483 142.02615 0.07 72.14763 73.33001 29.54858 29.47798 0.888592 0.88941 170.0633 155.06343 0.09 77.19776 78.13882 29.25476 29.20213 0.884395 0.88540 188.5345 183.68444 0.11 83.21779 81.27634 28.92864 29.03116 0.879343 0.88209 226.1083 204.66577 0.13 91.43701 89.84548 28.51958 28.59584 0.874763 0.87600 244.3328 229.94657 0.15 102.0534 98.79759 28.04253 28.18334 0.867233 0.86971 262.3792 253.15002 0.17 107.6436 109.40571 27.81092 27.74040 0.862304 0.86418 299.5864 296.18779 0.19 114.5801 114.4440 27.53971 27.54487 0.856317 0.85826 334.7575 302.06969
According to table.1, MSE value has been be reduced and PSNR value is inversely proportional to MSE. Similarly, SSIM values also compared to analyze the percentage of structural distortion happened in the image.
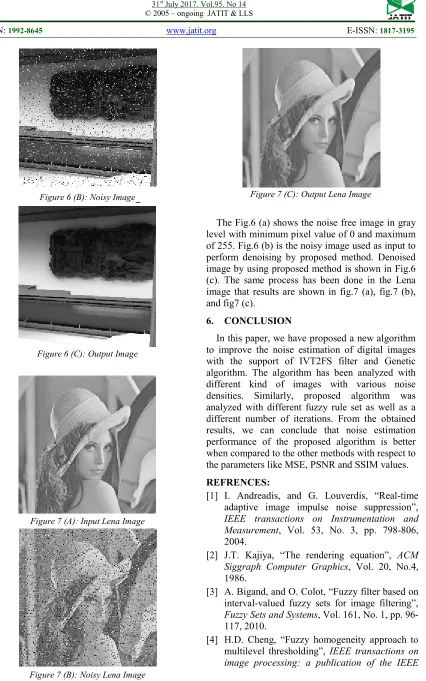
[image:7.612.84.531.401.539.2] [image:7.612.350.489.558.700.2]Figure 6 (B): Noisy Image
Figure 6 (C): Output Image
Figure 7 (A): Input Lena Image
Figure 7 (B): Noisy Lena Image
Figure 7 (C): Output Lena Image
The Fig.6 (a) shows the noise free image in gray level with minimum pixel value of 0 and maximum of 255. Fig.6 (b) is the noisy image used as input to perform denoising by proposed method. Denoised image by using proposed method is shown in Fig.6 (c). The same process has been done in the Lena image that results are shown in fig.7 (a), fig.7 (b), and fig7 (c).
6. CONCLUSION
In this paper, we have proposed a new algorithm to improve the noise estimation of digital images with the support of IVT2FS filter and Genetic algorithm. The algorithm has been analyzed with different kind of images with various noise densities. Similarly, proposed algorithm was analyzed with different fuzzy rule set as well as a different number of iterations. From the obtained results, we can conclude that noise estimation performance of the proposed algorithm is better when compared to the other methods with respect to the parameters like MSE, PSNR and SSIM values.
REFRENCES:
[1] I. Andreadis, and G. Louverdis, “Real-time adaptive image impulse noise suppression”,
IEEE transactions on Instrumentation and Measurement, Vol. 53, No. 3, pp. 798-806, 2004.
[2] J.T. Kajiya, “The rendering equation”, ACM Siggraph Computer Graphics, Vol. 20, No.4, 1986.
[3] A. Bigand, and O. Colot, “Fuzzy filter based on interval-valued fuzzy sets for image filtering”,
Fuzzy Sets and Systems, Vol. 161, No. 1, pp. 96-117, 2010.
[image:8.612.107.533.48.729.2]Signal Processing Society, Vol. 7, No. 7, pp. 1084-1086, 1997.
[5] Q. Ren, “Modelling of dynamic micromilling cutting forces using Type-2 fuzzy rule-based system”, Proceedings of IEEE International Conference on Fuzzy Systems (FUZZ), pp. 1-7, 2010.
[6] X. Kai, W. Fangfang, and Q. Kun, “An image segmentation method based on Type-2 fuzzy Gaussian Mixture Models”, Proceedings of International Conference on Image Analysis and Signal Processing, pp. 363-366, 2010. [7] S. Anand, and N. Kaur, “New Fuzzy Logic
Based Filter for Reducing Noises From Images”, IJCST, Vol. 2, No. 2, pp. 322-326, 2012.
[8] R. Ferzli, and L.J. Karam, “No-reference objective wavelet based noise immune image sharpness metric”, Proceedings of IEEE International Conference on Image Processing, Vol. 1, 2005.
[9] G. Chen, Y. Shen, F. Yao, P. Liu, and Y. Liu, “Region-based moving object detection Using SSIM”, Proceedings of 4th IEEE International Conference In Computer Science and Network Technology (ICCSNT), Vol. 1, pp. 1361-1364, 2015.
[10] S.S. Channappayya, “SSIM-optimal linear image restoration”, Proceedings of IEEE International Conference on Acoustics, Speech and Signal Processing, pp. 765-768, 2008. [11] S. Delepoulle, A. Bigand, and C. Renaud,
“Interval type-2 Fuzzy Sets-based no-reference quality evaluation of synthetic images”,
Proceedings of CGVR, Vol. 11, 2011.
[12] O. Mendoza, and P. Melin, “Interval type-2 fuzzy integral to improve the performance of edge detectors based on the gradient measure”,
Proceedings of Fuzzy Information Processing Society (NAFIPS), pp. 1-6, 2012.
[13] S. Delepoulle, A. Bigand, and C. Renaud, “A no-reference computer-generated images quality metric and its application to denoising”,
Proceedings of 6th IEEE International Conference Intelligent Systems, pp. 67-73, 2012.
[14] P. Ye, J. Kumar, L. Kang, and D. Doermann,
“Real-time no-reference image quality
assessment based on filter learning”,
Proceedings of the IEEE Conference on Computer Vision and Pattern Recognition, pp. 987-994, 2013.