5674
CLUSTERED HEED SCHEME FOR CONGESTION
AVOIDANCE IN COGNITIVE RADIO SENSOR NETWORKS
1JANANI .S, 2RAMASWAMY .M2, SAMUEL MANOHARAN .J3
1Assistant Professor, Department of ECE, A.V.C College of Engineering, Mannampandal, India-609305. 2Professor, Department of Electrical Engineering, Annamalai University, Annamalai Nagar, India-608002.
3Professor& Head, Department of ECE, Bharathiyar College of Engineering and technology, Karaikal, India-609609.
E-mail: 1 [email protected], 2 [email protected], 3[email protected]
ABSTRACT
Reliable and high throughput data delivery in cognitive radio sensor networks (CRSN) remain an open challenge owing to the inability of the source to quickly identify and react to challenges in spectrum availability. The paper proposes a novel congestion control scheme called Enhanced congestion detection and avoidance (ECODA) for CRSN to operate in a mobile framework. It articulates a clustered HEED based mechanism in an effort to exploit the available spectrum on the principles of the cognitive radio technology. The ECODA involves a threefold methodology in order that it uses a dual buffer threshold and weighted buffer difference for congestion detection and a bottleneck-node-based source sending rate control and multi-path loading balancing. The attempt owes to evaluate its performance on a NS2 platform and bring out the improvement in indices through the use of the congestion avoidance mechanism. The results project far reaching impacts in the sense it portrays the viability of the procedure and allows it for exploring fresh applications in this domain.
Keywords:Cognitive radio sensor networks, ECODA, Clustered HEED, Throughput
1. INTRODUCTION
The demand for radio spectrum continues to increase due to the emergence of wireless applications in different perspectives and as a consequence augurs the growth of communication infrastructure in a variety of fields. The existing wireless networks characterized by static spectrum channel allocation belong to a licensed user, known as primary user (PU) on a long-term basis. However the existence of licensed spatially- time idle relates to inefficient utilization of large portion of the wireless spectrum.
A cognitive radio based wireless sensor network (CRWSN) or cognitive radio-based sensor network (CRSN)falls in the category of a multichannel wireless network in which the sensor nodes dynamically adapt themselves to the available communication channel[3].The CRWSN accrues a host of advantages that include communication reliability and multi-path environment[4].Leveraging on the benefits of the opportunistic spectrum access provided by cognitive radio technology, the wireless sensor
networks (WSNs)acquire the potential of operating at lower licensed spectrumband[2].
The cognitiveradio (CR) forges to be a promising paradigm forspectrum utilization within decreased quality of service (QoS) in wireless sensor networks. It urges to be the key technology for dynamic spectrum access (DSA) and enjoys the capability to share the wireless spectrum with licensed users. It results to improve spectrum efficiency and network performance by adaptively organizing the channel access to different users according to the radio environment characteristics.
5675 The occurrence of congestion reduces the throughput and increases the number of retransmissions which indirectly reduces the lifetime of the network [5]. It emanates either from a transient nature caused by link variations or due to persistent state because of source data sending rate. The congestion control mechanism can be classified into two categories in the form of end-to-end congestion control and hop- by-hop congestion control. The End-to-end congestion control performs exact rate adjustment at source and intermediate nodes according to current QoS level at sink node. The end-to-end orients to heavily rely on round-trip time (RTT), which results in slow response and low convergence [5].
Each node uses the packet transmission duration to estimate the channel capacity in congestion control and fairness (CCF) [6]. The congestion control becomes necessary in diverse range of applications and consists of the congestion and interference detection and a rate control mechanism establishment to adjust the reporting rate. The mechanism based on rate regulation between nodes use additive increase multiplicative decrease (AIMD) methods to balance the offered capacity, but does not support the nodes interference which turns out to be the main cause for the loss of packets [8].The slew of metrics used for detecting congestion include the buffer length, packet inter arrival time, packet service time and channel load among others [7].
A TDMA schedule has been laid to ensure maximum throughput and fair rate allocation by taking into account the requirement imposed on the network lifetime [8]. The lexicographic Max-Min algorithm has been used to formulate the rate allocation along with fairness, maximum throughput and slots reuse in the purpose to reach a minimum frame length [9].The initiative nodes have been forced to follow a schedule in order to transmit, receive or sleep in a slotted manner in accordance with the time synchronized channel hopping (TSCH) [10].
The TSCH schedule has been developed to indicate which channel to use as IEEE 802.15.4e and which neighbour to communicate within the concerned active slot for allowing many couples of nodes to communicate at the same slot using different channel offsets [5]. It has been proposed for optimizing the performance of low-power multi-hop networks along with an innovative approach for matching and coloring procedures to
plan the distribution of the slots and channel offsets across the entire network topology graph [11].
A traffic aware scheduling algorithm that builds a centralized schedule based on the network topology has been articulated. The traffic scheduling algorithm has been ordained to manage queue eliminating traffic congestion and thus avoid packet drops due to overflow of memory buffer [12]. It has been framed to allocate timeslots and channel offsets based not only on network topology but also on traffic conditions.
The traffic load generated by each node has been formulated together with a distributed version of the scheduling algorithm [13]. Within the 6TiSCH architecture, the 6top sub-layer has been entrusted to schedule the communication resources in time and frequency. The on-the-fly (OTF) bandwidth reservation module has been evolved as a distributed approach for adapting the scheduled bandwidth to network requirements.
A schedule based on the fly has been constructed according to the change in nodes demand and obtain a slot-based “step-by-step” energy consumption model of the TSCH schedule mechanism [14]. It has been applied to different scenarios for bringing out the potential effects of network congestion. The reliable, efficient, fair and interference aware congestion control (REFIACC) has been sought to prevent the interferences and ensure a high fairness of bandwidth utilization among sensor nodes by scheduling the communications [15]. The congestion and interference in inter and intra hot spots have been mitigated taking into account the dissimilarity between the links capacities in the scheduling process.
The congestion d etection and avoidance (CODA) has been extracted by jointly sampling the channel loading during every epoch and monitoring the buffer length for being filled to predict the occurrence of congestion [16]. It has been noticed that the backpressure message intensifies congestion due to high channel loading and needs explicit ACK from the sink to enable the lowering of the sending rate.
5676 vacant channels and enable the reduction in congestion.
The congestion has been avoided by means of setting thresholds and fixing priority [19], hop by hop congestion control scheme and persistent congestion bottle-neck based rate control attempted to increase the throughput of the network. The sending rate of collecting cognitive radio sensor in rate based generic additive-increase multiplicative decrease (AIMD) and additive increase and additive decrease(AIAD)congestion control schemes has been showcased to reduce congestion in sensor network [20].
Despite the developments in either identifying or preventing the occurrence of congestion, still the procedure requires enhancements in the process of routing to ensure the safe delivery of the packets to the destination.
2. PROBLEM DESCRIPTION
The main emphasis entices to formulate a multipronged strategy to avoid the occurrence of congestion in a CRSN and assuage an increase in the throughput of the network. It orients to trace the path of ECODA that serves to detect the congestion, bring in a control of the sending rate and be-hive a multi-path loading balancing facility. The procedure revolves around the use of a cluster based philosophy and examines the performance using NS-2 based simulation for HEED routing method. It bestows to establish the merits of the HEED scheme through the metrics obtained and enumerate its suitability for use in practical networks.
2.1 HEED Protocol
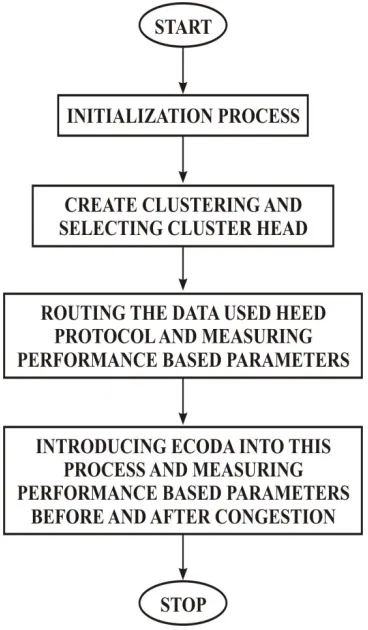
The Hybrid Energy Efficient Distributed Clustering (HEED) uses a distributed clustering architecture where it creates the cluster through a specific number of iterations. The clustered HEED owes to identify a set of CHs which can cover the entire field and deployed with n sensor nodes. Each node belongs to exactly one and only one cluster and engages to communicate with the CH in a single hop. While the clustering occurs in iterations of fixed numbers, the nodes perform the role of either CH (considering nodes with high residual energy and high proximity to the BS) or a regular node. The main feature of HEED relates to the convenience of multiple transmission power levels at the sensor nodes and since the cluster formation revolves around the theory of maximum load balance and increased life time, it allows HEED to
be applicable for those which require scalability, fault tolerance and extended life time.
The HEED works on first in the initialization phase, where the sensor nodes prompt probabilities to become CHs, and in the main processing phase the various procedures elect the CHs. The sensor nodes join the least communication-cost CH or announce itself as a CH in the finalization phase. It follows it up with a dynamic re-clustering at the beginning of each round in a predefined period of time.
The main advantage of HEED augurs the fact that it does not allow any node to be in more than one cluster. It enables a uniform CH distribution; but terminates after a fixed number of iterations and requires re-clustering to be initiated again.The HEED clustering improves network lifetime as it considers the nodes energy level for CH selection. The nodes only require local (neighbourhood) information to form the clusters. The energy distribution leads to enhancement in the lifetime of the nodes and stability within the network.
The Fig.1 explains the steps involved in the process of HEED based data transfer.
5677
3. SYSTEM MODEL
The CRSN comprises of a large number of sensor nodes deployed either inside or very close to it and each node consists of sensing and data communication components to process the information before being sent to the base station. The sensor nodes characterized by a small memory power operating with little battery power self-organize themselves with each other in a wireless manner.
When the primary user is inactive, the secondary user received signal as seen from Eqn. 1 is
𝑦 𝑛 𝑢 𝑛 (1)
When the primary user is active, the secondary user received signal turns out to be as in Eqn.2
𝑦 𝑛 𝑠 𝑛 𝑢 𝑛 (2)
The normalized throughput is given by Eqn.3
𝑇 1 𝑃 𝑃 (3)
WhereTF is the frame duration
PC is the probability that primary user does not start
transmission
Pf is the false alarm probability
When the primary user follows an exponential on-off traffic model with mean durations of on periods denoted by β,PC is given by Eqn.4 and Th by Eqn.5
𝑃 exp (4)
Then
𝑇 1 𝑃 exp (5)
The average overhead per user is given by Eqn.6
𝑇
√ (6)
Where C is the speed of light
When the number of user’s increases, TC increases
and the overhead is given by Eqn.7
𝑇 √ 𝐼 (7)
Where I is the number of users.
The energy detection is given by Eqn.8
𝐸 ∑ 𝑦 𝑛 (8)
Where N is the number of users
The Total delay, Td denoted by Eqn.9
𝑇 𝑃𝑟𝑜𝑝𝑎𝑔𝑎𝑡𝑖𝑜𝑛 𝑑𝑒𝑙𝑎𝑦 𝑇𝑜𝑡𝑎𝑙 𝑑𝑎𝑡𝑎
𝐷𝑎𝑡𝑎 𝑐𝑎𝑝𝑎𝑐𝑖𝑡𝑦 𝑜𝑓 𝑝𝑎𝑡ℎ
(9)
3.1 Proposed Methodology
5678
[image:5.612.103.287.340.655.2]Figure-2. Clustered network topology
Fig.3 Flowchart for Proposed Approach Congestion Detection The philosophy assuages to precisely measure local congestion level at each node through the use of dual buffer thresholds and the difference between the weighted
buffers. The buffer defined using accept, filter and reject states as Fig.4.1 1 indicates long with the two thresholds Qmin and Qmax serve to border the different buffer states, which reflect different channel loading, The reject state echoes that a good number of packets may be rejected because of a higher buffer utilization. In the event of a node’s buffer occupancy exceeding a defined threshold and its data enjoying a higher priority in the neighborhood, it sets the corresponding congestion level bit in the outgoing packet header.
Accept State Filter State Reject State
0 Qmin Qmax Queue
Figure-4.1.Buffer States
On the occurrence of congestion, it envisages dropping packets from the tail rather than any position in the queue. However if the queue in a sensor node becomes nearly full because of low priority packets, then it necessitates to ensure that the arrival of a high priority packet drops the low priority packet.
The presence of two sub-queues for local generated traffic and route-through traffic as seen in Fig. 4.2 allows the packets to be grouped by sources in the route-through traffic queue. It sorts the packets using their dynamic priority and follows a round robin algorithm for transferring the data, in the sense when a packet travels from one source to route-through traffic queue, immediately thereafter it allows a local generated packet.
Fig.4.2 Queue Model
[image:5.612.358.519.495.622.2]5679 If Qmin≤N≤Qmax, then it drops some packets with low dynamic priority or engages to be overwritten by subsequent packets with high dynamic priority as a result of which the expected average buffer length increases at a rate of R≤δ1.
If Qmax≤N≤Q it drops some packets with high dynamic priority or overwrites to enable the expected average buffer length increase at a rate of R≤ δ 2. δ 1 and δ 2 constitute the two variables that can be tuned to achieve an optimal system performance.
When the transfer reaches Qmin the traffic around the node becomes slightly congested and drops some packets with low dynamic priority to limit R≤ δ 1.
On the other hand when it reaches Qmax, it drops some packets with higher dynamic priority to limit R≤δ2
The procedure allows each source node Si ( i=1, 2, 3...) to maintain its data sending rate Gi and periodically update it according to its neighbor’s congestion level. Owing to the many to one characteristic, even if the source nearby nodes send data smoothly, there exists a possibility for the occurrence of congestion in the downstream (sink side).
The process involves the use of the bottleneck node based source data sending rate control for regulating the traffic. It includes determining the routing path status from a certain node to sink, detecting bottleneck node and sending the source data increase its data sending rate additively. In ECODA, the source data sending rate can be exactly set as 1/Dmax upon receiving a message from downstream.
Though the current approaches usually adopt single buffer threshold to measure congestion, multiple and different buffer thresholds appear to maintain the identical data sending rate of the neighbourhood nodes to ensure fairness. The two thresholds QminandQmaxseen in Fig. 4.1 serve to differentiate between the different buffer states of either accept or filter or reject, which reflects the different channel loading. If a node’s buffer occupancy exceeds a certain threshold and its data accrues a higher priority among its neighbourhood, then the corresponding congestion level bit goes to be set in its outgoing packet header.
The tree structure in a conventional sensor network owes to be unfair in bandwidth allocation for nodes at different depths of the network. While the nodes near a sink enjoy a greater priority to send their own generated packets to the sink, those far from the sink require sending their packets through many hops and experience a long delay. The
Flexible Queue Scheduler distinguishes between locally generated and route-through traffic be-hives every packet with static and dynamic priority.
The packet static priority represented as an integer carries the lowest static priority SP (packet)
= 0.The dynamic priority DP expressed using Eqn.10 changes with the number of hops and delay and involves two parameters (δ1, δ2) to limit buffer increasing rate and filter packets with the delay measuring the time from the time of packet generation time to the current time.
DP (Packet) =α* hop +SP (Packet)/1+β*delay(10)
If buffer incoming rate is BI and buffer outgoing rate BO, then the buffer changing rate and the weighted buffer changing rate respectively written as in Eqns.11 and 12
R=BO-BI (11)
WR=DP (BO)-DP (BI) (12)
The weighted queue length is defined as in Eqn. 13
WQ=Σ DP (Packetj) (13)
Rule 1: Suppose a series of packets{p1,p2,p3,…},their SP and DP are respectively denoted as SP(p1), SP(p2), SP(p3),… DP(p1), DP(p2), DP(p3),…If SP(p1)< SP(p2)< SP(p3)…,then the following relationship is determined : DP(p1)< DP(p2)< DP(p3)…
Combining Def.1 and Rule 1, it follows that packets with same SP may inherit a different DP and packets with higher SP to carry a higher DP.
The algorithm for rate control algorithm follows the steps explained as
Event {
a0: receive back pressure message;
a1: receive downstream maximum one hop delay Action Set {
b0: additively increase data forwarding rate; b1: multiplicativelydecreasedata forwarding rate; b2: multiplicativelydecreasedata sending rate; b3: set data sending rate tobe1/Dmax
5680 Node type {
c0: anode which forward data generated by other nodes
c1: anode which generates data, but does not forward data c2: anode has c0 and
c1simultaneously }
3.3Operations in forwarder node:
Step 1: If node is of c0 type and not of c1 type, perform b0 action.
Step 2: Else if perform b1 action.
Step 3: If event is not equal to a0, perform b0 action or else perform b1 action.
Step 4: If multiple path exist perform b4 action.
3.4Operations in source node:
Step1: If node is of c1 type and not of c0 type, perform b3 action.
Step2: If event is of a0 or a1 type, perform b3 action.
Step 3: If event is of a0 type, perform b2 action. Step 4: If multiple path exist perform b4 action.
The CHs may be assigned to handle additional tasks such as the collection and dissemination of spectrum availability information and the local bargaining of the spectrum. It assuages the inherent resource constraints and the requirements of the opportunistic access in CRSN.
4. SIMULATION RESULTS:
The NS2 network model in Fig.5shows the two hundred and fifty nodes distributed in a space of 1000 m x1000 m and remain free from energy dissipation in the idle or carrier sensing mode. The nodes form the clusters and elect the CH based on the energy level of the nodes. It urges to carry the data between the chosen three source and destination nodes in the network.
The Heed based clustering algorithm follows a distributive methodology in the sense it considers energy by utilizing the residual energy of nodes and communication cost to choose the best set as cluster head (CH) nodes. At the beginning of the grouping phase, a node with higher energy level is more probable to be selected as a CH. When several nodes are candidates for being a CH, the node with the lowest inter-cluster cost emerges to be the CH.
The probability of a node to be a CH is given by the formula in Eqn. 14.
𝐶 𝐶 (14)
Where
𝐶 𝑖𝑠 𝑡ℎ𝑒 𝑝𝑟𝑜𝑏𝑎𝑏𝑖𝑙𝑖𝑡𝑦 𝑜𝑓 𝑏𝑒𝑖𝑛𝑔 𝑐𝑙𝑢𝑠𝑡𝑒𝑟 ℎ𝑒𝑎𝑑
𝐸 𝑖𝑠 𝑡ℎ𝑒 𝑒𝑛𝑒𝑟𝑔𝑦 𝑟𝑒𝑚𝑎𝑖𝑛𝑒𝑑 𝑖𝑛 𝑡ℎ𝑒 𝑛𝑜𝑑𝑒
𝐸 𝑖𝑠 𝑡ℎ𝑒 𝑚𝑎𝑥𝑖𝑚𝑢𝑚 𝑒𝑛𝑒𝑟𝑔𝑦 𝑜𝑓 𝑛𝑜𝑑𝑒
Figure.5 Network Model
The methodology formulated on the principles of the EHeed (ECODA based Heed) operates in the clustered environment to move the sensed data and ensures the minimum average expenditure of energy in each round. The exercise evaluates the performance of the transfer of data across a range two hundred seconds from the source to the preferred destination.
The Table.1 includes the parameters used insimulation.
Table.1 Simulation Parameters
Simulation parameters Value
Number of sensor nodes 250
Communication range 250m
Buffer size 50 Packets
Packet size 1000 to 5000
Transmission power 0.8w
5681
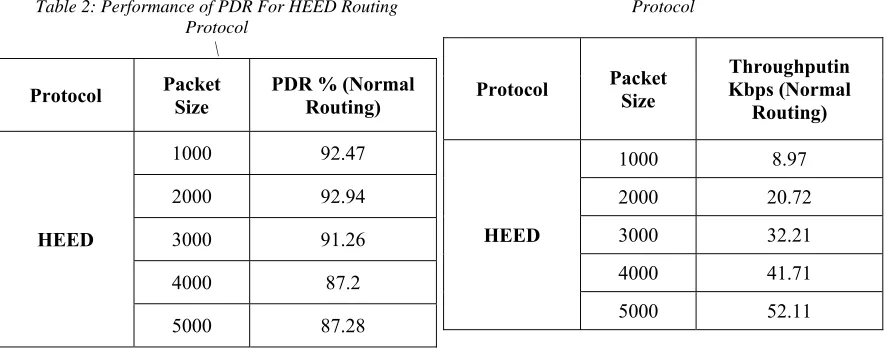
Table 2: Performance of PDR For HEED Routing Protocol
\
Protocol Packet Size PDR % (Normal Routing)
HEED
1000 92.47
2000 92.94
3000 91.26
4000 87.2
5000 87.28
The Table.2 shows the values of PDR with normal routing of data over range of 1000 to 5000 packets without congestion avoidance technique.
Table 3: Performance of Overhead For HEED Routing Protocol
Protocol Packet Size Overhead (Normal Routing)
HEED
1000 5
2000 7
3000 9
4000 11
5000 15
Table 4: Performance of Delay For HEED Routing Protocol
Protocol Packet Size (Normal Routing) Delay in Seconds
HEED
1000 7.3
2000 7.94
3000 8.5
4000 11.27
5000 13.2
Table 5: Performance of Throughput For HEED Routing Protocol
Protocol Packet Size Kbps (Normal Throughputin Routing)
HEED
1000 8.97
2000 20.72
3000 32.21
4000 41.71
5000 52.11
Table 6: Performance of Energy For HEED Routing Protocol
\
Protocol Packet Size
Energyin Joules(Normal
Routing)
HEED
1000 8.28
2000 13.91
3000 19.98
4000 24.04
5000 30.95
Similarly the Tables.3,4,5,6 display the values of overhead,delay,throughput and energy respectively and show that it increases as packet size inceases without congestion avoidance technique
The emphasis owes to avoid traffic congestion through a process of re-routing the data in alternate paths to ensure the timely delivery to the destination. It avails the theory of ECODA which involves the use of the next available route and orassigning a priority status to the current data using a buffer state threshold. The mechanism compares the five indices namely throughput, energy consumed, delay, packet delivery ratio (PDR) and overhead before and after the occurrence of congestion to bring out the benefits of EHEED .
5682 sense it allows the maximum number of transfer number of packets between the source and destination with normal routing and with the inclusion of congestion avoidance in the process of data transfer as observed from Fig. 9.
Figure.6 Overhead Vs Packet Size
Figure.7 Delay Vs Packet Size
Figure.8 Packet Loss Vs Packet Size
Figure.9 Throughput Vs Packet Size
5683
Figure.10 Energy Vs Packet Size
Figure.11 PDR Vs Packet Size
5. CONCLUSION:
A congestion avoidance strategy has been developed using ECODA to comply the transfer of data in the CRSN. The theory of cluster has been incorporated to enhance the performance and bring about resurgence in the ability of the network to address issues relating to congestion. The benefits have been realized in terms of fostering the network to balance the load in the traffic congested scenario and extract the best metrics The ECODA based HEED protocol has been found to enjoy resource usage efficiency across the network, exhibiting its suitability for use in practical networks.
ACKNOWLEDGEMENT:
The authors acknowledge with thanks the authorities of Annamalai University for providing the facilities to carry out this work.
REFERENCES:
[1] I. F. Akyildiz, W. Su, Y. Sankarasubramaniam and E. Cayirci, “Wireless Sensor Networks: A Survey”, Elsevier Computer Networks, vol. 38, no. 4, (2002).
[2] I. F. Akyildiz, W. Y. Lee, M. C. Vuran and S. Mohanty, “Next Generation/Dynamic Spectrum Access/Cognitive Radio Wireless Networks: A Survey”, Elsevier Computer Networks, vol. 50, no. 13, (2006).
[3] O. Akan, O. Karli and O. Ergul, “Cognitive Radio Sensor Networks”, IEEE Network, vol. 23, no. 4, (2009).
[4] MatteoCesana, Francesca Cuomo, EylemEkici,”Routing in Cognitive Radio Networks: challenges and solutions”, Elseveir, Adhoc Networks, pp.1-21, 2010. [5] C.T.Ee.R.Bajcsy, “Congestion control and
fairness for many to one routing in sensor networks”, ACM.Sensys, 2004, pp.148-161 [6] Ekaterina Dashkova and Andrei
Gurtov,”Survey on Congestion Control Mechanisms for Wireless Sensor Networks”, Springer, pp .75-85, 2012.
[7] M.Kafi, D.Djenouri, J.Ben-Othman, N.Badache, “Congestion control protocols in wireless sensor networks: a survey”, communication survey tutorial, IEEE 16(3) (2014)1369-1390.
[8] M.Yao, C.Lin,P.Zhang, Y.Tian,S.Xu,” TDMA Scheduling with maximum throughput and fair rate allocation in wireless sensor networks”, IEEE ICC2013-Adhoc and Sensor Networking Symposium,2013.
[9] Klein R.S., Luss H., Smith D.R. (1992) A lexicographic minimax algorithm for multiperiodResource allocation. Mathematical Programming, 55, 213–234. [10] P.Thubert,”An Architecture for IPV6 over
the TSCH mode of IEEE 802.15.4”, Technical Report, 2015.
5684 personal Indoor and Mobile Radio Communications(PIMRC)”,2012 IEEE 23rdInternationalSymposium on 2012,pp.327-332.
[12]
Palattella,N.Accettura,M.Dohler,L.Grieco, G.Boggia, “Decentralized Traffic aware scheduling for multi hop low power lossy networks in the internet of things” in IEEE 14thInternational symposium and workshops on a world of wireless ,Mobile and Multimedia Networks(WoW MoM),2013,pp.1-6.
[13]
M.Palattella,N.Accettura,Q.Wang,K.Mura oka,D.Dujovne,L.Grieco,T.Engel, “Onthe Fly bandwidth reservation for 6TiSCH wireless industrial networks, sens.J.IEEE16(2)(2016) 550-560.
[14] X.Vilajosana, Q.Wang, F.Chraim, T.Watteyne, T.Chang, K.Pister,”A Realistic energy consumption model for TSCH Networks, sens. J.IEEE 14(2) (2014) 482-489.
[15] Mohamed Amine Kafi,Jalel Ben-Othman,AbdelraoufOuadjaout,MiloudBaga a,NadjibBadache, “REFIACC: Reliable ,efficient, fair and interference aware congestion control protocol for wireless sensor networks”, Computer Communications(2016)1-11
[16] C-Y Wan,S.BEisenman,A.T Campbell, “CODA: Congestion detection and avoidance in sensor networks” in Proc.ACM SenSys,Nov.2003.
[17]
AblolfazlAfsharzadehKazerooni,HamedJel odar,JavadAramideh, “Leach and Heed clustering in wireless sensor Networks: A Qualitative Study”, Advances in Science and Technology,Vol.9,No.25,March 2015,Pages 7-11.
[18] Ahmed S.Kadhim and Haider M. Alsabbagh,”Throughput Analysis for
Cognitive Radio
Systems”InternationalJournal of Computer Networks and Communications, Vol.4, No.4, July 2012.
[19] L.Q.Tao and F.Q.Yu,”Enhanced Congestion Detection and Avoidance for multiple class of traffic in sensor networks”, IEEE Transactions on consumer Electronics, Vol.56, No.3, August 2010. [20] Vahid Esmaeelzadeh,Elahe
.S.Hosseini,RezaBerangi,OzgurB.Akan,