IJPSR (2016), Vol. 7, Issue 11 (Research Article)
Received on 02 June, 2016; received in revised form, 19 September, 2016; accepted, 03 October, 2016; published 01 November, 2016
DEVELOPMENT OF VALIDATED STABILITY INDICATING RP-HPLC METHOD FOR ESTIMATION OF IRBESARTAN IN BULK AND PHARMACEUTICAL DOSAGE FORMS
Kishanta Kumar Pradhan
Department of Pharmaceutical Sciences and Technology, Birla Institute of Technology, MESRA, Ranchi, Jharkhand, India.
ABSTRACT: A stability indicating RP-HPLC method was developed and validated for the determination of Irbesartan in bulk and dosage forms using Telmisartan (10 μg/ml) as the internal standard. An Inert ODS C-18, 5μm column having 250 x 4.6mm internal diameter in isocratic mode with mobile phase containing methanol: water (90:10) and the pH was adjusted to 3 with 1 % GAA. The flow rate was 1 ml/min and effluents were monitored at the wavelength of 246 nm. The retention time for Irbesartan was 2.3 min. The method was validated as per ICH guidelines for linearity, accuracy, precision, specificity, limit of detection, limit of quantification and robustness. Limit of detection (LOD) and limit of quantification (LOQ) were found 6.51μg/ml and 1.973μg/ml respectively and recovery of Irbesartan from bulk and dosage forms was found from 99.94% to 99.97%. As the separation of the degradants using this mobile phase is quite good, isolation of the degradants with preparative techniques can also be achieved using this mobile phase. The drug was prone to degrade more in acidic, alkaline, oxidative and thermal conditions. Further LC MS-MS analysis will help to deduce the structures of the degradants which can help to establish the possible degradation pathway of this drug. So this method can be economically very useful in both research and industrial aspect.
INTRODUCTION: Angiotensin antagonists are the first major innovation in essential hypertension management as a first-line treatment. Angiotensin II receptor antagonists have been developed to specifically and selectively block the AT1 receptor of the rennin angiotensin system by displacing angiotensin II from it. Losartan potassium, Telmisartan and Irbesartan are highly selective, non-peptide angiotensin-II receptor antagonists (ARA-II).
QUICK RESPONSE CODE
DOI:
10.13040/IJPSR.0975-8232.7(11).4531-39
Article can be accessed online on: www.ijpsr.com DOI link: http://dx.doi.org/10.13040/IJPSR.0975-8232.7 (11).4531-39
Irbesartan is a synthetic, nonpeptide antagonist of angiotensin-II with chemical name 2-butyl-3-({4-[2- (2H-1, 2, 3, 4-tetrazol-5-yl) phenyl] phenyl} methyl)-1, 3 - diazaspiro[4.4] non –1–en -4 - one. Irbesartan is used mainly for the treatment of hypertension. Irbesartan pronounced is an angiotensin II receptor antagonist1-7. IAPUC name of Irbesartan is 2butyl3({4[2(2H1, 2, 3, 4 tetrazol5yl) phenyl] phenyl} methyl) 1, 3 -diazaspironon-1-en-4-one and molecular formula C25H28N6O 8-13. Literature survey revealed that
numerous methods have been reported for estimation of Irbesartan in pharmaceutical formulations has been reported.
Present study involves development of RP-HPLC method using simple mobile phase which is sensitive and rapid for quantification of Irbesartan Keywords:
Irbesartan, RP- HPLC, ICH, Validation, Degradation
Correspondence to Author: Kishanta Kumar Pradhan
Assistant Professor
Department of Pharmaceutical Sciences & Technology, Birla Institute of Technology, MESRA, Ranchi-835215,Jharkhand, India.
in bulk and tablet dosage forms as well as subsequent validation of developed method according to ICH guide lines.
N
N
O
N
NH
N
N
FIG. 1: CHEMICAL STRUCTURE OF IRBESARTAN
MATERIALS AND METHODS:
RP-HPLC Analysis of Irbesartan by Using Telmisartan as I.S:
Chemicals: The gift samples of Irbesartan and Telmisartan (pure drug) were procured from Glenmark Pharmaceutical Company, Mumbai. The required solvents like HPLC grade methanol, water were purchased from Sigma Aldrich Pvt. Ltd. HPLC grade water was prepared using Millipore System (Millipore, Molesheim France, Model Elix-10). All other reagents were of AR grade.
Instrument: HPLC was performed on Shimadzu HPLC with LC- 20AT pumps besides SPD- 20A UV-Visible detector. Shimadzu spincrom-CFR software was used along with Phenomenex ODS C-18(250×4.6 mm, packed with 5 micron) for the separation.
Selection of Mobile phase: Irbesartan and Telmisartan were injected to the column with different with different mobile phases of different ratios with different flow rates till sharp peaks, without any interference peaks containing spectra were obtained. Different mobile phases were containing one or the combinations of two or three of the following: Methanol, Distilled water and Glacial acetic acid (all reagents were of HPLC grade).
Chromatographic Conditions: A reverse phase C-18 column was equilibrated with the mobile phase. Mobile phase flow rate was maintained at 1ml/min and eluents were monitored at 246 nm.
All determinations were performed at ambient temperature for a run time of 6 min.
Preparation of Mobile phase: Mobile phase was prepared by mixing 900 ml of methanol along with 100 ml of water to get the proportion of 90:10 v/v and finally the pH was adjusted to 3 with glacial acetic acid. The mobile phase was sonicated for 10 minutes and filtered through 0.45μ membrane filter.
Preparation of Irbesartan Stock Solution (1000 μg/ml): About 50 mg of Irbesartan was weighed accurately and was taken in a 50 ml volumetric flask. It was dissolved in the mobile phase.
Preparation of Irbesartan Working Stock Solution (100μg/ml): From the above prepared stock solution of Irbesartan 5 ml was pipette out in to a 50 ml volumetric flask and the volume was made to up to the mark with mobile phase.
Preparation of Telmisartan Stock Solution (1000 μg/ml): About 50 mg of Telmisartan was weighed accurately and was taken in a 50 ml volumetric flask. It was dissolved in the mobile phase.
Preparation of Telmisartan Working Stock Solution (100μg/ml): From the above prepared stock solution of Telmisartan 5 ml was pipette out in to a 50 ml volumetric flask and the volume was made to up to the mark with mobile phase.
Calibration Curve: From Irbesartan standard solution stock solution (100μg/ml), working solution 1 ml, 2 ml, 3ml….to 9 ml were taken in nine separate 10 ml volumetric flask and 1 ml of Telmisartan working solution (100μg/ml) was added to each volumetric flask to produce solutions of concentration range 10μg/ml to 90μg/ml of Irbesartan keeping the concentration of Telmisartan constant at 10 μg/ml. Then each prepared solution was filtered and sonicated.
Validation: Validation of the method was performed using parameters like Accuracy, Precision, Linearity and Range, Robustness, Ruggedness, LOD, LOQ, Specificity and System suitability.
degradation studies conducted on the sample using acid, alkaline, oxidative, thermal, photolytic and UV degradations. The sample was exposed to these conditions and the API peak was studied for the peak purity, which will indicate the method effectively separated from the degradation products.
Degradation in Neutral Condition: About 10 mg of pure drugs were accurately weighed and taken into three sets of three different 10 ml volumetric flasks and dissolved in minimum volume of methanol. Then the volumes were made up to the mark with water and refluxed in round bottom flasks for 1 hr, 2 hr and 6 hr. From these samples, different solutions were prepared and 20 μl of the sample solutions were injected into the HPLC system.
Degradation in Acidic Condition: About 10 mg of pure drugs were accurately weighed and taken into three sets of three different 10 ml volumetric flasks and dissolved in minimum volume of methanol. Then the volumes were made up to the mark with 0.1N, 0.5N and 01 N HCl and refluxed in round bottom flasks for 1 hr, 2 hr and 6 hr. From these samples, different solutions were prepared and 20 μl of the sample solutions were injected into the HPLC system.
Degradation in Basic Condition: About 10 mg of pure drugs were accurately weighed and taken into three sets of three different 10 ml volumetric flasks and dissolved in minimum volume of methanol. Then the volumes were made up to the mark with 0.1N, 0.5N and 01 N NaOH and refluxed in round bottom flasks for 1 hr, 2 hr and 6 hr. From these samples, different solutions were prepared and 20 μl of the sample solutions were injected into the HPLC system.
Oxidation Degradation: About 10 mg of pure drugs were accurately weighed and taken into three sets of three different 10 ml volumetric flasks and dissolved in minimum volume of methanol. Then the volumes were made up to the mark with 1 % w/v H2O2, 3 % H2O2 and 6 % w/v H2O2 and
refluxed in round bottom flasks for 1 hr, 2 hr and 6 hr. From these samples, different solutions were
prepared and 20 μl of the sample solutions were injected into the HPLC system.
Photolytic Degradation: About 100 mg of API was taken in a clean petridish and exposed to day light. Sampling was done at an interval 12 hr, 24 hr and 72 hr. From these samples, different solutions were prepared and 20 μl of the sample solutions were injected into the HPLC.
UV-Degradation: About 100 mg of API was taken in a clean petridish and subjected to UV illumination of 1.2×10⁶ lux hours. Sampling 12 hr, 24 hr and 72 hr and from these samples, different solutions were injected into the HPLC system.
Thermal Degradation: About 100 mg of API was taken in three separate clean petridishes and subjected to dry heat at 700C. Sampling was done at intervals of 10 days, 20 days and 30 days. Solutions of the pure drug were prepared and 20 μl of the samples were injected into HPLC system.
RESULTS AND DISCUSSION: The objective of
the present work was to develop and validate a stability indicating RP-HPLC method for the determination of Irbesartan in bulk and dosage forms. The method was found to be simple and the accuracy, precision, intra-day precision, inter-day precision, repeatability and assay was performed and the results was tabulated below. The retention time for Irbesartan was 2.3 min.
The method was validated for linearity, accuracy, precision, specificity, limit of detection, limit of quantification and robustness. Limit of detection and limit of quantification were found 6.51μg/ml and 1.973μg/ml respectively and recovery of Irbesartan from bulk and dosage forms was found 100.61%. With this study the degradation pattern were also studied and results are shown in the corresponding Tables and the Figures are also given.
RP-HPLC Analysis of Irbesartan Using
FIG. 2: OVERLAY CHROMATOGRAM OF IRBESARTAN USING TELMISARTAN AS I.S.
TABLE 1: CALIBRATION TABLE OF IRBESARTAN USING TELMISARTAN AS I.S.
Conc. (μg/ml) Peak Area Ratio Statistical Analysis
10 0.935
Slope= 0.084 Intercept= 0.111
SD=0.007 % RSD=0.291
20 1.753
30 2.671
40 3.504
50 4.322
60 5.139
70 6.005
80 6.798
90 7.675
FIG. 3: CALIBRATION CURVE OF IRBESARTAN USING TELMISARTAN AS I.S
Validation Parameters:
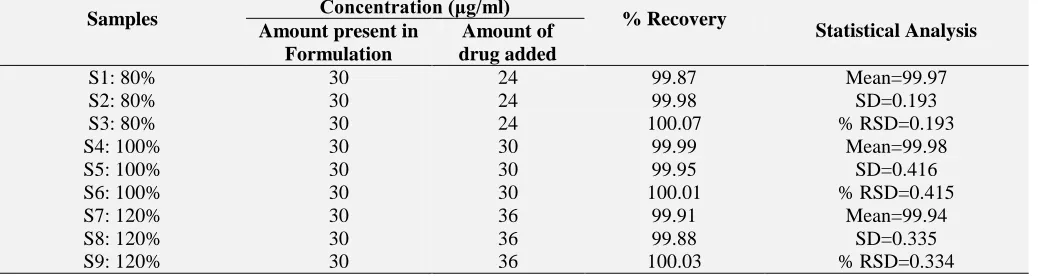
Accuracy: The accuracy of the method was determined by calculating recoveries of drug by method of standard drug. Known amounts of standard drug corresponding to 80%, 100% and 120% of the label claim was added to pre quantified sample solution and the amounts of drug were estimated by measuring the peak areas and by fitting these values to the straight line equation of calibration curve.
Precision: The intraday and inter-day precision studies of the drugs were carried out by estimating the corresponding responses on the same day and consecutive three days respectively. The results were reported in terms of standard deviation and %RSD.
Ruggedness: Ruggedness is the degree of
[image:4.612.103.489.254.571.2]TABLE 2: ACCURACY DATA OF THE METHOD FOR IRBESARTAN USING TELMISARTAN AS I.S
Samples Concentration (μg/ml) % Recovery
Statistical Analysis Amount present in
Formulation
Amount of drug added
S1: 80% 30 24 99.87 Mean=99.97
SD=0.193 % RSD=0.193
S2: 80% 30 24 99.98
S3: 80% 30 24 100.07
S4: 100% 30 30 99.99 Mean=99.98
SD=0.416 % RSD=0.415
S5: 100% 30 30 99.95
S6: 100% 30 30 100.01
S7: 120% 30 36 99.91 Mean=99.94
SD=0.335 % RSD=0.334
S8: 120% 30 36 99.88
S9: 120% 30 36 100.03
TABLE 3: PRECISION DATA SHOWING REPEATABILITY OF THE METHOD FOR IRBESARTAN USING TELMISARTAN AS I.S
Sl. no. Concentration (μg/ml) Peak Area Ratio Calc. Amt. (μg/ml) Statistical Analysis
1 30 2.637 30.07
Mean= 30.07 SD=0.115 % RSD=0.384
2 30 2.643 30.14
3 30 2.639 30.09
4 30 2.633 30.02
5 30 2.641 30.11
6 30 2.634 30.03
TABLE 4: INTRADAY PRECISION DATA OF THE METHOD FOR IRBESARTAN USING TELMISARTAN AS I.S
Sl. No. Concentration (μg/ml) Peak Area Ratio Calc. Amt. (μg/ml) Statistical Analysis
1 30 2.629 29.97
Mean=29.98 SD=0.196 % RSD=0.655
2 30 2.628 29.96
3 30 2.633 30.02
4 30 2.630 29.98
5 30 2.635 30.04
6 30 2.626 29.94
TABLE 5: INTERDAY PRECISION DATA OF THE METHOD FOR IRBESARTAN USING TELMISARTAN AS I.S
Sl. No. Concentration (μg/ml) Day 1 Day 2 Day 3 Statistical Analysis
1 30 2.619 2.628 2.637
Mean=30.05 SD=0.168 % RSD=0.560
2 30 2.627 2.631 2.645
3 30 2.634 2.639 2.644
4 30 2.630 2.643 2.645
5 30 2.625 2.638 2.648
6 30 2.632 2.642 2.651
Mean Peak Area Ratio 2.627 2.636 2.645
[image:5.612.43.568.610.748.2]Calc.Amt. (μg/ml) 29.95 30.05 30.16
TABLE 6: RUGGEDNESS DATA OF THE METHOD FOR IRBESARTAN USING TELMISARTAN AS I.S
Analyst-1 Analyst-2
Conc. (μg/ml)
Peak Area Ratio
Calc. Amt. (μg/ml)
Statistical Analysis
Conc. (μg/ml)
Peak Area Ratio
Calc. Amt. (μg/ml)
Statistical Analysis
30 2.651 30.23
Mean=30.17 SD=0.143
% RSD= 0.476
30 2.655 30.28
Mean=30.24 SD=0.181
% RSD= 0.597
30 2.644 30.15 30 2.653 30.26
30 2.647 30.19 30 2.649 30.21
30 2.642 30.13 30 2.652 30.25
30 2.642 30.13 30 2.644 30.15
TABLE 7: ROBUSTNESS DATA OF THE METHOD FOR IRBESARTAN USING TELMISARTAN AS I.S
TABLE 8: ROBUSTNESS DATA OF THE METHOD FOR IRBESARTAN USING TELMISARTAN AS I.S
Flow Rate 0.8 Flow Rate 1.2
Conc. (μg/ml)
Peak Area Ratio
Calc. Amt. (μg/ml)
Statistical Analysis
Conc. (μg/ml)
Peak Area Ratio
Calc. Amt.
(μg/ml) Statistical Analysis
30 2.618 29.84
Mean= 29.87 SD=0.108
% RSD= 0.362
30 2.620 29.86
Mean=29.96 SD=0.171 % RSD=0.573
30 2.615 29.80 30 2.617 29.83
30 2.624 29.91 30 2.629 29.97
30 2.622 29.89 30 2.633 30.02
30 2.619 29.85 30 2.634 30.03
30 2.628 29.96 30 2.637 30.07
Forced Degradation Studies of Irbesartan: Hydrolytic Degradation of Irbesartan Condition in Neutral Condition: Samples were withdrawn according to protocol. From the drawn samples 100 μg/ml solution were prepared and subjected for analysis. The representative chromatogram indicates 11.89% degradation after 6 hr. The chromatogram also reveals that the drug can be analysed in the presence of degradants. The retention time, peak area, peak height, peak width of the drug and degradants are given in tabulated form below.
FIG 4: REPRESENTATIVE CHROMATOGRAM OF HYDROLYTIC DEGRADATION OF IRBESARTAN
Hydrolytic Degradation of Irbesartan in Acidic Condition: Samples were withdrawn according to
solution were prepared and subjected for analysis. The representative chromatogram indicates 25.86% degradation after 6 hr. The chromatogram also reveals that the drug can be analysed in the presence of degradants. The retention time, peak area, peak height, peak width of the drug and degradants are given in tabulated form below.
FIG. 5: REPRESENTATIVE CHROMATOGRAM OF ACIDIC DEGRADATION OF IRBESARTAN
Hydrolytic Degradation of Irbesartan in Basic Condition: Samples were withdrawn according to protocol. From the drawn samples 100 μg/ml solution were prepared and subjected for analysis. The representative chromatogram indicates 26.96% degradation after 6 hr. The chromatogram also reveals that the drug can be analysed in the
pH 2.8 pH 3.2
Conc. (μg/ml)
Peak Area Ratio
Calc. Amt. (μg/ml)
Statistical Analysis
Conc. (μg/ml)
Peak Area Ratio
Calc. Amt.
(μg/ml) Statistical Analysis
30 2.661 30.35
Mean=30.33 SD=0.148
% RSD= 0.490
30 2.639 30.09
Mean=30.14 SD=0.136 % RSD=0.452
30 2.658 30.32 30 2.648 30.20
30 2.660 30.34 30 2.636 30.05
30 2.652 30.25 30 2.644 30.15
30 2.665 30.40 30 2.643 30.14
[image:6.612.313.566.437.612.2] [image:6.612.48.301.508.681.2]The retention time, peak area, peak height, peak width of the drug and degradants are given in tabulated form below.
FIG. 6: REPRESENTATIVE CHROMATOGRAM OF BASIC DEGRADATION OF IRBESARTAN
Oxidative Degradation of Irbesartan: Samples were withdrawn according to protocol. From the drawn samples 60 μg/ml solution were prepared and subjected for analysis. The representative chromatogram indicates 17.89% degradation after 6 hr. The chromatogram also reveals that the drug can be analysed in the presence of degradants. The retention time, peak area, peak height, peak width of the drug and degradants are given in tabulated form below.
FIG 7: REPRESENTATIVE CHROMATOGRAM OF OXIDATIVE DEGRADATION OF IRBESARTAN
Photolytic Degradation of Irbesartan: Samples were withdrawn according to protocol. From the drawn samples 100 μg/ml solution were prepared and subjected for analysis. The representative chromatogram indicates 4.88% degradation after 72 hr. The chromatogram also reveals that the drug can be analysed in the presence of degradants. The retention time, peak area, peak height, peak width
of the drug and degradants are given in tabulated form below.
FIG. 8: REPRESENTATIVE CHROMATOGRAM OF PHOTOLYTIC DEGRADATION OF IRBESARTAN
UV- Degradation of Irbesartan: Samples were withdrawn according to protocol. From the drawn samples 100 μg/ml solution were prepared and subjected for analysis. The representative chromatogram indicates 5.77% degradation after 72 hr. The chromatogram also reveals that the drug can be analysed in the presence of degradants. The retention time, peak area, peak height, peak width of the drug and degradants are given in tabulated form below.
FIG. 9: REPRESENTATIVE CHROMATOGRAM UV-DEGRADATION OF IRBESARTAN
[image:7.612.312.565.92.266.2] [image:7.612.48.301.106.273.2] [image:7.612.312.568.436.609.2] [image:7.612.48.301.449.606.2]width of the drug and degradants are given in tabulated form below.
[image:8.612.47.302.93.274.2]FIG. 10: REPRESENTATIVE CHROMATOGRAM THERMAL DEGRADATION OF IRBESARTAN
TABLE 9: OVERALL SUMMARY OF DEGRADATION STUDY
Stress Condition
Stressing
Agents Time Degradation
Neutral Water 6 Hours 11.89%
Acidic 0.1 N 6 Hours Stable
0.5 N 6 Hours Stable
1 N 6 Hours 25.86%
Basic
0.1 N 6 Hours Stable
0.5 N 6 Hours Stable
1 N 6 Hours 26.96%
Oxidation
1% H2o2 6 Hours Stable
2% H2O2 6 Hours Stable
3% H2O2 6 Hours 17.89%
Light
Sun Light
12 Hours Stable 24 Hours Stable
72 Hours 4.88%
Thermal
70°C Heat
10 Days Stable
20 Days Stable
30 Days 15.86%
UV Radiation
1.2×10⁶ Lux Hours (UV Illumination At 256 Nm)
12 Hours Stable 24 Hours Stable
72 Hours 5.77%
CONCLUSION: The developed RP-HPLC
stability indicating assay method was found suitable for the analysis of drug in their pure form in presence of their respective degradants since the resolution between the drug with their corresponding degradants was better. The drug was prone to degrade more in acidic, alkaline, oxidative and thermal conditions. The method was found to be fast, simple, reliable, sensitive, economical, accurate and precise. The sensitivity and accuracy of the method were also ascertained by using
Irbesartan suggest that the drug is stable to photolytic and UV radiation degradations. Therefore, the proposed method can be used for routine analysis of estimation of Irbesartan in its bulk and dosage formulations.
ACKNOWLEDGEMENT: The authors are
grateful to the Department of the Pharmaceutical Sciences and Technology, Birla Institute of Technology for providing the requirements and necessities for the present work.
REFERENCES:
1. Swamy GK, Kumar JMR, Rao JVLNS: A Validated Reverse Phase HPLC Method for the Simultaneous Estimation of Irbesartan and Amlodipine in Pharmaceutical Dosage Form. World Journal of Pharmacy and Pharmaceutical Sciences 2014; 3: 996-1007.
2. Ali TA, Mohamed GG, Aglan AA, Heakal FET: Rp-Hplc Stability-Indicating Method for Estimation Of Irbesartan And Hydrochlorothiazide In Bulk And Pharmaceutical Dosage Form. Chinese Journal of Analytical Chemistry 2016; 1:1601-1608.
3. Kalyankar TM, Wadher SJ, Pekamwar SS and Doiphode NG: Development and Validation of RP- HPLC Method for Estimation of Hydrochlorothiazide and Irbesartan in Pharmaceutical Preparation. International Journal of PharmTech Research 2014; 1:330-336.
4. Wani TA and Zargar S: New ultra-performance liquid chromatography-tandem mass spectrometry method for the determination of irbesartan in human plasma. Journal of Food and Drug Analysis 2015; 23:569-576. 5. Massie BM, Carson PE, McMurray JJ and Komajda M:
Irbesartan in patients with heart failure and preserved ejection fraction. The New England Journal of Medicine 2008; 23:359.
6. Tiwari HK, Monif T , Verma PRP , Reyar S , Khuroo AH and Mishra S: Quantitative estimation of irbesartan in two different matrices and its application to human and dog bioavailability studies using LCeMS/MS. Asian Journal of Pharmaceutical Sciences 2013; 8:346-355.
7. Kulkarni NS, Rathore DS, Ranpise NS, Dhole SN: Validated method for estimation of irbesartan in bulk and dosage form by high performance liquid chromatography technique. Indian Journal of Pharmaceutical and Biological Research 2015; 3:44-49. 8. Jonathan and Upfal: The Australian Drug Guide.
2006:372-832.
9. Aronson JK: Irbesartan; Angiotensin II receptor antagonists. General Information 2009:121-82.
10. Bae SK, Kim MJ, Shim EJ and Shin JG: HPLC determination of Irbesartan in human plasma: its application to pharmacokinetic studies. Biomedical Chromatography 2009; 6:568-72
[image:8.612.49.298.318.573.2]pure pharmaceutical dosage. Journal of Chemical and Pharmaceutical Research 2011; 1:100-4.
12. Ashok KS: Simultaneous determination of Irbesartan and Hydrochlorothiazide in human plasma by liquid chromatography. Journal of Chromatography B 2003; 1:195-201.
13. Ganesan M: Method development and validation of Irbesartan using LCMS/MS: Application to pharmacokinetic studies. Journal of Chemical and Pharmaceutical Research 2010; 4:740-746.
All © 2013 are reserved by International Journal of Pharmaceutical Sciences and Research. This Journal licensed under a Creative Commons Attribution-NonCommercial-ShareAlike 3.0 Unported License.
This article can be downloaded to ANDROID OS based mobile. Scan QR Code using Code/Bar Scanner from your mobile. (Scanners are available on Google Playstore)
How to cite this article: