Abstract—Signature analysis methods have been proven to deliver good results in the laboratory environment and successfully applied to isolated motors. The influence of fault signal on a non-faulty motor in a Traction Motor network may be interpreted as faulty condition of the healthy motor. Therefore, it is quite difficult to identify a motor fault within a network and precisely identify the type of fault. In this case, its Traction motors under consideration. The work done is a supervised distributed Artificial Neural Network (ANN) and is able to identify multiple faults as well as the location of fault within the motor network.
The motor performance parameters have been incorporated in training ANN. The simulation has been carried out using MATLAB 2013a. A set of significant fault features such as Synchronized Speed, Rotor Slip, the Amplitude value of each fault frequency components and the Root Mean Square (RMS) which are extracted from the current signal, based on different frequency components and associated amplitude values with each fault type. These values are used to train the ANN using Back Propagation (BP) algorithm.
The proposed technique will identify the type and location of the fault events within the motor network which can be used for detailed differentiation between the healthy motor and the faulty motor.
Index Terms—Artificial Neural Network, Distributed Traction Motor Network, Fault Identification and Localization, Feature Extraction. MATLAB/SIMULINK,
I. INTRODUCTION
A Traction Motor is an electric asynchronous induction motor utilized for drive of a vehicle, for example, an electric train or electric roadway vehicle. Traction motors are utilized as a part of electrically fuelled rail vehicles, for example, electric various units and other electric vehicles, for example, electric milk skims, lifts, transports, and trolley buses, and in addition vehicles with electrical transmission systems for example, diesel-electric, electric hybrid vehicles, and battery electric vehicles.
Amid the most recent two decades, the condition checking and fault determination of induction motors have increased great interest. In a modern situation, the power system network goes about as a channel for a motor issue signals. The impact of defective motor's sign from a non-flawed motor may demonstrate a broken state of the sound motor.
Manuscript received May, 2016.
Mahesh Aradhya M D, E&IE Department, DayanandaSagar College Of
Engineering, Bengaluru, Karanataka, India.
Dr V G Sangam, E&IE Department, DayanandaSagar College Of
Engineering, Bengaluru, Karanataka, India.
In this indeterminate circumstance, it is hard to recognize the motor flaw inside a system and decisively distinguish the sort of deficiency.
Yet, in the event that the motor's conduct is powerfully caught through predefined features, the consolidated Yet, in the event that the motor's conduct is powerfully caught through predefined features, the consolidated impact of motors on a power network system’s execution can be all the more plainly imagined.
A fault seriousness level can be useful in finding a deficiency source. Rotor related faults are the most effortless to distinguish in induction motors. This should be possible through current based signal analysis with respect to the related double slip frequency sidebands in the present range of the crucial supply frequency [2]. At the point when a rotor issue happens, changes fit as a shape, magnitude and frequencies of the waveforms are normal. These progressions can be associated with the physical phenomena causing the event. All through the occasion the disturbed waveform encounters a few non-stationary and stationary stages [3].
Numerous studies have been introduced in exploration range of fault determination utilizing isolated induction motors [4-7]. Artificial Neural Network (ANN) is accounted for similar to a learning based procedure for single motor fault determination. These studies perform the conclusions by mapping distinctive issue side effects in an isolated motor to create the diagnosis decision.
Most fault diagnosis studies based on ANN utilized induction motors have been fruitful. In any case, on account of a distributed system, this may create confusion through various comparative motor flaws in a system because of nonlinear control of the sign. This kind of unpredictability and blend of signs from numerous sources makes it hard to gauge and absolutely correspond the fault to a given machine or fault type. To beat this kind of disarray, a distributed ANN methodology is utilized as a part of this exploration to recognize the fault type and area inside the motor system on the basis of significant motor features.
This paper portrays the configuration and recreation of neural system design for fault sort diagnosis in a distributed motor system. In this exploration, fault diagnosis is conjectured as a pattern recognition and classification problem that contains the association of different patterns of input data sets, showing the conduct of the motor system in fault conditions. A significant number of features extracted, based on different frequency associated amplitude values for each fault type. Different sorts of neural system designs are tried for the preparation to alter the weights of hidden layer until the focused on yield is accomplished.
Performance Evaluation of Traction Motors
using Artificial Neural Network
II. TRACTION MOTOR NETWORK UNDER CONSIDERATION Typical power network architecture is considered in this research to exhibit the idea of fault signal propagation through the main supply line. This, in turn goes about as a decent directing environment for signals to go through the system and leave impact on other motors' behavioral signals, as per their separation. For the improvement of this contextual investigation, typical power network architecture is considered to comprise of a main power line, sub-portioned bus bars (B1, B2 and B3) and associated motors as appeared in Figure 1. Four motors (M1, M3, M6 and M9) are picked inside the system to exhibit the idea of spread of faulty signals and the impact of the fault signal. The sidebands frequency parts may show up in different motors and demonstrate the same kind of fault condition in other non-influenced motors inside same bus group and others.
As a contextual analysis, a motor from bus 1 (M3) in red is focused as faulty. Whatever remains of the motors in the system (green) are thought to be in sound condition. BRB and air gap eccentricity fault signal frequencies were infused into the current of the focused on motor. The fault signs were spread over the system through the power line. The impact of this faulty signal on different motors can degenerate the signal conduct. This then shows as a sign of a fault. In this indeterminate circumstance, it is hard to recognize the motor fault inside the system furthermore definitely associate the sort of fault to the right motor. Yet, through artificial intelligence technique, we can lessen management level instability in distinguishing the fault inside the unpredictable system that exists in decision making fault
III. FEATURE SELECTION AND EXTRACTION Choice of appropriate feature is the primary test in the determination of ANN input parameters and it might convolute the system structure. The most significant elements are picked, for example, synchronized speed of every motor, the rotor slip value, magnitude value of each fault frequency components, RMS and the crest factor value.In this exploration, Matlab was utilized to extricate distinctive element values through a related script.
The synchronized speed, RMS, crest factor and rotor slip of the motor are the information that give helpful data on the motor's working condition. Be that as it may, another two components speak to every fault signature and related spectrum. In order to calculate the influential value for each feature from each motor’s, the accompanying mathematical statements (1) to (4) are detailed as takes after
Where F represents frequency in cycles per second (Hz); P is the number of poles; nsis the synchronous speed in
revolutions per minute (RPM); nris the motor speed in RPM;
n is the total number of samples; and xi is the input matrix.
As examined before, when a deficiency happens, changes in shape, magnitude and frequency of the waveform are normal and this speaks to the seriousness of a rotor fault related with the higher estimation of amplitude of these sidebands. The frequency and amplitude estimation of left and right sideband frequency segments for every flaw can be computed by utilizing the accompanying mathematical statements (5) and (6) for BRB and air-gap eccentricity issues:
Where, f1represents the supply frequency (Hz); S is per
unit slip; R is the number of rotor slots; p is the number of poles-pairs; and k = 1, 3, 5, . . . represents the harmonics.
The fundamental motivation to pick speed and slip as components in this study is that both element qualities are important to compute the focused on fault sorting and their conditions. The velocity and rotor slip qualities are connected with alternate parameters of motor issues. The RMS and crest factor will contrast the qualities relating with the obscure faults in the event that it exists.
Speed= 1= Srpm=
(1)
Slip= 2= S= X100% (2)
RMS= 3= rms=
(3)
Crest Factor
=
4=(4)
BRB = 5 = fbrb = f1(1±2S) Hz (5)
Air-gap eccentricity= 6 = fsec = f1 (6)
IV. PROPOSED ANN METHODOLOGY AND ARCHITECTURE Alluding to mathematical statements (1) to (6); the proposed system comprises of six inputs information values (x1, x2,… , x6 ) and all inputs comprise of dynamic feature values in different motors. Every system has one hidden layer that comprises of most extreme 15 neurons. The quantity of nodes in the hidden layer affects the execution of ANN. On the off chance that the quantity of nodes is little, the system may not be train satisfactorily. Then again, if the quantity of neurons is too vast, the system will take quite a while to prepare. In this way, the determination of measurement and number of hidden layers relies on upon NN exactness in starting tests. The sigmoid initiation function tansigis utilized for training as a part of hidden layer. The output layer gives the state of the motor. It comprises of four neuron nodes and the initiation function logsig is utilized for every output. For the target output, a vector of classes is defined as takes after:
• [1;0;0;0]: For healthy condition • [0;1;0;0]: For BRB fault
• [0;0;1;0]: For Air-Gap eccentricity fault • [0;0;0;1]: For Unknown fault
A multi-layer FFNN was used in this research for type identification and localization of faults within a network. For the development of this case study, single motor feature vectors were initially trained through a proposed network to observe their performance. The proposed architecture of ANN for a single motor is presented in Fig 2.
On the premise of the same training mechanism, we utilized the same ANN arrangement network design for different motors. Every motor component's vector class was utilized as a part of the information and arranged through the same network architecture. Once the network learnign process began, the neural network balanced the weights and threshold levels consequently over all the layers, to diminish the Mean Square Error (MSE) between the targeted and real output. For this, the Levenberg Marquardt algorithm function trainlmperformed quick preparing, with intrinsic regularization properties [7]. The misclassification and data error rate were ascertained through the Sum of Square Error (SSE).
Thusly, the SSE was utilized to prepare every network utilizing mathematical statement (7) until the SSE objective was met.
SSE = (7)
Where, N represents the number of training Data; E is the output layer units; Xlmis the actual output; and dlmis the predicted output.
To diminish the level of instability inside the network, the simulated model will take a final choice about a motor issue, not only the premise of a single feature’s abnormal characteristic. It likewise compares the other component values and the targeted qualities. In the event that the other feature values indicate much contrast from the targeted values, motor can be considered as a broken otherwise solid or an obscure fault. With a specific end goal to compute the components from every motor, distinctive guidelines have been characterized to generate the training data patterns for each objective vector class. For instance, in the event of elements x5 and x6, if there is a threshold value variation between the real and targeted on sideband amplitude values, the system will accept the presence of a BRB or air gap eccentricity faults attributes. Be that as it may, to choose the sorting of faults, the system will contrast alternate features also with targeted class.
Along these lines, if other feature values vary more than the characterized set principles, the motor might be viewed as flawed. Something else, the system will suspect these progressions to be signal faults engendered through the principle power line from other motor's and affecting the targeted motor. The following step is to choose the kind of fault. Here, features x5and x6sideband frequency components
will compare a defined set range to decide the type of fault, as shown in Table I. On the other hand, if the features x1, x2,
x3and x4values are different from the targeted values and x5,
x6present their values as healthy the system will assume this
variation is an unknown fault.
V. SIMULATION RESULTS
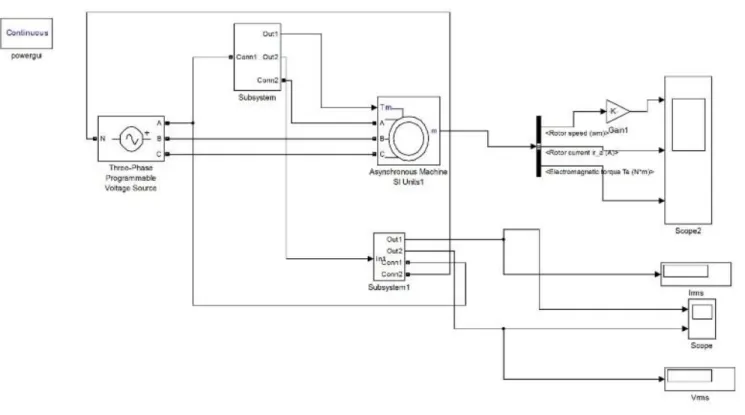
Matlab and Simulink were utilized for the advancement of the proposed ANN model to analyze fault types and the area of defective motors inside motor system. A three phase induction motor model, in dynamic parameters, was simulated in Simulink and further extended out into a motor system. The objective flaws were misleadingly made through changing the parameters in a created motor model and BRB and eccentricity faults related frequencies were injected into current spectrum, as appeared in Fig 3. All feature values were put away in a Mat document and assigned these values with the motor. The Matlab scripts was utilized to produce the whole arrangement of training data for the validation and testing process in both fault and non-fault cases.
Table I: Learning Data Set for Training Process
Features No.
Healthy target feature set range
MOTORS M1 M2 M3 M4 M5 M6 M7 M8 M9 x1 1440-1460 1445 1455 1530 1440 1460 1465 1445 1445 1460 x2 0.050-0.06 0.052 0.055 0.090 0.055 0.055 0.055 0.055 0.055 0.055 x3 0.2493-0.2500 0.2470 0.2470 0.2710 0.2470 0.2470 0.2470 0.2470 0.2470 0.2470 x4 0.2115-0.2200 0.2105 0.2004 0.2004 0.2004 0.2004 0.2004 0.2004 0.2004 0.2004 x5 46-49,50,51-54 45,50,55 48,50,52 41,50,59 47,50,53 47,50,53 44,50,56 47,50,53 47,50,53 43,50,57 x6 1-5,50,95-100 4,50,96 3,50,97 9,50,91 3,50,97 2,50,98 4,50,96 3,50,97 0,50,100 0,50,100 Motor Condition [0;0;0;1] [0;0;0;1] [0;1;1;0] [1;0;0;0] [1;0;0;0] [0;0;0;1] [1;0;0;0] [1;0;0;0] [0;0;0;1]
The significant feature input was removed utilizing the Matlab scripts to create the whole training of data from every motor, as appeared in Table I. Various extents were characterized, connected with every feature. On the premise of feature values, motor condition could easily be observed. Against every feature data input, we set a healthy target highlight range in Table I for the distinguishing proof of motor wellbeing. On the off chance that the feature value exists inside the range then the feature considers as a healthy otherwise broken. For instance, if the motor elements speed, slip, RMS and crest factor values exist in the predetermined extent limits we can consider the element esteem as solid.
As we can reason from Table I, Motor 3 is influenced by both targeted faults, since all fault values come into the characterized range of rules. Because of the spread of a fault signal through the electrical cable, all different motors demonstrated the impact of fault frequency and show some flaw condition. Motor 1 and 2 are most influenced motors, because of being on the same sub-bus. Be that as it may, as a result of the separation between motors, it doesn't demonstrate a solid worth for both faults. In this circumstance the system considered these progressions an unknown fault.
Through the proposed distributed ANN procedure, the system can undoubtedly investigate the state of every motor inside system and recognize the fault through any change in behavioral qualities.
The choice on the quantity of nodes in a hidden layer is a complicated step in NN. Keeping in mind the end goal to compute the execution effect of the neural network structure on every motor fault information classification, various models were tried for the hidden layer plan by changing the quantity of neuron nodes. The Levenberg Marquardt algorithm was actualized utilizing a Matlab script, to perform the learning stage. For this reason, classification performance is characterized by the pre-decided proportion between the total number of arranged tested samples. The training proportion was set at 80-90 percent with 500 epochs. To check the legitimacy of information, 30 diverse cross-validation checks were applied. The underlying estimations of offsets and weights were randomly assigned. The weights of the hidden layer were over and again balanced amid the training stage, until calculated outputs came to the targeted output performance.
Fig4: Performance Graphs of identified motors 1,3,6& 9 using [6x10x4] neural network architecture
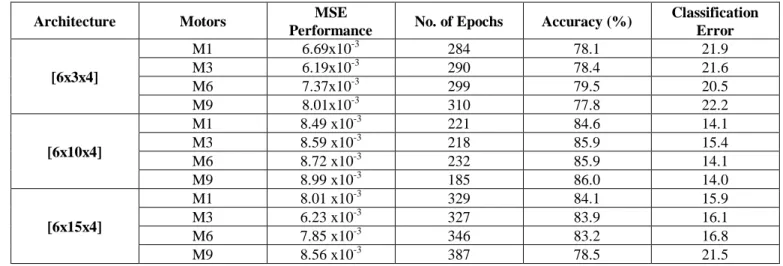
Table II shows the execution of various designs [6x3x4], [6x10x4], [6x15x4] separately. It can be seen that design [6x10x4] (6 neurons in the input layer, 10 neurons in the hidden layer and 4 neurons in the output layer) has the best MSE execution among different structures. The least epochs are likewise utilized amid the training period to accomplish the required precision, which demonstrates the best execution in the targeted architecture, alongside the littlest mistake rate. Figure 4 demonstrates the training performance graph of the neural system [6x10x4], which achieved the best consequence of the other NN structures.
In the wake of measuring the performance of every motor, the second method for testing the performance of the neural network is to quantify the classification confusion matrices for the different sorts of error that happen amid the training procedure. To acquire the confusion matrix, information is fed into the neural network model. Fundamentally, confusion matrix holds the data about the comparison amongst targeted and predicted classification classes [11]. Fig 5 exhibits the confusion matrices for the three procedure periods of training, testing and validation of each focused on Motors 1, 3, 6, and 9 individually. A sum of four targeted and anticipated classes (even and vertical) were characterized to look at every motor feature data set. On account of effective classification of a targeted class trial, the diagonal cells are appeared in green. Every corner to corner cell shows the quantity of cases that have been ordered effectively by the neural network, to distinguish feature condition, whether healthy or defective for every motor. The non-corner to corner cells in red demonstrate the quantity of cases that have been wrongly characterized by the ANN, was not distinguished the state of the features. The last cell, in blue, in every network shows the total percentage of cases that were grouped, accurately in green and the other way around in red.
In case of M1, the above outline demonstrates every class has most extreme 1200 testing trials. Classes 1 to 4 displays the motor in healthy condition, a BRB issue, air-gap eccentricity and an unknown fault separately. Perusing vertically course, there are 419 trials effectively delegated class 1, and no of the trial is wrongly classified. Complete 308 trails are wrongly classified as class 2 and 45 trials were wrongly classified in class 3. In class 4, a total of 228 trials are wrongly classified due the complexity and mixing of features. At the point when the confusion matrix is perused horizontally, 39 trials of class 3 and 9 trial of class 4 are wrongly classified. The last column (vertical and horizontal) introduces the successful classification rate of each class. The total of 3952 testing trials has been classified and the final performance success rate is 85.9 percent. Just 14.1 percent error rate occurred, that is entirely sensible rate in distributed motor network. The same procedure will be connected for the other focused on motors confusion matrices.
Table II: Best Architecture Performances for Classification
Architecture Motors MSE
Performance No. of Epochs Accuracy (%)
Classification Error [6x3x4] M1 6.69x10⁻³ 284 78.1 21.9 M3 6.19x10⁻³ 290 78.4 21.6 M6 7.37x10⁻³ 299 79.5 20.5 M9 8.01x10⁻³ 310 77.8 22.2 [6x10x4] M1 8.49 x10⁻³ 221 84.6 14.1 M3 8.59 x10⁻³ 218 85.9 15.4 M6 8.72 x10⁻³ 232 85.9 14.1 M9 8.99 x10⁻³ 185 86.0 14.0 [6x15x4] M1 8.01 x10⁻³ 329 84.1 15.9 M3 6.23 x10⁻³ 327 83.9 16.1 M6 7.85 x10⁻³ 346 83.2 16.8 M9 8.56 x10⁻³ 387 78.5 21.5
It can be seen that through the chosen neural network architecture [6x10x4], a satisfactory accuracy has been accomplished in fault detection in the feature vector, extending from 82 to 87 percent. This mirrors the execution productivity of the distributed ANN algorithm, in reducing the level of vulnerability management in decision making. To think about the confusion matrix performance of the proposed methodology and architecture, some work required on motor faults. In any case, a comparable work, yet on a single motor was done by the Hamdani [11]. They accomplished 92.11 percent classification accuracy in effectively testing the trial cases in case of isolated motors. Be that as it may, the proposed model accomplished the 86.6% classification accuracy rate, due the presence of complexity and mixing of various signals in distributed motor network power system. This rate mirrors the productive execution of the proposed ANN architecture, and decreasing the level of vulnerability management in decision making.
VI. CONCLUSION
The appropriateness of multilayer ANN architecture for the recognizable proof of motor faults inside a traction motor system is exhibited in this paper. Asupervised distributed ANN learning technique was utilized to distinguish fault types (for example, BRB or air gap eccentricity) inside the mechanical motor network. Noteworthy motor fault features, (for example, synchronizing speed, rotor slip, amplitude value of each fault frequency components, RMS and the crest factor) were utilized to prepare the ANN through the back propagation algorithm. The relationship of features with the faults is additionally talked about. To enhance the MSE accuracy rate, different sorts of neural network designs are tried for the training to change the weights of the hidden layer until targeted output is accomplished.
The proposed model accomplished the 86.6%
classification accuracy rate, due the presence of complexity and mixing of various signals in distributed motor network power system.The simulated results demonstrate that precise review and speculation practices are gotten amid the various faults process in circulated motor system. The proposed architecture and methodology admirably with the selected feature data set. The outcomes demonstrate that exactness in fault recognition in feature vector has been accomplished through simulated model and classification performance is attractive amongst healthy and defective condition including fault type. Moreover, from Table II, it is observed that the [6x10x4] architecture gives better results compared to the other architectures with its accuracy percentage being around 84.6-86%. And also it is observed that expanding the quantity of neuron nodes in hidden layer is not important to enhance the classification performance altogether but rather the training set ought to have higher number of training data sets with numerous fault cases to improve the classification performance of network.
REFERENCES
[1] Sri Kolla, Logan Varatharasa, Identifying threephase induction motor faults using artificial neural networks, ISA Transactions, vol 39, Issue 4, September 2000, pp. 433-439. [2] A. Zhongming and Y. B. Wu, “Online detection of broken rotor bars in induction motors by wavelet packet decomposition and artificial neural networks”, IEEE Transactions on Instrumentation and Measurement, Vol. 58, No. 7, July 2009, pp 2253- 2263.
[3] Khomfoi, S.; Tolbert, L.M., "Fault Diagnostic System for a Multilevel Inverter Using a Neural Network", IEEE Transactions on Power Electronics, vol.22, no.3, May 2007, pp.1062-1069.
[4] H. Su and K. T. Chong, “ Induction machine condition monitoring using neural network modelling”, IEEE Transactions on Industrial Electronics, vol. 54, No. 1, Feb. 2007, pp 241- 249.
[5] Refaat, S.S.; Abu-Rub, H.; Saad, M.S.; Aboul-Zahab, E.M.; Iqbal, A., "ANN-based for detection, diagnosis the bearing fault for three phase induction motors using current signal," 2013 IEEE International Conference on Industrial Technology (ICIT), vol., no., Feb. 2013, pp.253-258. [6] Boukra, T.; Lebaroud, A.; Clerc, G., "Neural- Network approaches for classification of induction machine faults using optimal time-frequency representations," 2011 10th International Conference on Environment and Electrical Engineering (EEEIC), vol. 1,4, May 2011, pp. 8- 11. [7] Nyanteh, Y.; Edrington, C.; Srivastava, S.; Cartes, D., "Application of Artificial Intelligence to Real- Time Fault Detection in Permanent-Magnet Synchronous Machines," IEEE Transactions on Industry Applications, vol.49, no.3, 2013, pp.1205- 1214.
[8] Tag Eldin, E.M.; Emara, H.R.; Aboul-Zahab, E.M.; Refaat, S.S., "Monitoring and Diagnosis of External Faults in Three Phase Induction Motors Using Artificial Neural Network," IEEE Power Engineering Society General Meeting, June 2007, pp. 24-28.
[9] Arabaci, H.; Bilgin, O., "Diagnosis of broken rotor bar faults by using frequency spectrum of stator current envelope," 2012 20th International Conference on Electrical Machines (ICEM), Sep 2- 5, 2012, pp.1643-1646.
[10] Drira, A.; Derbel, N., "Classification of rotor fault in induction machine using Artificial Neural Networks", 2011 8th International Multi- Conference on Systems, Signals and Devices (SSD), March 2011, pp. 22-25.
[11] Hamdani, S.; Touhami, O.; Ibtiouen, R.; Fadel, M., "Neural network technique for induction motor rotor faults classification-dynamic eccentricity and broken bar faults", 2011 IEEE International Symposium on Diagnostics for Electric Machines, Power Electronics & Drives (SDEMPED), 5-8 Sept. 2011, pp.626,631,
[12] Rad, M.K.; Torabizadeh, M.; Noshadi, A., "Artificial Neural Network-based fault diagnostics of an electric motor using vibration monitoring," 2011 International Conference on Transportation, Mechanical, and Electrical Engineering (TMEE), 16-18 Dec. 2011, pp.1512 1516.
AUTHOR BIOGRAPHY
Mahesh Aradhya M D1, M.Tech scholar of Microelectronics and Control
Systems in E&IE Department, DayanandaSagar College Of Engineering, Bengaluru, Karanataka and completed his Bachelor’s degree in Electrical and Electronics in the year 2014, from PESITM, Shimoga, Karnataka.
Dr. V.G.Sangam2, Having 25 years of experience in research and academics, Research specialization is in sensors, published 15 papers in referred journal, received best publication International award from IEEE Honkong and SICE-Japan, Presently working as Professor and Head of Electronics and Instrumentation Engineering department of DayanandaSagar Engineering college, Bangalore.
![Table II shows the execution of various designs [6x3x4], [6x10x4], [6x15x4] separately](https://thumb-us.123doks.com/thumbv2/123dok_us/8216417.2178432/5.893.91.424.89.1069/table-ii-shows-execution-various-designs-x-separately.webp)