Subloop Deformation Behavior of TiNi Shape Memory Alloy
Subjected to Stress-Controlled Loadings
Elzbieta A. Pieczyska
1, Hisaaki Tobushi
2;*1, Wojciech K. Nowacki
1,
Stefan P. Gadaj
1and Toshimi Sakuragi
2;*21Institute of Fundamental Technological Research, Polish Academy of Sciences, Swietokrzyska 21, Warsaw, 00-049, Poland 2Department of Mechanical Engineering, Aichi Institute of Technology, Toyota 470-0392, Japan
The main characteristics which appear in shape memory alloys (SMAs) are the shape memory effect and superelasticity. In applications of SMAs, the thermomechanical properties of SMAs are most important. The return-point memory does not appear under the stress-controlled conditions. Creep and stress relaxation can be induced due to the phase transformation in the subloop loading under the stress-controlled conditions. In order to design the SMA elements properly, it is important to understand the influence of the thermomechanical loading conditions on the nucleation and progress of the phase transformation and the corresponding deformation behaviors. In the present paper, the conditions for the nucleation and progress of the phase transformation are investigated for SMAs subjected to the subloop loadings under the stress-controlled conditions. The uniaxial tension tests for the TiNi SMAs were carried out in the superelastic region under the various thermomechanical loading conditions. The thermomechanical conditions for the progress of the phase transformation are discussed in the subloop loading under the stress-controlled conditions. Strain increases during unloading and decreases during reloading under the stress-stress-controlled subloop loading. These pseudoviscoelastic behaviors are important for the precise control of SMA elements. [doi:10.2320/matertrans.MRA2007097]
(Received May 1, 2007; Accepted July 13, 2007; Published September 25, 2007)
Keywords: shape-memory alloy, titanium-nickel alloy, subloop, superelasticity, creep, stress relaxation, neutral loading
1. Introduction
The main characteristics which appear in shape memory alloys (SMAs) are the shape memory effect (SME) and superelasticity (SE).1–4)Large recovery strain, high recovery stress, large energy storage and high damping can be obtained due to these properties by SMAs. SMAs have such excellent properties and therefore their developments and applications are expected as the smart materials and structures. In applications of SMAs, the thermomechanical properties of SMAs are most important since the driving force and the working stroke vary depending on the variation in temperature and they must be controlled precisely. If temperature varies above and below the transformation finish temperatures, the thermomechanical condition is called the perfect loop or full loop, and the expected driving force and working stroke can be obtained. However, if temperature varies between the transformation start and finish temper-atures (this case is called the subloop or internal loop), the expected values of the driving force and the working stroke can not be obtained. This point is very important from the viewpoint of the precise control of SMA elements. The investigations on the deformation properties performed till now are mainly for the full loop loading under the strain-controlled conditions.5,6)In the case of the subloop loading
under a low strain rate, the reloading curve of the stress-strain curve passes through the point where unloading started.7)
This property is called as the return-point memory. The return-point memory does not appear under the stress-controlled conditions.8,9) In applications of SMAs, SMA
elements are subjected to various thermomechanical load-ings. In order to design the SMA elements properly, it is important to understand the influence of the
thermomechan-ical loading conditions on the progress of the phase trans-formation and the corresponding detrans-formation behaviors.
In the present paper, the conditions for the nucleation and progress of the phase transformation are investigated in SMAs subjected to the subloop loading under the stress-controlled conditions. The uniaxial tension tests for TiNi SMAs were carried out in the region of SE under the various thermomechanical loading conditions. The conditions for the progress of the phase transformation and the neutral loading are discussed. Strain increases during unloading and de-creases during reloading under the stress-controlled subloop loading. These pseudoviscoelastic behaviors are important for the precise control of SMA elements in applications.
2. Experimental Method
2.1 Materials and specimen
The materials used in the experiment were a rectilinear Ti-55.4 mass%Ni SMA wire and a flat Ti-55.3 mass%Ni SMA tape which were polycrystalline and produced by Furukawa Electric Co. Diameter of the wire was 0.75 mm, and width and thickness of the tape were 10 mm and 0.4 mm, respectively. The reverse transformation finish temperatures
Af were 323 K for the wire and 283 K for the tape,
respectively. The displacement was measured by the extens-ometers with the gauge length 20 mm and 100 mm for the wire and the tape, respectively. The average temperature of the tape was measured over an area of860mm, located in the central part of the specimen by the infrared camera.
2.2 Experimental procedure
In order to investigate the deformation properties of the material under the various loading conditions, the following six kinds of thermomechanical tension tests were carried out in air. In the tests except for Exps. V and VI, the ambient temperature was kept constant atT ¼353K. In the Exps. V *1Corresponding author, E-mail: [email protected]
*2Graduate Student, Aichi Institute of Technology
and VI, the ambient temperature was room temperature and was not controlled. Stress and strain were treated in terms of nominal stress and nominal strain, respectively. Therefore the stress-controlled and strain-controlled conditions mean the load-controlled and displacement-controlled conditions, re-spectively.
Exp. I: Subloop deformation under low strain rate In the transformation region during loading and unloading, strain was controlled to decrease or increase repeatedly under low strain rate for the wire.
Exp. II: Subloop deformation under various stress rates In the transformation region during loading and unloading, stress was controlled to decrease or increase repeatedly under various stress rates for the wire.
Exp. III: Subloop loading with constant stress
In the transformation region during loading and unloading under constant stress rate, stress was kept constant and variation in strain was observed for the wire.
Exp. IV: Subloop loading with constant strain
In the transformation region during loading and unloading under constant stress rate, strain was kept constant and variation in stress was observed for the wire.
Exp. V: Deformation and temperature variation under various strain rates
Stress-strain relationship and variation in temper-ature were observed under various strain rates for the tape.
Exp. VI: Neutral loading
In the transformation region during loading, sub-loop deformation and variation in temperature were observed under the special stress rate for the tape in order to confirm the neutral loading condition.
3. Subloop Deformation under Various Loading Rates
3.1 Subloop deformation under low strain rates
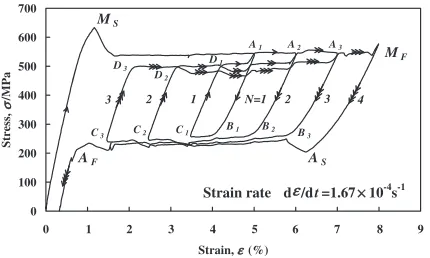
The stress-strain curves obtained by the subloop loading test under a low modulus of the strain rate d"=dt¼
1:67104s1 (Exp. I) are shown in Fig. 1. In the test, the process (Ai, Biand Ci) corresponds to unloading and the
process (Ci, Di and Aiþ1) corresponds to reloading. The
process (Ai, Bi) and the process (Ci, Di) are elastic. The
reverse transformation appears in the process (Bi, Ci) and the
MT appears in the process (Di, Aiþ1). The MT stress
decreases under cyclic deformation.10) Therefore, the MT
stress plateau during the reloading process (Di, Aiþ1)
decreases with increase in the number of cycles N. The reloading curve (Ci, Di and Aiþ1) passes through the
unloading start point Ai. Therefore, the return-point memory
is observed in the case of the strain-controlled condition with a low strain rate.
3.2 Subloop deformation under various stress rates 3.2.1 Full loop deformation under various stress rates
The stress-strain curves obtained by the full loop loading under various stress rates for the SMA wire atT¼353K are shown in Fig. 2. The stress-strain curve obtained under a strain rate of 1:67104s1 is also shown in Fig. 2. This
strain rate is low enough corresponding to the isothermal loading condition.11) In the case of a low strain rate, the
overshoot appears at the starting point of the MT in the loading process followed by the upper stress plateau due to the MT. The undershoot appears at the starting point of the reverse transformation in the unloading process followed by the lower stress plateau due to the reverse transformation. In the case of the constant stress rates, the overshoot and undershoot do not appear and both slops of the stress-strain curves are steep in the stress-plateau regions due to the phase transformation during loading and unloading. The higher the stress rate is, the steeper the slope of the stress-strain curve is. In the case of a low strain rate, the phase-transformation band due to propagation of the interface between the M-phase and the parent phase progresses like Luder’s band in the stress-plateau region and temperature varies slightly.6,12)In the case
of the constant stress rate, many phase-transformation bands appear in the whole area of the specimen and temperature varies markedly,12,13)resulting in the steep slope of the
stress-strain curve since the MT stress varies in proportion to temperature.
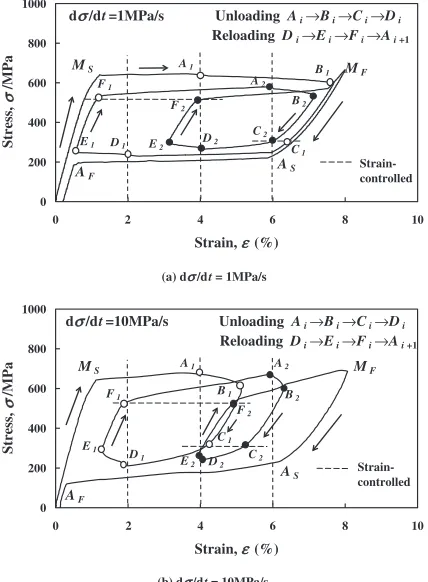
3.2.2 Subloop deformation under various stress rates
The stress-strain curves obtained by the subloop loading test under the constant stress rate for the SMA wire at
T ¼353K are shown in Fig. 3. The MT occurs in the loading processðSM;A1Þ. The subloop unloading process corresponds
to the path (Ai, Bi,Ci andDi). The reverse transformation
0 100 200 300 400 500 600 700
0 9
Strain, εε (%)
Stress,
σσ
/MPa
MS
MF
AF AS
Strain rate dε/dt=1.67×10-4s-1 A1 A2 A3
B3
B2
B1
C1
C2
C3
D2
D3
N=1 1
2
3 2 4
D1
8 7 6 5 4 3 2 1
3
Fig. 1 Stress-strain curves for subloop loading under constant strain rate.
0 100 200 300 400 500 600 700 800 900
0 8
Strain, ε (%)
Stress,
σσ
/MPa
d ε/dt = 1.67×10⁻⁴s-1
d σ/dt = 1 MPa/s 10 MPa/s 30 MPa/s
d σ/dt = 1 MPa/s 10 MPa/s 30 MPa/s
10 6
4 2
[image:2.595.63.278.73.202.2] [image:2.595.320.535.75.201.2]occurs in the unloading process ðCi;DiÞ. The subloop
reloading process corresponds to the path (Di, Ei, Fi and
Aiþ1). Strain increases in the early stage of unloadingðAi;BiÞ
and decreases in the early stage of reloading ðDi;EiÞ. The
variation in strain is larger under a lower stress rate in both stages. These strain behaviors appear due to the following reasons. In the case of unloading ðAi;BiÞ, temperature
increases due to the MT in both the loading process ðSM;A1Þ and the reloading process ðFi;Aiþ1Þ, but decreases
during unloading ðAi;BiÞ. The decrease in both stress and
temperature during ðAi;BiÞ satisfies the condition of the
progress for the MT, and therefore strain increases due to the MT in this stage. In the case of reloadingðDi;EiÞ, temperature
decreases due to the reverse transformation in the unloading processðCi;DiÞand increases during reloadingðDi;EiÞ. The
increase in both stress and temperature during ðDi;EiÞ
satisfies the condition of the progress for the reverse transformation, and therefore strain decreases due to the reverse transformation in this stage. In the case of lower stress rate, the time to satisfy the condition of the progress for both transformations is longer, resulting in larger variation in strain. These strain behaviors in the subloop loading under the constant stress rate are quite different from those under a low strain rate as observed in Fig. 1. In the reloading process under a low strain rate, the stress-strain curve passes through the unloading start pointAias shown in Fig. 1, showing the
return-point memory. However, as can be seen in Fig. 3, the reloading stress-strain curve does not pass through the unloading start pointAi. Therefore, the return-point memory
does not appear under the stress-controlled condition.
3.2.3 Transformation-induced creep and creep recovery under constant stress
The stress-strain curve obtained by the subloop loading test with constant stress for the SMA wire atT ¼353K is shown in Fig. 4. In Fig. 4, the stress-strain curve obtained by the full loop loading under a constant stress rate of 1 MPa/s is also shown by a thin curve. The modulus of the stress rate was 1 MPa/s in the loading processðO;AÞand the unloading process ðB;CÞ. The stress was kept constant during the processesðA;BÞandðC;DÞ. The condition of constant stress corresponds to a very low stress rate and the stress-strain curve is close to that of the full loop loading under the constant stress rate of 1 MPa/s.
The MT occurs in the loading process ðSM;AÞ and
temperature increases due to the MT. In the processðA;BÞ, stress is held constant and temperature decreases under constant stress. Then the condition of the progress for the MT is satisfied and an increase in strain is induced due to the MT under constant stress. Therefore, the transformation-induced creep deformation appears. The reverse transformation occurs in the unloading process ðSA;CÞ and temperature
decreases. In the processðC;DÞ, stress is held constant and temperature increases under constant stress. Then the con-dition of the progress for the reverse transformation is satisfied and a decrease in strain is induced due to the reverse transformation under constant stress. Therefore, the trans-formation-induced creep recovery appears. Therefore, it is important to note that, even if the ambient temperature is constant in applications of SMAs, creep and creep recovery must appear in the stress-controlled subloop loading since the temperature of the material varies according to the phase transformation.
3.2.4 Transformation-induced stress relaxation and stress recovery under constant strain
The stress-strain curve obtained by the subloop loading test with constant strain for the SMA wire atT ¼353K is shown in Fig. 5. In Fig. 5, the stress-strain curve obtained by the full loop loading under a constant strain rate of
1:67104s1is also shown by a thin curve. In the loading
and unloading processes, the modulus of the stress rate was 30 MPa/s. The strain was kept constant during the loading processðAi;BiÞand during the unloading processðCi;DiÞ. As
can be seen, the stress decreases under constant strain during ðAi;BiÞand increases duringðCi;DiÞ.
(a) dσσ/dt = 1MPa/s 0
200 400 600 800 1000
0 4 8 10
Strain, ε (%)
Stress,
σ
/MPa
A1 M
F
MS
AS
AF
A2 B1
B2
D2 C2
C1 F1
F2
E2 D1 E1
dσ/dt=1MPa/s Unloading Ai→Bi→Ci→Di
Reloading Di→Ei→Fi→Ai+1
Strain-controlled
2 6
(b) dσ/dt = 10MPa/s 0
200 400 600 800 1000
0 4 8 10
Strain, ε (%)
Stress,
σ
/MPa
dσ/dt=10MPa/s Unloading Ai→Bi→Ci→Di
Reloading Di→Ei→Fi→Ai+1 MF
MS
AS
AF
A1 A2
B1 B2
D2 C2 C1 F1
D1 E1
E2 F2
Strain-controlled
2 6
Fig. 3 Stress-strain curves for subloop loading under constant stress rates (a)d=dt¼1MPa/s, (b)d=dt¼10MPa/s.
0 200 400 600 800 1000
0 4 6 8 10
Strain, ε (%)
Stress,
σ
/MPa
SM FM
Constant stress at A→B and C→D Full loop : dσ/dt= 1MPa/s
FA SA
A
C
B
D
2
Fig. 4 Stress-strain curve for subloop loading with constant stress:ðA;BÞ
[image:3.595.63.277.75.366.2] [image:3.595.319.535.75.199.2]The MT occurs in the loading process ðSM;A1Þ. In the
process ðAi;BiÞ, stress decreases under the constant strain,
and the transformation-induced stress relaxation appears. The reverse transformation occurs in the unloading process ðSA;C1Þ. In the process ðCi;DiÞ, stress increases under the
constant strain, and the transformation-induced stress recov-ery appears during this process. The variation in temperature of the material depends on the size of the SMA elements and the conditions of heat transfer between the SMA elements and atmosphere. Therefore, it is important to note that, even if the ambient temperature is constant in applications of SMAs, stress relaxation and stress recovery must appear in the stress-controlled subloop loading since the temperature of the material varies according to the phase transforma-tion.14,15)
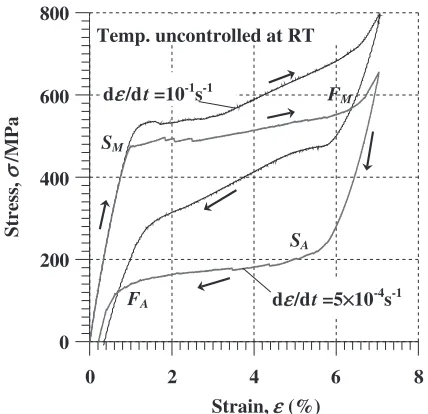
3.3 Deformation and temperature variation under var-ious strain rates
The stress-strain curves and variation in temperature under various strain rates are shown in Figs. 6 and 7. In Fig. 7,T
denotes the average temperature variation on the surface of SMA tape, andTpdenotes the temperature variation at the
point where the first transformation band with high
temper-ature11,12)like Luder’s band appeared. The temperature rise
due to the MT is larger under higher strain rate.11,12)The MT
stress increases in proportion to temperature. Therefore, the MT stress increases in proportion to strain rate as observed in Fig. 6. As can be seen in Fig. 7, temperature increases by 29 K due to the MT at strain rate of102s1.
4. Conditions for Progress of Phase Transformation and Subloop-Deformation Behavior
In order to understand the reason why the pseudoviscoe-lastic behaviors of creep, stress relaxation, an increases in strain during unloading and an increases in strain during reloading appear under the stress-controlled condition, let us discuss the conditions for progress of the phase transforma-tion and the corresponding subloop-deformatransforma-tion behavior.
4.1 Conditions for progress of phase transformation in the subloop loading
The transformation kinetics for the martensitic trans-formation (MT) in SMAs proposed by Tanaka et al. is expressed as follows16,17)
_ zz
1z¼bMCM _ T
TbM_0 ð1Þ
and for the reverse transformation
zz_
z¼bACA _ T
TbA_0 ð2Þ
where , T andz represent the stress, temperature and the volume fraction of the martensitic phase (M-phase), respec-tively. The volume fraction of the parent phase or austenitic phase (A-phase) is 1-z. An overdot denotes the time derivative. The material parametersbM,CM,bA andCA are
determined from the experiments.
The conditions for start and finish of the MT are expressed by the following equations, respectively.
¼CMðTMsÞ ð3Þ
¼CMðTMfÞ ð4Þ
The conditions for the reverse transformation are as follows, respectively.
0 200 400 600 800
0 1 2 3 7 8 9
Strain, ε (%)
Stress,
σ
/MPa
SM FM
SA
FA
A1
B1 B2 A2
D1
C1 D2
C2 dσ/dt=30MPa/s
dε/dt=1.67×10-4 s-1
Constant strain at Ai→Bi and Ci→Di
6 5 4
Fig. 5 Stress-strain curve for subloop loading with constant strain:ðAi;BiÞ
andðCi;DiÞ.
0 2 4 6
0 200 400 600 800
8
SA
FM
SM
FA
dε/dt =10-1s-1
dε/dt =5×10⁻⁴s-1 Temp. uncontrolled at RT
Strain,ε (%)
Stress,
σ
/MPa
Fig. 6 Stress-strain curves at various strain rates under temperature-uncontrolled condition.
∆
>
<
>
<
Temp. uncontrolled at RT
dε/dt = 10-2
s-1
SM
SA
FA
Tp
∆ ∆
σ
T
0 200 400 600 800
0 2 4 6 Strain,ε (%)
S
tr
ess,
σ
/MPa
Temperature variation,
T
/K
-10 0 10 20 30
[image:4.595.63.280.73.198.2] [image:4.595.321.532.74.234.2] [image:4.595.63.277.254.461.2]¼CAðTAsÞ ð5Þ
¼CAðTAfÞ ð6Þ
The parametersMs,Mf,AsandAf denote the start and finish
temperatures for the MT and the reverse transformation under no load, respectively.
From eq. (1), the condition for progress of the MT becomes as follows sincebM <0.
d
dT >CM: for dT>0 d
dT <CM: for dT<0
ð7Þ
From eq. (2), the condition for progress of the reverse transformation becomes as follows sincebA >0.
d
dT <CA: for dT>0 d
dT >CA: for dT<0
ð8Þ
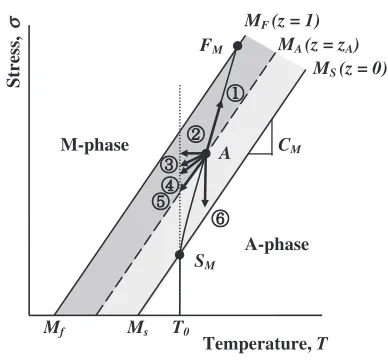
[image:5.595.67.274.75.210.2]The conditions for progress of the phase transformation in the subloop loading during the phase transformation are shown on the stress-temperature phase diagram in Fig. 8. In Fig. 8,MS (z¼0) andMF (z¼1) denote the MT start and
finish lines with a slope ofCM, respectively, andAS (z¼1)
and AF (z¼0) denote the reverse transformation start and
finish lines with a slope ofCA, respectively. PointsAandGin
Fig. 8 represent respectively the state of progress of the MT and the reverse transformation and the volume fractions of the M-phase at each point arezAandzG. The broken linesMA
andAGdenote the states with the volume fractionszAandzG,
respectively. The conditions prescribed by eqs. (7) and (8) for progress of the phase transformation from the points A
andGmean that stress and temperature vary in the directions shown by the arrows in Fig. 8.
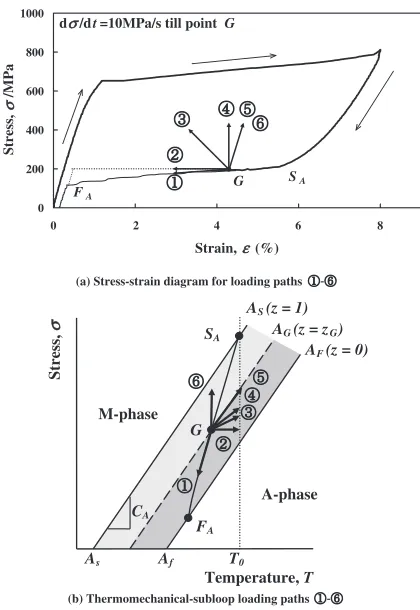
4.2 Subloop-deformation behavior during the loading process
The stress-strain diagram and stress-temperature path subjected to various thermomechanical subloop loadings from the pointAduring the loading process under the stress-controlled condition are schematically shown in Fig. 9. The stress-strain relationships–¯shown by the arrows for the subloop process from the pointA in Figure 9(a) correspond
respectively to the thermomechanical-subloop loading paths –¯shown by the arrows in Fig. 9(b).
Tensile load is applied at temperatureT0under a constant stress rate up to the pointA. The MT starts at the pointSM
during loading. The upper stress plateau starts from the point
SMin the stress-strain diagram and temperature increases due
to the MT. The stress-strain curve and variation in temper-ature depend on the loading rate.11,12,14)The thermomechan-ical paths –¯ from the point A and the corresponding deformation behaviors can be explained as follows. The path corresponds to the continuous loading under a constant stress rate. In this case, the MT progresses with the condition
d=dT>CMand the upper stress plateau finishes at the point
FM. The path`expresses the condition with holding stress
constant. In this case, the MT progresses due to decrease in temperature under the constant stress and therefore creep deformation is induced due to the MT as observed in Fig. 4. The path´corresponds to unloading under a constant stress rate. In this case, both stress and temperature decrease with the conditiond=dT <CM and the MT progresses, resulting
in increase in strain. The pathˆexpresses the condition with holding strain constant. In this case, the MT progresses due to decrease in temperature under the constant strain and stress relaxation is induced due to the MT as observed in Fig. 5. The path ˜ represents the thermomechanical neutral
load-MA (z = zA)
MS (z = 0)
AF (z = 0)
AS (z = 1)
MF (z = 1)
A A G
Stress,
σ
Temperature, T
M-phase
A-phase
AG (z = zG)
CM CA
Mf Ms As Af
Fig. 8 Conditions for progress of the MT and the reverse transformation in the subloop loading on the stress-temperature phase diagram.
(a) Stress-strain diagram for loading paths
(b) Thermomechanical-subloop loading paths
SM
Temperature, T A-phase M-phase
FM
Ms
Mf
Stress,
σ
A
T0
CM
MS (z = 0)
MA (z = zA)
MF (z = 1)
0 200 400 600 800 1000
0 4 8
Strain, ε (%)
Stress,
σ
/MPa
dσ/dt=10MPa/s till point A SM
FM
A
2 6
[image:5.595.319.535.76.198.2] [image:5.595.322.526.79.400.2] [image:5.595.326.520.229.410.2]ing.8) In this case, the MT stops with the condition
d=dT¼CM. The path ¯ is the case of elastic unloading.
In this case, the MT does not appear with the condition
d=dT>CM.
4.3 Subloop-deformation behavior during the unload-ing process
The stress-strain diagram and stress-temperature path subjected to various thermomechanical subloop loadings from the point G during the unloading process under the stress-controlled condition are schematically shown in Fig. 10. Tensile loading and unloading are applied continu-ously under a constant stress rate till the pointG. The stress-strain relationships–¯shown by the arrows for the subloop process from the point G in Fig. 10(a) correspond respec-tively to the thermomechanical-subloop loading paths –¯ shown by the arrows in Fig. 10(b).
The reverse transformation starts at the point SA during
unloading at temperatureT0. The lower stress plateau starts from the pointSAin the stress-strain diagram and temperature
decreases due to the reverse transformation. The paths–¯ from the point G and the corresponding deformation behaviors can be explained as follows. The path corresponds to the continuous unloading under a constant stress rate. In this case, the reverse transformation progresses withd=dT >CAand the lower stress plateau finishes at the
pointFA. The path`expresses the condition with holding
stress constant. In this case, the reverse transformation
progresses with increasing temperature under the constant stress and creep recovery is induced due to the reverse transformation as observed in Fig. 4. The path´corresponds to reloading under a constant stress rate. In this case, both stress and temperature increases with d=dT<CA and the
reverse transformation progresses, resulting in decrease in strain. The pathˆexpresses the condition with holding strain constant. In this case, the reverse transformation progresses with increasing temperature under the constant strain and stress recovery is induced due to the reverse transformation as observed in Fig. 5. The path˜represents the thermome-chanical neutral reloading. In this case,d=dT ¼CAand the
reverse transformation stops. The path¯is the case of elastic reloading. In this case d=dT >CA and the reverse
trans-formation does not appear.
5. Neutral Loading Behavior in the Subloop
In order to perform the thermomechanical test including the neutral loading, it is necessary to keep the condition:
d=dT¼CM. Therefore, the stress rate and the temperature
rate must satisfy the condition:d=dt¼CMdT=dt. In the
experimental apparatus, the precise temperature control of the specimen is difficult since temperature of the specimen varies due to the MT and the reverse transformation depending on the loading rate. Therefore, it is very difficult to achieve the neutral loading condition precisely. We tried to achieve this condition by many experiments and finally could carry out the following test. The controlled-stress variation in the test is shown by the solid line in Fig. 11(b). At first, uniaxial tensile load was applied to the SMA tape up to stress of 500 MPa (point A) under a constant stress rate of 12.5 MPa/s followed by unloading under a decreasing stress rate of 0.56 MPa/s for 180 s in ðA;DÞ. Following the unloading process ðA;DÞ, reloading ðD;GÞ and perfect unloading ðG;HÞ were performed under a constant stress rate of 12.5 MPa/s.
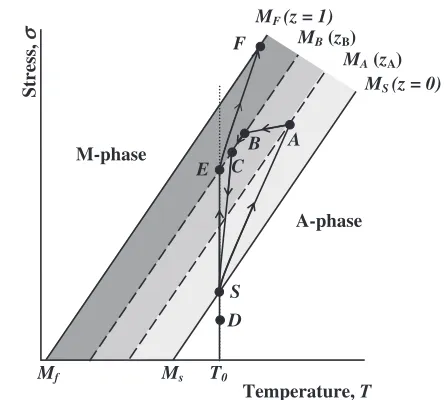
The stress-strain curve and variation in temperature obtained by the thermomechanical test including the neutral loading for the SMA tape at 293 K are shown by the solid line and the dotted line in Fig. 11, respectively. The correspond-ing thermomechanical loadcorrespond-ing path in the loadcorrespond-ing process is schematically shown in Fig. 12. As can be seen in Figs. 11 and 12, the MT starts at the point S and progresses till the pointA. Temperature increases from the pointStill the point
A due to the MT. During unloading ðA;BÞ, temperature decreases and strain increases due to the MT, corresponding to the path´ in Fig. 9. The neutral unloading condition is achieved in the process ðB;CÞ. In this process, the ratio of variation in stress to that in temperature is as follows.
T ¼
20MPa
3K ¼6:7MPa/K
The ratio of=Tis close to a value of 6 MPa/K which is the slope of the transformation line CM of the material.
Therefore, the neutral unloading condition is satisfied, resulting in stop of the MT. In the processes ðC;DÞ and ðD;EÞ, temperature varies slightly, and therefore elastic unloading and reloading occur, respectively. In the process ðE;FÞ, the MT grows again.
(a) Stress-strain diagram for loading paths
(b) Thermomechanical-subloop loading paths
SA
Temperature, T A-phase M-phase
FA
Af
As
Stress,
σ
G
T0
CA
AF (z = 0)
AG (z = zG)
AS (z = 1) 0
200 400 600 800 1000
0 4 8
Strain, ε (%)
Stress,
σ
/MPa
dσ/dt=10MPa/s till point G
SA
FA
G
[image:6.595.63.273.70.375.2]2 6
In the processðA;BÞ, the observed decrease in temperature is almost the same as that in the processðB;CÞ. This must occur due to the following reason. The temperature was measured on the surface of the central part (length of 60 mm) of the specimen. The gauge length to measure strain is 100 mm. The grippers of the specimen are quite larger than the specimen. The heat generated due to the MT in the specimen transfers quickly into the grippers. Therefore, temperature in the neighborhood of the grippers can decrease significantly during unloading, and the MT can progress in this part. As the result, the observed temperature in the process ðA;BÞat the central part of the specimen does not decrease markedly as much as estimated.
6. Conclusions
The subloop deformation behavior under the stress-controlled condition was investigated for TiNi SMA. The influence of loading condition on the deformation behavior was discussed based on the experimental results and theoretical consideration. The results obtained can be summarized as follows.
(1) In the case of low strain rate for the subloop loading, the return-point memory appears and therefore the correspond-ence between stress and strain can be obtained. If deforma-tion rate is low, the working stroke and the driving force can be controlled for SMA elements.
(2) In the case of the stress-controlled condition for the subloop loading, the return-point memory dose not appears. Even if the ambient temperature is constant, temperatures of SMA varies due to the MT. Based on the variation in temperature, strain increases during unloading and decreases during reloading. In addition, the transformation-induced creep and stress relaxation can appear under the stress-controlled condition even if the ambient temperature is constant. In order to perform the precise control of the working stroke and the driving force of SMA elements, it is necessary to take account of this property.
(3) If the ratio of variation in stress to variation in temper-ature is equal to the slope of the transformation line, the neutral loading condition is satisfied for the subloop loading and the MT stops. If this condition is satisfied, only the elastic deformation occurs in SMA elements.
Acknowledgement
The experimental work was carried out with the assistance of students of Aichi Institute of Technology, to whom the authors wish to express their gratitude. The important point of this study was suggested by the discussion with Professor Bogdan Raniecki at IFTR of Polish Academy of Sciences, to whom the authors wish to express their gratefulness. The authors also wish to extend their thanks to the Joint Research Project between two countries supported by Polish Academy of Sciences and Japan Society for Promotion of Sciences (JSPS), the Postdoctoral Fellowship supported by JSPS and the Basic Research (C) of a Grant-in-Aid of Scientific Research supported by JSPS for their financial supports. (a) Stress-strain curve and variation in temperature
(b) Variations in stress and temperature with time
S S
A A
B
B
C C
D D
E E F
F G G
H H
Stress,
σ
/MPa
Time, t/s
Temperature variation,
∆
T
/K
0 200 400 600 800
0
0 10 20 1000
-10
-20
-30
100 200 300 400
σ ∆T
>
<
S A
S A B D B D
F
F G
H
H
G
E E
Stress,
σ
/MPa
Strain,ε (%)
Temperature variation,
∆
T
/K
0 200 400 600 800
0 2 4 6 0 10 20 30 1000
-10
-20
-30
σ
[image:7.595.71.269.76.238.2]∆T
Fig. 11 Stress-strain diagram and variation in stress and temperature with time obtained by the thermomechanical test with two kinds of stress rate including the neutral unloading (a) Stress-strain curve and variation in temperature (b) Variations in stress and temperature with time.
Stress,
σ
Temperature, T
S
A-phase M-phase
F
Ms
Mf
A
T0
D C
B E
MS (z = 0)
MA (zA)
MB (zB)
[image:7.595.312.534.88.288.2]MF (z = 1)
REFERENCES
1) H. Funakubo (ed.):Shape Memory Alloys, (Gordon and Breach Science Pub., 1987) pp. 1–60.
2) T. W. Duering, K. N. Melton, D. Stokel and C. M. Wayman, (eds.): Engineering Aspects of Shape Memory Alloy, (Butterworth-Heine-mann, 1990) pp. 1–35.
3) K. Otsuka and C. M. Wayman, (eds.): Shape Memory Materials, (Cambridge University Press, 1998) pp. 1–49.
4) T. Saburi, (ed.):Shape Memory Materials(Trans Tech Pub., 2000) pp. 315–366.
5) Y. Y. Chu and L. C. Zhao (eds.):Shape Memory Materials and Its Applications, (Trans Tech Pub., 2002) pp. 177–284.
6) J. S. Shaw and S. Kyriakides: J. Mech. Phys. Solids43(1995) 1243– 1281.
7) P. H. Lin, H. Tobushi, K. Tanaka, T. Hattori and M. Makita: J. Intell. Mat. Syst. Struct.5(1994) 694–701.
8) B. Raniecki, C. Lexcellent and K. Tanaka: Arch. Mech.44(1992) 261–
284.
9) G. Socha, B. Raniecki and S. Miyazaki: 33rd Solid Mechanics Conference, (2000) pp. 369–370.
10) H. Tobushi, H. Iwanaga, K. Tanaka, T. Hori and T. Sawada: Continuum Mech. Thermodyn.3(2000) 79–93.
11) H. Tobushi, K. Tanaka, Y. Shimeno, W. K. Nowacki and S. P. Gadaj: Proc. Instn. Mech. Engrs., Part L, J. Materials: Design and Applications
213(1999) 93–102.
12) E. A. Pieczyska, H. Tobushi, S. P. Gadaj and W. K. Nowacki: Mater. Trans.47(2006) 670–676.
13) E. A. Pieczyska, S. P. Gadaj, W. K. Nowacki and H. Tobushi: Exp. Mech.46(2006) 531–542.
14) S. P. Gadaj, W. K. Nowacki and H. Tobushi: Arch. Mech.51(1999) 649–663.
15) E. A. Pieczyska, S. P. Gadaj, W. K. Nowacki and H. Tobushi: Int. J. Applied Electromagnetics Mechanics23(2006) 3–8.
16) K. Tanaka: Res. Mechanica18(1986) 251–263.