Risk Early-Warning Method for Natural Disasters Based
on Integration of Entropy and DEA Model
*
Fengshan Wang, Yan Cao, Meng Liu
Engineering Institute of Engineering Corps, PLA University of Science & Technology, Nanjing, China E-mail: wfs919@tom.com
Received September 1, 2010; revised October 31, 2010; accepted November 5,2010
Abstract
Risk early-warning of natural disasters is a very intricate non-deterministic prediction, and it was difficult to resolve the conflicts and incompatibility of the risk structure. Risk early-warning factors of natural disasters were differentiated into essential attributes and external characters, and its workflow mode was established on risk early-warning structure with integrated Entropy and DEA model, whose steps were put forward. On the basis of standard risk early-warning DEA model of natural disasters, weight coefficient of risk ly-warning factors was determined with Information Entropy method, which improved standard risk ear-ly-warning DEA model with non-Archimedean infinitesimal, and established risk earear-ly-warning preference DEA model based on integrated entropy weight and DEA Model. Finally, model was applied into landslide risk early-warning case in earthquake-damaged emergency process on slope engineering, which exemplified the outcome could reflect more risk information than the method of standard DEA model, and reflected the rationality, feasibility, and impersonality, revealing its better ability on comprehensive safety and structure risk.
Keywords: Entropy, Data Envelopment Analysis, Comprehensive Integration, Essential Attribute, Risk Early-Warning, Natural Disaster
1. Introduction
Timely and exact early-warning of natural disasters, can effectively reduce loss of life and property, which is an important basis for emergency management and disaster relief decision-making [1].
Risk early-warning is an extremely intricate and dy-namic process, its early-warning object is the risk event that was not certain and evident [2]. The relation among the factors that influenced risk was intricacy and com-plex [3], which often behaved fuzzy, certain, potential, random, conflict, incompatible and other polymorphism [4].
Data Envelopment Analysis (DEA) was brought for-ward by A. Charnes, W. Cooper, and other scholars of U.S. operations research, which evaluated the relative effectiveness or probability of decision-making unit with changing weight, as an important method for showing relative efficiency evaluation [5]. DEA was strong in its objectivity, and its conclusions from subjective human
personality, which presents a positive role on risk evalu-ation [6,7], best selection and sort, effectiveness of fore-casting combination, decision-making unit, and other aspects. But, DEA evaluation is entirely dependent on objective data, and can not reflect the preference of the risk early-warning factors in the special risk environ-ment.
Model and method of risk early-warning must adapt to the requirement of natural disasters, as the characteristics of natural disasters are polymorphism, contradictory and incompatible. The comprehensive integration of DEA theory and Information Entropy theory [8], was applied into relational features, structure, function, organization and regulatory mechanisms of complex early-warning issues. It is useful for eliminating the subjective weight when determining the indicator weight, and solving the pivotal contradiction and incompatibility among indica-tors.
entropy weight preference of risk early-warning factors, further carried on the evaluation about the relative risk degree of risk early-warning sample, and finally realized the impersonal, reasonable, accurate, scientific early- warning decision about the risk natural disaster condi-tions.
2. Risk Early-Warning Workflow Mode
about Natural Disasters
2.1. Early-Warning Characters of Risk Events
Set as the abstract sign of earthquake, floods and other natural disasters, and denoted the potential risk. And, Cidenoted the general risk factor of potential risk , whose factor set was denoted as C
C ii| 1, 2, , m
.The movement and evolution of risk is consistent with the general laws of material movement and social development, which is determined by internal factors, objectively existed in the essential attributes of risk events, such as rock integrity coefficient in the landslide risk of rock slope engineering.
Risk is random, disordered, which happened as the essential attributes normally activated by a lot of un-expected external factors, such as daily maximum rain-fall in the landslide risk of rock slope engineering.
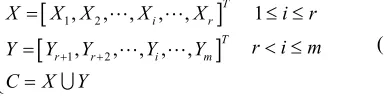
Therefore, the early-warning factors of risk could be differentiated into essential attributes and external characters. Set Xi as the signal risk early-warning ex-ternal character, i1, 2, , r, and Yi as its signal es-sential attributes, i r 1, , . m Then, the early-war- ning factors of risk , formalized as:
1 2
1 2
, , , , , 1
, , , , ,
T
i r
T
r r i m
X X X X X i r
r i m
Y Y Y Y Y
C X Y
(1)
where early-warning characteristic system was formally denoted for risk . Here, X denoted the set about ex-ternal characters, and Y denoted the set about essential attributes.
2.2. Basic Mathematical Expression about Risk Early-Warning Events
In accordance with the X and Y level classification of risk early-warning factors, based on the low risk expectations of psychological characteristics, the measuring require-ment was designed, which provided rules for risk early- warning samples.
Essential attribute measuring requirement: As yij denoting the value of risk early-warning sample Ej on
the essential attribute Ci of Y, yij satisfied the max type, namely the greater measurement and the lower risk. External character measuring requirement: As xij denoting the value of risk early-warning sample Ej on the external character Ci of X, xij satisfied the min type, namely the lower measurement and the lower risk.
Based on measuring requirement for risk ear-ly-warning sample, risk earear-ly-warning was essentially to distill risk sample, determine the risk early-warning im-personal data, and further determine the measuring value or the relative risk degree of risk early-warning sample, and finally confirm the important risk early-warning po-sitions.
Accordingly, risk early-warning was denoted formally: :: , ,
opt C E F (2)
Here, E denoted risk early-warning sample set, in-cluding E1, E2, ···, Ej, ···, En. And, F formally de-noted the risk early-warning mathematical methods, in-cluding parametric, non-parametric methods, and intelli-gent reasoning method.
In view of the min & max changing characteristics and measuring requirements in risk early-warning factors, risk early-warning function was designed formally, as the following expression in (3).
1, 2, , 1 2
, , ,
, , ,
r j r j m j max j
j j rj min
y y y
F opx
x x x
(3)
where the inherent and external mechanism was indi-cated through the formal mathematical logic, revealing inherent stability of the risk early-warning sample. Here,
j
F denoted the risk parameter of the risk early-warning sample, xij(1 i r )denoted the measurement of sample Ej on the external character Xi , and yij
(r 1 i m)denoted the risk estimation of sample
j
E on the essential attribute Yi.
2.3. Risk Early-Warning Workflow Model
According to the risk management requirements of natu-ral disaster , with the extraction the restraint require-ment of risk early-warning, and the identification of po-tential risk event and its related factors, the essential attribute set Y and external character set X was estab-lished for the risk early-warning of natural disasters.
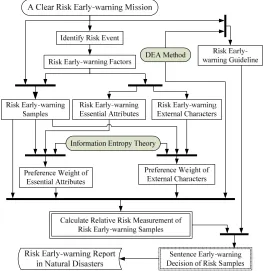
Design risk early-warning workflow mode for natural disasters on the integrated basis of Entropy and DEA model, as shown in Figure 1.
Integration of Entropy and DEA model was carried into the natural risk early-warning operations, which mainly contained four stages.
[image:2.595.87.279.488.536.2]natu-ral disaster , and differentiate essential attributes and external characters.
2) Extract the risk early-warning samples for natural disasters, and determine the information entropy prefe-rence of essential attribute Y and external character X for risk early-warning.
3) Establish the relative risk early-warning value pre-ference DEA model of natural disaster , and calculate the relative safe degree of the risk early-warning sample.
4) In accordance with Relative Risk Sentencing Guideline, sentence the relative risk degree of risk early-
warning samples, and submit the analysis for the risk natural events.
3. Risk Early-Warning DEA Model for
Natural Disasters
3.1. Risk Early-Warning Data Structure
[image:3.595.166.429.224.495.2]According to the fundamental principle of DEA [9], the relative risk decision-making data structure was erected for risk early-warning samples, as shown in Figure 2.
Figure 1. Risk early-warning workflow mode of entropy-based DEA model.
1
E E2 … Ej … En
1
C → x1,1 x1,2 … x1,j … x1,n
2
C → x2,1 x2,2 … x2,j … x2,n
r
C → xr,1 xr,2 … xr j, … xr n, 1,1
r
y yr1,2 … yr1,j … yr1,n → Cr1 2,1
r
y yr2,2 … yr2,j … yr2,n → Cr2
… …
,1
m
y ym,2 … ym j, … ym n, → Cm
[image:3.595.167.429.525.705.2]In Figure 2, the risk early-warning sample Ej was converted into decision-making unit (DMUj) in relative risk decision-making system, and each DMUj had the measurement about r external characters and m r essential attributes.
With the relative decision-making unit structure of risk early-warning sample, suppose that Xj denoted the measurement of risk early-warning sample Ej on ex-ternal character, and Yj denoted its measurement on essential attributes. Then, decision-making unit was de-noted formally for the risk early-warning sample as in (4).
1, 2, , 1, 2, ,
, , ,
, , ,
, | 1, 2, ,
T
j j j r j
T j r j r j m j
j j j
X x x x
Y y y y
DMU X Y j n
(4)
where with decision-making unit model of DEA, deci-sion-making data structure was established for risk ear-ly-warning sample of natural disaster. Among them, Xj signed the characterization about the external risk input vector of decision-making unit, and Yj signed the cha-racterization about the essential safe output vector of decision-making unit.
3.2. Basic Risk Early-Warning DEA Model
Formula (3) formally denoted the relative risk analysis about risk early-warning samples, which was similar to DEA efficiency evaluation expression.
Set the risk early-warning sample E1, E2, ···, Ej, ···, n
E of natural disasters as DEA decision-making unit, analyzing the relative risk of decision-making unit Ek.
According to DEA model, basic mathematical DEA model was established for natural risk early-warning sample, such as the following formula.
max
0, 1
0, 0, 1, 2, ,
T k p T T j j T k Y V
v X Y
v X
v j n
(5)
In Formula (5), v denoted the weight vector of risk early-warning external character measurement Xj, and denoted the weight vector of risk early-warning es-sential attribute measurement Yj. Vp signed the best efficiency evaluation of risk early-warning decision- making unit Ek for natural disasters, namely the overall safety degree of decision-making unit Ek relative to other decision-making units, and there Vp1.
3.3. Risk Early-Warning DEA Model with Non-Archimedean Infinitesimal
Model (5), was known as standard DEA model, namely 2
C R model. Other related application showed [10,11], there was often multi-effectiveness phenomenon, so it was not easy to directly determine the effectiveness of DEA. Charnes introduced the concept of non-Archime- dean infinitesimal in his study on the degradation phe-nomenon of linear programming, successfully solved the difficulty in the calculation and technology of C R2 model.
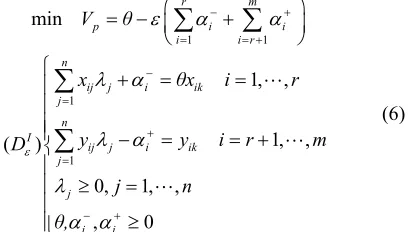
Using the dual form of C R2 model in DEA method, non-Archimedean infinitesimal relative safe evaluation model was established for risk early-warning samples, such as model (6).
1 1 1 1 min 1, , 1, , ( )
0, 1, ,
, 0
r m
p i i
i i r
n
ij j i ik
j n I
ij j i ik
j j
i i
V θ
x θx i r
y y i r m
D j n θ,
(6)where Vp denoted the risk measurement of risk sample k
E , namely risk early-warning decision-making unit k
DMU , which was consistent with the Vp expression in model (5). Here, i denoted the slack variable about
the external character, i denoted the slack variable
about the essential attribute, and signed the non- Arc-himedean infinitesimal constant variable, which was less than any positive number, but large than 0, usually taken on 105.
3.4. Relative Risk Sentencing Guideline
Suppose that the optimal solution of model (6) was θ0, 0
, 0
i
, 0
i
, then the relative risk sentencing
guide-line was established for the early-warning sample Ek according to DEA model [6].
Guideline 1: If θ01, then the risk early-warning decision-making unit DMUk was evaluated as weak DEA efficiency, and it sentenced the risk early-warning sample Ek about natural disasters as relative weak effi-ciency, namely the weak efficiency in relative safety.
Guideline 2: If θ01 and 0 0
1 1
0
r m
i i
i i r
, [image:4.595.336.540.280.396.2]namely the efficiency in relative safety for natural disas-ters.
4. Improved DEA Model for Risk
Early-Warning Sample
Model (6), calculated relative safe degree of the objec-tive risk early-warning sample data relaobjec-tive safety, which played a positive role in the decision of risk warning measurement; but it hadn’t made the best of objective data, and could not reflect preference information of the external character and essential attribute.
4.1. Standardization of Risk Early-Warning Characteristics
In accordance with the data expression of decision- making unit for risk early-warning sample, as the For-mula (4), the initial risk early-warning matrix R~ was established for natural disasters in (7).
11 1 1,1 ,1 1
12 2 1,2 ,2
2
1 1, ,
r r m
r r m
n rn r n m n
n
x x y y
E
x x y y
E R
x x y y
E (7)
With terminal minus, the initial risk early-warning sample matrix R of natural disaster was standardized. If the early-warning factor Ci showed the external cha-racter, namely the positive effect in natural disasters, then:
'
1 1 1
ij ij j n ij j n ij j n ij x x min x max x min x
(8)
If the early-warning factor Ci showed the essential attribute, namely the negative effect in natural disasters, then:
'
1 1 1
ij j n ij ij j n ij j n ij y max y y max y min y
(9)
Thus, under the natural disasters emergency, the initial risk early-warning sample matrix R turned into the standard matrix R:
' ' ' '
1 11 1 1,1 ,1
' ' ' '
2 12 2 1,2 ,2
' ' ' '
1 1, ,
r r m
r r m
n n rn r n m n
E x x y y
E x x y y
R
E x x y y
(10)
4.2. Preference Information Entropy Calculation on Risk Early-Warning Factors
The weight value of early-warning factor was a
con-cernful information in early-warning structure for risk natural disasters, which was easily impacted by human personality. There was complexity and uncertainty, as well as contradiction in the decision-making process, so it was difficult to estimate the specific factor weight.
Entropy was a measure of uncertain due to the un-known part of a message system [12]. With Entropy theory, the weight value could be determined through the inner components and relations in the risk early-warning system. It was absolutely an impersonal weighting me-thod. This method used entropy value to reflect the de-gree of information disorder, which could effectively reduce subjective bias on indicator weight.
According to the standard matrix R for risk early- warning sample, suppose that fij showed the propor-tion of risk early-warning event Ej on the risk early- warning factor Ci, then:
' '
1
' '
1
/ 1, 2, ,
/ 1, ,
n ij ij j ij n ij ij j
x x i r
f
y y i r m
(11)In terms of the information entropy theory [8], the natural disaster conditions and the risk entropy principles [13], the Shannon entropy value of the early-warning factor Ci could be got with the following equation, as shown in (12).
1
1 ln
ln n
i i ij ij
j
e H C f f
n
(12)Here, ei said the entropy value of the risk early- warning samples in natural disaster. As the entropy value show greater, it reflected the greater degree of internal disorder in the natural risk system. As fij 0, fij
0.00001 was set.
Thus, for natural disasters, the weight of risk early- warning Ci was calculated, as:
1
1
1 1
1 1, 2, ,
1 1, ,
1 r
i i i
i m
i i i
i r
r m
i i
i i r
e n e i r
e n e i r m
(13)
where i said the weight value of risk early-warning factor Ci in natural disaster event.
4.3. Risk Early-Warning DEA Model with Preference Entropy Weight
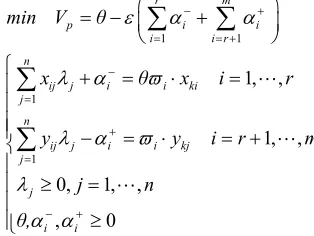
dis-aster as decision-making unit, and improve the non- Arc-himedean infinitesimal risk early-warning DEA model according to the preference weight of risk early-warning factor for natural disasters. Then, risk early-warning DEA model with preference entropy weight was estab-lished on the risk early-warning sample Ek, such as model (14).
1 1
1
1
1, ,
1, , 0, 1, ,
, 0
r m
p i i
i i r
n
ij j i i ki
j n
ij j i i kj
j j
i i
min V θ
x θ x i r
y y i r m
j n
θ,
(14)
In model (14), the expression and significance of θ, , i,
i
and other variables, were consistent with
model (6). And, model (14) carried forward entropy analysis in disaster information systems [14].
4.4. Risk Early-Warning DEA Sentencing Guideline with Preference Entropy Weight
Suppose that the optimal solution of model (14) was θ0, 0
, 0
i
, 0
i
, whose expression and significance was
consistent with model (6). Set V Ep
k as the relative safe measurement of risk early-warning sample Ek, and establish risk early-warning entropy DEA sentencing guideline.Guideline 3: According to the formula (15), determine the order of risk early-warning samples. Then, determine the lowest value on the relative safe measurement of risk
early-warning samples, and sentence the corresponding sample as the relative most risk sample unit.
minj V Ep j (15)
Guideline 4: Set V Ep
as the relative safe grade threshold of risk early-warning samples. If the formula (16) was true, the risk early-warning sample Ej was sentenced as key risk early-warning unit.
1, 2, ,p j p
V E V E j n (16)
5. Case study on Risk Early-Warning for
Slope Landslide
5.1. Initial Data for Risk Early-Warning Event of Slope Landslide Case
For instance, in emergency response on earthquake- damaged rock slope engineering, potential landslide was the risk event. According to the multi-layer indicator system for evaluating the overall safety on rock slope engineering in reference [15-18], the risk early-warning factors were given, as shown in Table 1.
Here, essential attributes included rock structure, rock mass deformation modulus, rock integrity coefficient, cohesion and internal friction angle; and external cha-racters included slope height, slope angle, maximum daily rainfall, monthly total rainfall, seismic level acce-leration, maximum terra stress, surface deformation rate, drainage capability, and others.
[image:6.595.84.241.172.290.2]In the emergency response process on earthquake- damaged rock slope engineering, it supposed that the risk early-warning sample included E1, E2, E3, E4, E5 and E6, which needed more important focus, and its relevant factors and value, as shown in Table 1.
Table 1. Value of the early-warning factor for slope landslide risk samples in earthquake-damaged emergency response.
Sample
External factors (minType) Essential attributes (maxType)
Slope height
Slope angle
Daily maximum
rainfall
Month cumulative
rainfall
Seismic horizontal acceleration
Maximum terra stress
Surface deformation
rate
Drainage performance
Rock structure
Rock mass deformation
modulus
Rock integrity
coefficient Cohesion Internal friction
angle
1
E 0.85 26 56 290 0.15 12.8 0.08 0.25 71 2.7 0.43 0.12 24
2
E 1.15 39 28 245 0.09 14.7 0.26 0.49 54 6.9 0.39 0.18 39
3
E 1.06 12 89 212 0.13 4.1 0.17 0.35 29 7.5 0.75 0.26 14
4
E 0.79 21 63 229 0.07 4.3 0.09 0.21 89 20.5 0.64 0.21 27
5
E 0.54 51 47 192 0.31 11.8 0.32 0.83 86 11.4 0.20 0.29 12
6
[image:6.595.58.542.545.721.2]5.2. DEA Calculation on Risk Early-Warning
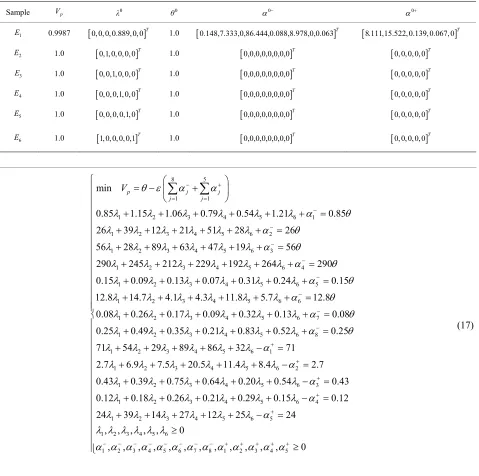
According to model (6), linear programming model was established on the relative safe evaluation of risk early- warning, such as model (17).
In model (17), the optimal solution was got, as 0.9987
p
V .
Related variables:
0 0,0,0,0.8889,0,0T
λ , θ01.0,
0 0.148,7.333,0,86.444,0.088,8.978,0,0.063T
,
0 8.111,15.522,0.139,0.067,0T
.
Similarly, the relative safe degree DEA evaluation and its variable values could be obtained for the risk sample
2
E , E3, E4, E5, E6, as shown in Table 2.
[image:7.595.61.540.265.741.2]According to DEA relative risk sentencing guidelines, as Guideline 1 and Guideline 2, the relative safe mea-surement of E1 was the minimum value, so it was sen-tenced as the maximum risk sample. And, the relative safe evaluation of E2, E3, E4, E5 and E6 was all the same 1.0,which said the consistent relative safety. So it showed the degradation phenomenon of risk early- warning samples, and it was difficult to carefully explain the inherent risks.
Table 2. DEA evaluation about risk early-warning case.
Sample Vp λ0 θ0 0 0
1
E 0.9987 0,0,0,0.889,0,0T 1.0 0.148,7.333,0,86.444,0.088,8.978,0,0.063T 8.111,15.522,0.139,0.067,0T
2
E 1.0 0,1,0,0,0,0T 1.0 0,0,0,0,0,0,0,0T 0,0,0,0,0T
3
E 1.0 0,0,1,0,0,0T 1.0 0,0,0,0,0,0,0,0T 0,0,0,0,0T
4
E 1.0 0,0,0,1,0,0T 1.0 0,0,0,0,0,0,0,0T 0,0,0,0,0T
5
E 1.0 0,0,0,0,1,0T 1.0 0,0,0,0,0,0,0,0T 0,0,0,0,0T
6
E 1.0 1,0,0,0,0,1T 1.0 0,0,0,0,0,0,0,0T 0,0,0,0,0T
8 5
1 1
1 2 3 4 5 6 1
1 2 3 4 5 6 2
1 2 3 4 5 6 3
1 2 3 4 5 6 4
min
0.85 1.15 1.06 0.79 0.54 1.21 0.85
26 39 12 21 51 28 26
56 28 89 63 47 19 56
290 245 212 229 192 264 290
p j j
j j
V
1 2 3 4 5 6 5
1 2 3 4 5 6 6
1 2 3 4 5 6 7
1 2 3 4 5 6 8
0.15 0.09 0.13 0.07 0.31 0.24 0.15
12.8 14.7 4.1 4.3 11.8 5.7 12.8
0.08 0.26 0.17 0.09 0.32 0.13 0.08
0.25 0.49 0.35 0.21 0.83 0.52 0.2
1 2 3 4 5 6 1
1 2 3 4 5 6 2
1 2 3 4 5 6 3
1 2 3 4 5 6 4
1 2 3
5
71 54 29 89 86 32 71
2.7 6.9 7.5 20.5 11.4 8.4 2.7
0.43 0.39 0.75 0.64 0.20 0.54 0.43
0.12 0.18 0.26 0.21 0.29 0.15 0.12
24 39 14 27
4 5 6 5
1 2 3 4 5 6
1 2 3 4 5 6 7 8 1 2 3 4 5
12 25 24
, , , , , 0
, , , , , , , , , , , , 0
5.3. Risk Early-Warning DEA Model with Entropy Weight
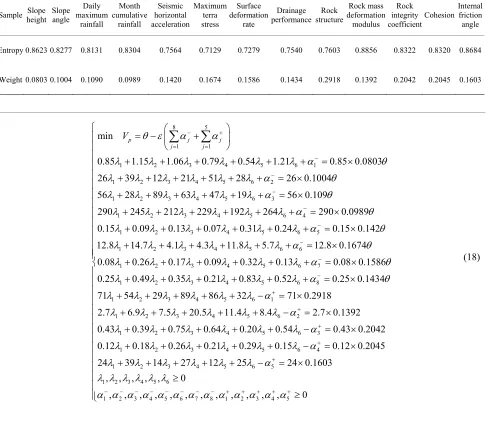
Risk early-warning samples were prepared in Table 1. Firstly, standardize the initial risk early-warning data according to Formulas (7), (8), (9) and (10). Then, cal-culate the entropy value and weight value of the natural risk early-warning indicator according to Formulas (11), (12) and (13), Table 3 showed the entropy value and weight value.
In Table 3, the entropy value reflected the amount of useful information that the early-warning indicators pro-vided for landslide early-warning system in the earth-quake-damaged slope engineering. For example, “slope height” showed the maximum entropy value, and its weight value was 0.0803, which was the minimum weight value in the risk indicators. Information effectiveness of
the entropy measurement denoted the changing rule, which has the greater entropy value and the smaller weight value of the risk early-warning factor.
According to model (14), the relative safe entropy DEA evaluation model of risk early-warning sample E1 was erected, such as (18).
In model (18), the optimal solution was got, as 2.5362
p
V .
Related variables:
0 0,0,0,0.186,0.048,0T
λ , θ02.5365,
0 2.537,0,0.253,1.487, 20.855,0.026, 4.066,0T
0 0,3.991,0.041,0.029,1.759T
.
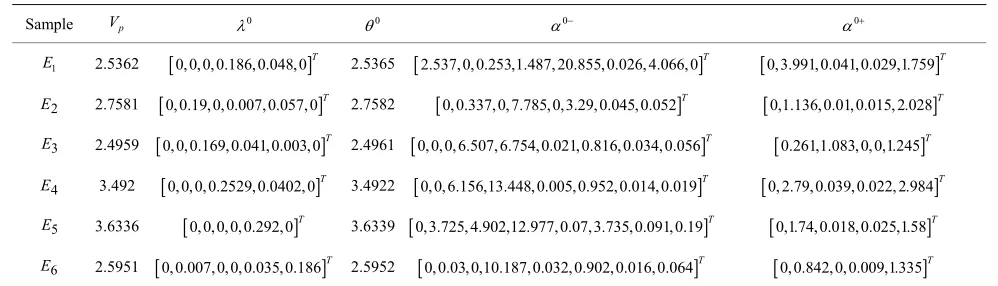
Similarly, the relative safe degree DEA evaluation and its variable values could be obtained for the risk sample
2
[image:8.595.57.544.317.742.2]E , E3, E4, E5, E6, as shown in Table 4.
Table 3. Entropy value and weight value of the risk early-warning factor for slope landslide risk case.
Sample height Slope Slope angle Daily maximum
rainfall
Month cumulative
rainfall
Seismic horizontal acceleration
Maximum terra stress
Surface deformation
rate
Drainage performance
Rock structure
Rock mass deformation
modulus Rock integrity coefficient
Cohesion Internal friction angle
Entropy 0.8623 0.8277 0.8131 0.8304 0.7564 0.7129 0.7279 0.7540 0.7603 0.8856 0.8322 0.8320 0.8684
Weight 0.0803 0.1004 0.1090 0.0989 0.1420 0.1674 0.1586 0.1434 0.2918 0.1392 0.2042 0.2045 0.1603
8 5
1 1
1 2 3 4 5 6 1
1 2 3 4 5 6 2
1 2 3 4 5 6 3
1 2 3 4
min
0.85 1.15 1.06 0.79 0.54 1.21 0.85 0.0803
26 39 12 21 51 28 26 0.1004
56 28 89 63 47 19 56 0.109
290 245 212 229
p j j
j j
V
5 6 4
1 2 3 4 5 6 5
1 2 3 4 5 6 6
1 2 3 4 5 6 7
192 264 290 0.0989
0.15 0.09 0.13 0.07 0.31 0.24 0.15 0.142
12.8 14.7 4.1 4.3 11.8 5.7 12.8 0.1674
0.08 0.26 0.17 0.09 0.32 0.13 0.08 0.1586
0.
1 2 3 4 5 6 8
1 2 3 4 5 6 1
1 2 3 4 5 6 2
1 2 3 4 5 6 3
25 0.49 0.35 0.21 0.83 0.52 0.25 0.1434
71 54 29 89 86 32 71 0.2918
2.7 6.9 7.5 20.5 11.4 8.4 2.7 0.1392
0.43 0.39 0.75 0.64 0.20 0.54 0.4
1 2 3 4 5 6 4
1 2 3 4 5 6 5
1 2 3 4 5 6
1 2 3 4 5 6 7 8 1 2 3 4 5
3 0.2042
0.12 0.18 0.26 0.21 0.29 0.15 0.12 0.2045
24 39 14 27 12 25 24 0.1603
, , , , , 0
, , , , , , , , , , , , 0
Table 4. Entropy DEA assessment for risk early-warning case.
Sample Vp 0 0 0 0
1
E 2.5362 0,0,0,0.186,0.048,0T 2.5365 2.537,0,0.253,1.487, 20.855,0.026, 4.066,0T 0,3.991,0.041,0.029,1.759T
2
E 2.7581 0,0.19,0,0.007,0.057,0T 2.7582 0,0.337,0,7.785,0,3.29,0.045,0.052T 0,1.136,0.01,0.015, 2.028T
3
E 2.4959 0,0,0.169,0.041,0.003,0T 2.4961 0,0,0,6.507,6.754,0.021,0.816,0.034,0.056T 0.261,1.083,0,0,1.245T
4
E 3.492 0,0,0,0.2529,0.0402,0T 3.4922 0,0,6.156,13.448,0.005,0.952,0.014,0.019T 0, 2.79,0.039,0.022, 2.984T
5
E 3.6336 0,0,0,0,0.292,0T 3.6339 0,3.725, 4.902,12.977,0.07,3.735,0.091,0.19T 0,1.74,0.018,0.025,1.58T
6
E 2.5951 0,0.007,0,0,0.035,0.186T 2.5952 0,0.03,0,10.187,0.032,0.902,0.016,0.064T 0,0.842,0,0.009,1.335T
According to risk early-warning entropy DEA sen-tencing guideline, namely Guideline 3, the relative safe order of the risk early-warning disaster samples could be obtained as V Ep
3 < V Ep
1 < V Ep
6 < V Ep
2< V Ep
4 <V Ep
5 .In accordance with Guideline 4, set the relative safe threshold of the risk early-warning samples as
3.0 pV E , then sentence the risk sample 3
E , E1, 6
E , E2 as the important risk early-warning units. Comparing the calculation outcome of landslide risk case of earthquake-damaged emergency response in Ta-ble 2 and TaTa-ble 4, entropy DEA model could explore more information, whose conclusion was more reliable than the standard DEA model, benefiting the sentencing about the relative risk measurement of risk early-warning samples for natural disasters.
6. Conclusions
1) Differentiate the risk early-warning factors of natural disasters into essential attributes and external characters. Using the integration of Entropy and DEA model, risk early-warning model was erected. It made the best of information, and had high reliability. This algorithm was easy to realize by computer software, and had good re-sults. It was a new way for risk early-warning of natural disasters.
2) Determinating the weight value of natural risk early warning indicator through entropy value, solved the con-flicts and incompatibilities among indicators, and elimi-nated the effect of random personality.
3) Risk landslide early-warning case in earthquake emergency response testified, that entropy DEA model explored more implicit preference information of essen-tial attributes and external characters in early-warning samples, whose outcome reflected more additional risk information than the standard DEA model, effectively improving the sentencing on relative risk degree of early-
warning samples for natural disasters.
4) Entropy DEA model integrated the objectivity of DEA model and the information entropy of early-war- ning samples, whose essence was the preference DEA model based on entropy weight. And, its result was more realistic and widely useful. But how to assess core fac-tors in risk early-warning system needed further explora-tion.
7. References
[1] M. Jarraud, “Reducing the Risk of Natural Disasters through Early Warnings,” Bulletin of the American Me-teorological Society, Vol. 86, No. 2, 2005, pp. 155-156. [2] V. Selman, A. L. Selman and J. Selman, “Earthquake/
Quackery: The Science/Art of Predicting Natural Disas-ters,” Simulation Series, Vol. 15, No. 1, 1985, pp. 113- 117.
[3] H. Yang and R. F. Adler, “Towards an Early-Warning System for Global Landslides Triggered by Rainfall and Earthquake,” International Journal of Remote Sensing, Vol. 28, No. 16, 2007, pp. 3713-3719. doi:10.1080/ 01431160701311242
[4] K. Kubo, “Prediction and Its Reliability,” Civil Engi-neering in Japan, Vol. 26, No. 12, 1987, pp. 1-10. [5] A. Charnes, W. W. Cooper and E. Rhodes, “Measuring
the Efficiency of Decision-Making Units,” European Journal of Operational Research, Vol. 2, No. 6, 1978, pp. 429-444. doi:10.1016/0377-2217(78)90138-8
[6] J. K. Sengupta, “Measuring Dynamic Efficiency under Risk Aversion,” European Journal of Operational Re-search, Vol. 74, No. 1, 1994, pp. 61-69. doi:10.1016/ 0377-2217(94)90203-8
[7] Z.-X. Ma and H.-L. Ren, “An Evaluation Method Based on Some Sample Units and Its Applying on FSA,” Sys-tems Engineering—Theory & Practice, Vol. 23, No. 2, 2003, pp. 96-100.
[9] J. K. Sengupta, “Efficiency Measurement in Stochastic Input-Output Systems,” International Journal of Systems Science, Vol. 13, No. 3, 1982, pp. 273-287. doi:10.1080/ 00207728208926348
[10] Y.-M. Wang and Y. Luo, “DEA Efficiency Assessment Using Ideal and Anti-ideal Decision-Making Units,” Ap-plied Mathematics and Computation (New York), Vol. 173, No. 2, 2006, pp. 902-915.
[11] S. Mehrabian, M. R. Alirezaee and G. R. Jahanshahloo, “Complete Efficiency Ranking of Decision-Making Units in Data Envelopment Analysis,” Computational Optimi-zation and Applications, Vol. 14, No. 2, 1999, pp. 261- 266. doi:10.1023/A:1008703501682
[12] L. S. Qu, L. M. Li and J. Lee, “Enhanced Diagnostic Certainty Using Information Entropy Theory,” Advanced Engineering Information, Vol. 17, No. 3-4, 2003, pp. 141-150. doi:10.1016/j.aei.2004.08.002
[13] J. J. Buckley, “Entropy Principles in Decision-Making under Risk,” Risk Analysis, Vol. 5, No. 4, 1985, pp. 303-313. doi:10.1111/j.1539-6924.1985.tb00186.x [14] S. Bilgi, C. Ipbuker, D. Ucar and M. Sahin, “Map
Entro-py Analysis of Topographic Data Used in Disaster In-formation Systems,” Journal of Earthquake Engineering, Vol. 12, No. S2, 2008, pp. 23-36.
[15] X. L. Tan, W. Y. Xu and G. L. Liang, “Application of Extenics Method to Comprehensive Safety Evaluation of Rock Slope,” Chinese Journal of Rock Mechanics and Engineering, Vol. 28, No. 12, 2009, pp. 2503-2509. [16] Y. P. Yin, F. W. Wang and P. Sun, “Landslide Hazards
Triggered by the 2008 Wenchuan Earthquake, Sichuan, China,” Landslides, Vol. 6, No. 2, 2009, pp. 139-151. doi:10.1007/s10346-009-0148-5
[17] G. Q. Chen, “Practical Techniques for Risk Analysis of Earthquake-Induced Landslide,” Chinese Journal of Rock Mechanics and Engineering, Vol. 27, No. 12, 2008, pp. 2395-2402.