ISSN Print: 2161-4954
Real Time Recrystallization Study of 1, 2
Dodecanediol on Highly Oriented Pyrolytic
Graphite (HOPG) by Tapping Mode Atomic
Force Microscopy
S. K. Dora
Nanomagnetics Instruments Pvt. Ltd., Ankara, Turkey
Abstract
Real-time atomic force microscopy (AFM) imaging revealed for the first time, the detailed growth/dissolution mechanism of Lauryl glycol (LG) or 1, 2 do-decanediol molecules on HOPG at the nano-level after recrystallizing them from chloroform solution. At the early stage of recrystallization, parallelo-gram-like-structures having lengths of several microns and distinct widths (between ~ 100 - 400 nm) were observed. Growth/dissolution behavior of these parallelogram-like-structures as a function of time was investigated. While dissolution occurred along all three dimensions, growth was found to be strictly two dimensional. Both the growth and dissolution process were found to be logarithmic in nature. The average growth rates along their length and width were found to be 11 nm/min and 1.5 nm/min respectively. Average dissolution rate in percentage on HOPG surface was found to be ~ 0.078%/ min. Based upon the recrystallization of LG molecules schematics are drawn for a better understanding of the recrystallization process.
Keywords
1, 2 Dodecanediol, Kinetics, Real Time Growth, Tapping Mode AFM
1. Introduction
1, 2-Alkanediols have been used in household and cosmetic products for a long time as solvents [1], cryoprotectors [2], moisturizers [3], and viscosity modifiers [1] [4]. Because of low toxicities and good antimicrobial activities of 1, 2-alkan- ediols, they have gradually been replaced for the traditional preservatives such as How to cite this paper: Dora, S.K. (2017)
Real Time Recrystallization Study of 1, 2 Dodecanediol on Highly Oriented Pyrolytic Graphite (HOPG) by Tapping Mode Atomic Force Microscopy. World Journal of Nano Science and Engineering, 7, 1-15.
https://doi.org/10.4236/wjnse.2017.71001
Received: February 26, 2017 Accepted: March 28, 2017 Published: March 31, 2017
Copyright © 2017 by author and Scientific Research Publishing Inc. This work is licensed under the Creative Commons Attribution International License (CC BY 4.0).
parabens, potassium sorbate, sodium benzoate, and formaldehyde-releasing compounds in cosmetic products [1] [5]. Diols with short aliphatic chains have been known to exhibit antimicrobial activities, depending on their chain length and the position of the hydroxyl groups [1] [6] [7]. On the other hand, long chain alkane diols (–OH group at different positions) are used as biomarkers [8]. They are also an important constituent in plant cuticular waxes [9] [10] [11]. 1, 2 dodecanediol otherwise known as lauryl glycol (LG) is a 12-carbon chain alkane with –OH groups at 1, 2 position. It has a variety of potential uses. For instance, it has been used to prepare lipophilic diamines and amino alcohols [12] which show activity against tuberculosis bacteria. It is also used as a reducing agent in the preparation of Fe(II), Co(II) and Ni(II) nanoparticles [13]. Freital et al. have demonstrated the importance of LG in the Ketalisation of ethyl levulinate re-sulting in a new class of biodegradable surfactants [14]. LG can also be found as one of the constituents in many cosmetic products used for skin [15]. Wilbur Johnson Jr and coworkers demonstrated the dermal (skin) absorption rate was up to 40% for lauryl alcohol [15] on pig skin. The surface epithelium of the skin of animal is nonpolar in nature. Therefore it is interesting to understand how the nonpolar surfaces affect the absorption of LG molecules and understanding their detailed absorption mechanism will ultimately help in preparing better skin cosmetic products. In addition, understanding of adsorption phenomenon at nano-level may also shed new light on the efficacy of LG as a reducing agent. As a model substrate, HOPG was chosen for the study. HOPG is nonpolar and crystalline in nature and is one of the most widely used substrates for self- as-sembly studies for a wide variety of molecules [16] [17] [18] [19].
about their interaction with nonpolar substrates such as animal skin when used as constituents in cosmetics or their role as reducing agents.
2. Experiment
LG (C12H26O2, racemic mixture) was purchased from Sigma and used without further purification. AFM measurements were carried out in tapping mode us-ing an Agilent 5500 system under ambient conditions. PPP-NCH cantilevers from Nanosensors with a nominal resonant frequency of ~300 kHz were em-ployed for real time observation of crystal growth process. Imaging conditions used were a scan size of 4.9 × 4.9 µm2, a scan rate of 0.612 Hz, and an image size of 256 × 256 pixels. The set point was chosen close to the lowest limit possible and all measurements were performed at room temperature. Real time recrystal-lization process was observed by AFM, after applying a 10 µL droplet of appro-priate concentration (exact concentrations used are described in the result sec-tion) of lauryl glycol dissolved in chloroform on to the HOPG surface. The chloroform took ca. 30 seconds to evaporate from the surface leaving the LG molecules attached to the HOPG substrate. The substrate was then mounted to the AFM sample plate. The first image acquisition started as soon as possible af-ter the chloroform evaporation, typically afaf-ter ~10 minute. AFM images were taken consecutively from the same substrate area over a period of several hours applying a constant scan rate of 0.612 Hz. Height and length measurements of the grown crystals were made with the program WSxM (Version 4.0 Beta 8.3; Nanotec Electronica, Madrid, Spain). In addition, commercially available Pico image software from Keysight technology was used to determine the surface coverage of LG molecules.
3. Results
This section describes details of recrystallization process of LG molecules on HOPG substrate. Concentration of LG molecules in chloroform was also varied to understand whether it has any effect on recrystallization process.
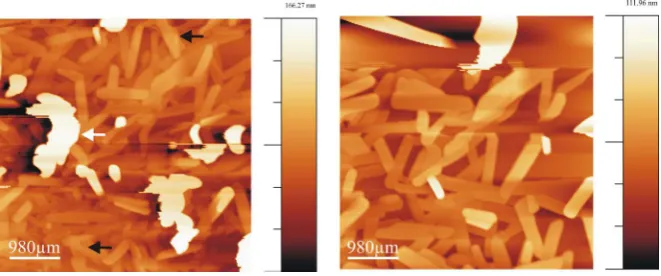
Figure 1. Series of AFM images showing LG molecule recrystallization on HOPG at different time intervals (~14 - 1063 min) after applying 0.4 mg/ml wax solution (chloro- form solvent) to the substrate. Figure 1(a) taken after ~14 minutes shows parallelogram -like-structures distributed over HOPG substrates. Figure 1(b)-(e) taken after ~29, ~170, ~575 and ~1063 min respectively demonstrate the details of growth and dissolution process of these structures (for details see texts in result section). Figure 1(f) shows the height profile across the black line in Figure 1(d) indicating each such layer is formed by the close packing of two vertically stacked LG molecules one over other. Figure 1(g) and
Figure 1(h) show the widths across the black and blue line in Figure 1(a). Size = 4.9 × 4.9 µm2, scan rate = 0.612 Hz, 256 lines/image.
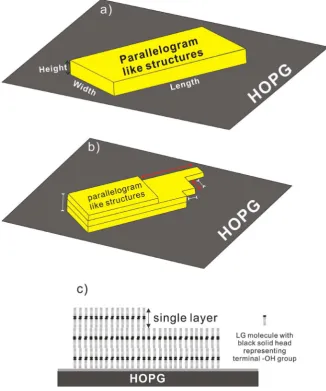
Figure 2. Schematics used to explain the texts in the result section for heights, widths and lengths of parallelogram-like-structures (a); to demonstrate the growth and dissolution directions (b); red arrows for growth and white arrows for dissolution and probable vertical arrangement of LG molecules within a single layer of the parallelogram-like- structure (c).
measured from the lowest point (assuming it to be the HOPG surface) to the highest point on these structures. Some of these structures also found to be overlapping on top of others. The heights of these structures with respect to the underlying structures were also found to be ~14 - 24 nm. Adding to these regu-lar parallelogram-like-structures, irreguregu-lar 3 dimensional (3D) structures (see white arrow in Figure 1(a)) are also observed. Next interesting observation is their arrangement on HOPG in a triangular fashion thus making angles of either 60˚ or 120˚ (see for example, the angles marked in Figure 1(a)). It also observed that some of the structures which grow over the underlying parallelogram-like- structures do not follow this peculiar triangular arrangement (see green arrow heads in Figure 1(a)).
changes on the HOPG surface. Few of the structures visible in Figure 1(a) dis-appeared while few others started to grow. For example, the one marked by yel-low arrow head in Figure 1(a) dissolved completely, marked by red arrow head dissolved partially whereas the one marked by blue head has grown in Figure 1(b). In other words, dissolution and growth seems to have occurred simulta-neously. Further, it is also found that the structures in direct contact with the HOPG substrate are dissolved at a faster rate compared to the ones which are not in direct contact with HOPG (can be viewed better in video 1). Growth was found to be strictly two dimensional in nature at this stage, which means these structures either grew along their length (black arrow in Figure 1(b)) or width (white arrow in Figure 1(b)) by the continuous accumulation of LG molecules. In addition, growth occurs only at the free end of these structures. The term free end refers to the end which is not restricted by the presence of any obstacle. For example, the structure marked by black arrow in Figure 1(b) has grown towards the black arrow whereas at its other end the growth is restricted by the presence of other parallelogram-like-structures. On the other hand, the average heights of remaining or continuously growing structures however remain unchanged at this stage which may indicate that molecules do not dissolve or gets added above/underneath these structures in the initial stage of recrystallization process. A word of caution here, since the dissolution process of some these structures at this stage was much faster than the AFM scanning speed employed, hence the intermediate stages of these processes were not possibly observed. This means it is difficult to draw any conclusion whether dissolution occurred in 2 or 3 di-mensions at this stage.
such layer (black line in Figure 1(d)) gives a height of ~3.5 nm (see Figure 1(f)). At about 18 hours the growth has completely ceased indicating a saturation point has reached (Figure 1(e)). No further morphological changes were ob-served even if the experiments were carried out up to 21 hours (data not shown). To further investigate whether increase in concentration of molecules has any effect on growth behavior, imaging was performed after applying 1mg/ml LG- solution in chloroform on to HOPG surface. A couple of images showing the in-itial and final stages of recrystallization process for 1 mg/ml LG in chloroform are shown in Figure 3. The entire image sequence as video is supplied as sup-plementary material (video 2). At higher concentration as expected, more paral-lelogram-like-structures were observed (Figure 3(a), ~14 min). Most of these structures lying directly on HOPG substrate are arranged in triangular fashion similar to those observed 0.4 mg/ml LG concentration whereas few others not in direct contact with HOPG substrate are oriented in random directions (see for example, black arrow marks in Figure 3(a)). Interestingly, even if number of parallelogram-like-structures are increased considerably at higher concentration however, their widths remain similar to those observed at 0.4 mg/ml concentra-tion i.e., between ~100 - 400 nm. In addition, an increase in irregular three di-mensional (3D) structures (marked by white arrow) also observed on top of these parallelogram-like-structures. With passage of time, dissolution/growth of some of these structures (including the 3D irregular structures) started to occur which exactly follow similar mechanism as discussed above for 0.4 mg/ml LG concentration. The recrystallization process is completely ceased at ~15 hours (Figure 3(b), for exact timing please refer to figure caption) and further waiting up to ~17 hours didn’t show any visible change on the surface (figure not shown). This time period of saturation of ~15 hours for 1mg/ml LG concentra-tion is slightly lower than for 0.4 mg/ml LG concentraconcentra-tion where saturaconcentra-tion oc-curred at ~18 hours. It is also important to note that there exists some thermal
drift for such long measurement time which is clearly visible by the shifting of positions of similar structures in both Figure 1 and Figure 3.
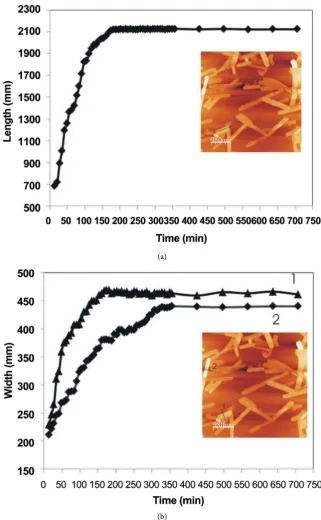
In order to have greater insight about the kinetics of growth along their length and width, the changes in length and width of a couple of such structures for the entire image series shown in video 1 are plotted separately vs. time (see Figure 4). Growth along its length presented in Figure 4(a) is measured along the dot-ted black line shown in the inset in Figure 4(a). Similarly change in widths plot-ted in Figure 4(b) is measured along the dotted black lines shown in the inset in Figure 4(b). Utmost care is taken to measure the change in length and width of the structures at the exact location for all the images shown in video 1. In the fi-nal stages of the plot several length and width points were skipped (since they represent same length or width) and only points at longer time intervals are plotted. The skipping of individual length and width for intermediate images definitely has no effect on the nature of the plot. These plots clearly demonstrate a logarithmic behavior for increase in length as well as width of these structures which means, the rate is faster in the first couple of hours and slowly decreases until it is completely ceased. Assuming that the structure has a length of 0 nm in the beginning (time = 0 min) and a final length of ~2 µm (time = 175 min), as shown in the plot in Figure 4(a), the average growth rate was calculated to be roughly ~11 nm/minute (scan rate 0.612 Hz, 256 lines/image). The term “at the beginning” refers to the starting point of recrystallization which was not ob-served in the experiment as it normally takes few minutes for mounting the sample and first image acquisition in AFM experiment which was ~14 minutes in this particular experiment. Following the same principle, the average growth rate for width was measured to be ~1.5 nm/minute. The above measured values are just the average values for the entire process whereas the actual recrystalliza-tion process is irregular. This means growth rate is faster in first couple of hours and then slowed down until saturation has reached. It is important to emphasize here that, the main objective of these plots are to show the growth behavior of the structures rather than their error free measurement of individual length/ width. From these plots it is also concluded that, length of these structures in-creased at a faster rate compared to their width.
(a)
[image:9.595.210.532.69.590.2](b)
Figure 4. Plots show increase in length (Figure 4(a)) for the structure marked by dotted black line in Figure 4(a) inset and widths (Figure 4(b)) for the structures marked by dotted black lines in Figure 4(b) inset with respect to time for all the images shown in video 1. Great care was taken to measure the length and widths at the exact location for all the images. A logarithmic change in growth rate both along length and width is observed for these structures.
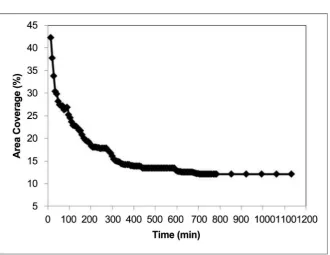
Figure 5. The plot shows the dissolution of parallelogram-like-structures (for all the images in video 1) which also follows a logarithmic behavior. Pico image post processing software’s threshold option was used to determine the individual surface coverage of all the images in video 1 at different time intervals.
similar plots were also observed for other videos (data not shown). The average dissolution rate in percentage was measured to be 0.078%/min assuming the ini-tial surface coverage (at time t = 0 min) to be 42.2% and final (saturated) cover-age to be 14.2% (at time t = 357 min).
4. Discussion
from all three directions which is indeed the case in the observed measurements. A layer height of ~3.5 nm observed duringlayer by layer dissolution (see Figure 1(d)) process. Assuming the length of LG molecule to be ~1.8 nm (12-carbon chain dodecane has a chain length of 1.8 nm [28]), it is proposed that each dissolved layer is formed initially by the vertical close packing of 2 LG molecules with their length projected vertically (see Figure 2(c)). To understand the orientation of terminal –OH groups a high resolution study is currently underway. Although dissolution occurred from the very beginning of AFM imaging, however, the layer by layer dissolution was observed only after several hours of experiment. This can be attributed to the logarithmic dissolution behavior, which means the faster dissolution processes in the beginning could not be captured with the slow AFM scanning rate. As the dissolution process gets slower, the applied AFM scanning rate became fast enough to capture individual layer dissolution process. Another important aspect of dissolution process is the systematic removal of layers starting from top to bottom in a single parallelogram-like-structure. AFM tip based surface etching [29] could not explain this phenomenon. First, if tip etching is responsible for this process then most of the structures which are grown over the other parallelogram-like- structures would get etched first but in the current case the structures attached directly to HOPG surface got dissolved first. Secondly, AFM tip etching being a slow process, the layer by layer etching would have been observed much earlier during scanning which is clearly not the case in these experiments. In addition, we have also employed tapping mode where lateral force responsible for tip based etching is practically nonexistent. Thus, one hypothesis to explain the dissolution from top layer would be the top layer is less stable due to its one sided binding to the layer underneath compared to other layers which bind themselves on both sides and hence dissolution occurred from top surface. What drives the diffusion of LG molecules to undergo dissolution/growth? Most probably the diffusion is driven by the solvent (chloroform) molecule which is further aided by the temperature. Although most of the chloroform got evaporated within 30 seconds, it is believed that some of the chloroform (solvent) molecules that are trapped between the LG molecules can help in the diffusion process. As the time progressed, these trapped solvent molecules also started to evaporate and hence the growth/ dissolution started to slow down until no further change on the HOPG surface is observed. Factors such as temperature assisted diffusion processes is well documented [30] [31] [32] but it is believed to have played a minor role in these experiments. The reason being with increase in temperature (for example, laser heating of cantilever), the rate of diffusion and hence the growth/dissolution process should increase but exactly the opposite trend i.e., a decrease in growth/dissolution rate with respect to time is observed here. This clearly supports that temperature has minor effect in the crystallization processes presented here.
evapo-rated from the surface because the flash point of LG molecules is ~134.3˚C which is considerably higher than the temperature at which experiments are performed. Just to recall, all the experiments are performed at room temperature (20˚C - 24˚C). It is also very unlikely that material just jumps outside the scan-ning area within few minutes of scanscan-ning that exact area. So, the only probable explanation would be the LG molecules dissolve to form a thin film on the HOPG surface. If that is the case, then why this parallelogram-thin film conver-sion process occurred? One probable explanation would be the heteroepitaxial growth on HOPG. To lower their energy, the vertical standing LG molecules will prefer to change their orientation which is aided by the exact carbon-carbon- bond matching between HOPG and LG molecules. It is worth mentioning that molecules similar to LG i.e., for 1, 12 dodecanediol, it is already demonstrated by using scanning tunneling microscopy (STM) that the carbon chain lies parallel to the HOPG surface [27]. Once the film started to form, this process is further enhanced by the nucleation theory which states that large islands will grow at the expense of small islands [33] (in this case the parallelogram-like-structures). If the given hypothesis works, then the question arises why some structures also grew simultaneously? This is explained as follows: the areas near these grown structures probably got saturated with a thin film and the incoming material from nearby areas has nowhere to go but to get added to the existing structures. However, this is merely a speculation and no evidence is available at his moment to explain this phenomenon. The ceasing of dissolution observed after several hours can be attributed to the formation of a saturated thin film on the HOPG surface and hence the remaining materials remain as parallelogram-like-structures. It is found that this inter-conversion of parallelogram-like-structures to thin film is a very slow process and often takes hours to reach equilibrium irrespective of concentration. However, this process is concentration dependent as it took less time for 1 mg/ml LG solution to reach saturation point (~15 hours) compared to 0.4 mg/ml LG solution (~18 hours). This makes sense, as availability of more number of LG molecules at higher concentration means more number of mole-cules can diffuse at a given time to form the thin film and hence film saturation can occur comparatively earlier.
The random variation of length of parallelogram-like-structures at the initial stage at different positions in Figure 1(a) can be attributed to the availability of LG molecules in their nearby capture zones when recrystallized from the chlo-roform solution. On the other hand, the distinct widths between 100 - 400 nm (not combining to give structures of higher width) at the initial stage must be due to the inherent property of their molecular architectures. The maximum width of ~500 nm of such structures at the saturation point must be related to the fact that, once HOPG surface gets saturated with the thin film the incoming LG molecules have nowhere to go but to get accumulated to the existing paralle-logram-like-structures even though it is not energetically favorable.
5. Conclusion
HOPG surface for the first time at the molecular level. Recrystallization involved both growth and dissolution of parallelogram-like-structures following a loga-rithmic behavior. While growth occurred along two dimensions, dissolution was found to be 3 dimensional in nature. Saturation time period for recrystallization was found to be concentration dependent. It is believed, detailed understanding of such processes at the nanoscale on nonpolar substrates like HOPG will act as a model to understand their absorption behavior on skins which are also non-polar in nature and will create curiosity among cosmetologists to explore the absorption behavior of other skin cosmetic constituents by using AFM. Under-standing the absorption phenomena of such constituents at the nano level will ultimately help designing more effective cosmetic products in future.
Acknowledgements
I would like to acknowledge Keysight Technologies Private Limited for provid-ing me a chance to work as an application scientist and performprovid-ing this work in their demo lab.
References
[1] Pillai, R., Schmaus, G., Pfeiffer, A., Lange, S. and Trunet, A. (2008) 1,2-Alkanediols for Cosmetic Preservation. Cosmetics and Toiletries, 123, 53-64.
[2] Paynter, S.J., O’Neil, L., Fuller, B.J. and Shaw, R.W. (2001) Membrane Permeability of Human Oocytes in the Presence of the Cryoprotectant Propane-1,2-Diol. Fertility Sterility, 75, 532-538. https://doi.org/10.1016/S0015-0282(00)01757-X
[3] Sagiv, A.E., Disktein, S. and Ingeber, A. (2001) The Efficiency of Humectants as Skin Moisturizers in the Presence of Oil. Skin Research and Technology, 7, 32-35. https://doi.org/10.1034/j.1600-0846.2001.007001032.x
[4] Sagitani, H.J. (1988) Formation of O/W Emulsions by Surfactant Phase tion and the Solution Behavior of Non-Ionic Surfactant System in the Emulsifica-tion Process.Journal of Dispersion Science and Technology, 9, 115-129.
https://doi.org/10.1080/01932698808943980
[5] Levy, S.B., Dulichan, A.M. and Helman, M. (2009) Safety of a Preservative System Containing 1,2-Hexanediol and Caprylyl Glycol. Cutaneous and Ocular Toxicology, 28, 23-24. https://doi.org/10.1080/15569520802636082
[6] Woodruff, J. (2012) Preserving Alternatives. Poucher's Perfumes, Cosmetics and Soaps, 10, 58-65.
[7] Akedo, M., Sinskey, A.J. and Gomez, R.J. (1977) Antimicrobial Action of Aliphatic Diols and Their Esters. Journal of Food Science, 42, 699-706.
https://doi.org/10.1111/j.1365-2621.1977.tb12582.x
[8] Morris, R.I. and Brassell, S.C. (1988) Long-Chain Alkanediols: Biological Markers for Cyanobacterial Contributions to Sediments. Lipids, 23, 256-258.
https://doi.org/10.1007/BF02535468
[9] Jetter, R., Riederer, M., Seyer, A. and Mioskowski, C. (1996) Homologous Long- Chain Alkanediols from Papaver Leaf Cuticular Waxes. Phytochemistry, 42, 1617- 1620. https://doi.org/10.1016/0031-9422(96)00180-X
[11] Jetter, R. (2000) Long-Chain Alkanediols from Myricaria germanica Leaf Cuticular Waxes. Phytochemistry, 55, 169-176.
[12] Júnior, C.O., le Hyaric, M., Costa, C.F., Corrêa, T.A., Taveira, A.F., Araújo, D.P., Reis, E.F., Lourenço, M.C., Vicente, F.R. and Almeida M.V. (2009) Preparation and Antitubercular Activity of Lipophilic Diamines and Amino Alcohols. Memórias do Instituto Oswaldo Cruz, 104, 703-705.
https://doi.org/10.1590/S0074-02762009000500006
[13] Naidek, K.P., Bianconi, F., da Rocha, T.C., Zanchet, D., Bonacin, J.A., Novak, M.A., Gracas Fialho Vaz, M.D. and Winnischofer, H. (2011) Structure and Morphology of Spinel MFe2O4 (M = Fe, Co, Ni) Nanoparticles Chemically Synthesized from Hete-rometallic Complexes. Journal of Colloid and Interface Science, 358, 39-46. [14] Freitas, F.A., Licursi, D., Lachter, E.R., Galletti, A.M.R., Antonetti, C., Brito, T.C.
and Nascimento, R.S.V. (2016) Heterogeneous Catalysis for the Ketalisation of Ethyl Levulinate with 1,2-Dodecanediol: Opening the Way to a New Class of Bio- Degradable Surfactants. Catalysis Communications, 73, 84-87.
[15] Johnson Jr., W., Bergfeld, W.F., Belsito, D.V., Hill, R.A., Klaassen, C.D., Liebler, D., Marks Jr., J.G., Shank, R.C., Slaga, T.J., Snuder, P.W. and Andersen, F.A. (2012) Safety Assessment of 1,2-Glycols as Used in Cosmetics. International Journal of Toxicology, 31, 147S-168S. https://doi.org/10.1177/1091581812460409
[16] Chen, Q., Yan, H., Yan, C., Pan, G., Wan, L., Wen, G. and Zhang, D. (2008) STM Investigation of the Dependence of Alkane and Alkane (C18H38, C19H40) Derivatives Self-Assembly on Molecular Chemical Structure on HOPG Surface. Surface Science, 602, 1256-1266.
[17] Yang, T., Berber, S., Liu, J., Miller, Glen P. and Tománek, D. (2008) Self-Assembly of Long Chain Alkanes and Their Derivatives on Graphite. The Journal of Chemical Physics, 128, Article ID: 124709. https://doi.org/10.1063/1.2841478
[18] Saiz-Poseu, J., Alcón, I., Alibés, R., Busqué, F., Faraudo, J. and Ruiz-Molina, D. (2012) Self-Assembly of Alkylcatechols on HOPG Investigated by Scanning Tunne-ling Microscopy and Molecular Dynamics Simulations. CrystEngComm, 14, 264- 271. https://doi.org/10.1039/C1CE06010D
[19] Jiang, X. and Lin, X. (2004) Atomic Force Microscopy of DNA Self-Assembled on a Highly Oriented Pyrolytic Graphite Electrode Surface. Electrochemistry Communi-cations, 6, 873-879
[20] Wang, H., Zhao, Y., Xie, Z., Wang, H., Wang, B. and Ma, Y. (2014) The Thermo-dynamic Characteristics of Organic Crystal Growth by Physical Vapor Transport: Towards High-Quality and Color-Tunable Crystal Preparation. CrystEngComm, 16, 4539-4545. https://doi.org/10.1039/c3ce42367k
[21] Matsushige, K., Hamano, T. and Horiuchi, T. (1995) Atomic Force Microscopy Observation of the Epitaxial Growth of Organic Molecules. Journal of Crystal Growth, 146, 641-644.
[22] Cubillas, P., Stevens, S.M., Blake, N., Umemura, A., Chong, C.B., Terasaki, O. and Anderson, M.W. (2011) AFM and HRSEM Investigation of Zeolite A Crystal Growth. Part 1: In the Absence of Organic Additives. The Journal of Physical Che-mistry C, 115, 12567-12574. https://doi.org/10.1021/jp2032862
[23] Onuma, K., Ito, A., Tateishi, T. and Kameyama, T. (1995) Surface Observations of Synthetic Hydroxyapatite Single Crystal by Atomic Force Microscopy. Journal of Crystal Growth, 148, 201-206.
[25] Plomp, M., van Hoof, P.J.C.M. and van Enckevort, W.J.P. (2000) AFM-Induced Melt Growth on n-Paraffin Crystals. Surface Science, 448, 231-249.
[26] Dora, S.K. and Wandelt, K. (2011) Recrystallization of Tubules from Natural Lotus (Nelumbo nucifera) Wax on a Au(111) Surface. Beilstein Journal of Nanotechnolo-gy, 2, 261-267. https://doi.org/10.3762/bjnano.2.30
[27] Claypool, C.L., Faglioni, F., Goddard III, W.A., Gray, H.B., Lewis, N.S. and Marcus, R.A. (1997) Source of Image Contrast in STM Images of Functionalized Alkanes on Graphite: A Systematic Functional Group Approach. The Journal of Physical Che-mistry B, 101, 5978-5995. https://doi.org/10.1021/jp9701799
[28] Lu, J.R., Thomas, R.K., Binks, B.P., Fletcher, P.D.I. and Penfold, J. (1995) Structure and Composition of Dodecane Layers Spread on Aqueous Solutions of Dodecyl- and Hexadecyltrimethylammonium Bromides Studied by Neutron Reflection. The Journal of Physical Chemistry, 99, 4113-4213. https://doi.org/10.1021/j100012a036 [29] Magonov, S.N. and Whangbo, M. (2008) Surface Analysis with STM and AFM:
Ex-perimental and Theoretical Aspect of Image Analysis. Wiley Publications, Hoboken. [30] Nakamura, K., Shimzu, S., Umemoto, S., Thierry, A., Lotz, B. and Okui, N. (2008) Temperature Dependence of Crystal Growth Rate for α and β Forms of Isotactic Polypropylene. Polymer Journal, 40, 915-922.
https://doi.org/10.1295/polymj.PJ2007231
[31] Fernandez, A.C. and Phillies, G.D.J. (1983) Temperature Dependence of the Diffu-sion Coefficient of Polystyrene Latex Spheres. Biopolymers, 22, 593-595.
https://doi.org/10.1002/bip.360220203
[32] Akcasu, A.Z. (1981) Temperature and Concentration Dependence of Diffusion Coefficient in Dilute Solutions. Polymer, 22, 1169-1180.
[33] Schmelzer, J.W.P. (2005) Nucleation Theory and Applications. Wiley-VCH, Hobo-ken. https://doi.org/10.1002/3527604790
Appendix
https://www.dropbox.com/s/fiof1ivee8c3sgi/Video1.mov?dl=0 https://www.dropbox.com/s/rtibad8l64pj37n/Video2.mov?dl=0
Video 1. LG molecule recrystallization on HOPG from 0.4 mg/ml chloroform LG solution. Only trace images are used for making videos. Size = 4.9 × 4.9 µm, scan rate = 0.612 Hz, 256 lines/image.
Submit or recommend next manuscript to SCIRP and we will provide best service for you:
Accepting pre-submission inquiries through Email, Facebook, LinkedIn, Twitter, etc. A wide selection of journals (inclusive of 9 subjects, more than 200 journals)
Providing 24-hour high-quality service User-friendly online submission system Fair and swift peer-review system
Efficient typesetting and proofreading procedure
Display of the result of downloads and visits, as well as the number of cited articles Maximum dissemination of your research work