Materials at High Temperatures
An Evaluation of the Capability of Data Conversion of Impression Creep Test
--Manuscript
Draft--Manuscript Number: MHT521
Full Title: An Evaluation of the Capability of Data Conversion of Impression Creep Test
Article Type: Special Issue Article
Keywords: Impression creep test; P91; P92; CrMoV; Steel; Conversion parameters Corresponding Author: Bianca Cacciapuoti
University of Nottingham UNITED KINGDOM Corresponding Author Secondary
Information:
Corresponding Author's Institution: University of Nottingham Corresponding Author's Secondary
Institution:
First Author: Bianca Cacciapuoti
First Author Secondary Information:
Order of Authors: Bianca Cacciapuoti
Wei Sun
Graham McCartney Andy Morris Scott Lockyer Norhaida Ab Razak Catrin Davies Jeff Hulance Order of Authors Secondary Information:
Abstract: High temperature power plant components are now working far beyond their operative designed life. Establishing their in-service material properties has become a matter of significant concern for power generation companies. Advantages for the assessment of creep material properties may come from miniature specimen creep testing
techniques, like impression creep testing method, which can be treated as a quasi-static non-destructive technique and requires a small volume of material that can be scooped from in-service critical components, and can produce reliable secondary creep data.
This paper presents an overview of impression creep testing method to highlight the capability in determining the minimum creep strain rate data by use of conversion relationships that relates uniaxial creep test data and impression creep test data. Stepped-load and stepped-temperature impression creep tests are also briefly described. Furthermore, the paper presents some new impression creep test data and their correlation with uniaxial data, obtained from P91, P92 and ½CrMoV steels at different stresses and temperatures. The presented data, in terms of creep strain rate against the reference uniaxial stress, are useful for calibration of impression creep testing technique and provide further comparative results for the evaluation of the reliability of the method in determining secondary creep properties.
Additional Information:
An Evaluation of the Capability of Data Conversion of Impression Creep
Test
B. Cacciapuoti1*, W. Sun1, D.G. McCartney1, A. Morris2, S. Lockyer3, N. Ab Razak4,
C.M. Davies4, J. Hulance5
1 Department of Mechanical, Materials and Manufacturing Engineering, University of Nottingham, Nottingham, NG7 2RD, UK
2 EDF Energy (UK), Coal Gas and Renewables, Central Technical Organisation, Barnwood, Gloucester GL4 3RS UK
3 Uniper Technologies Limited, Technology Centre, Ratcliffe-on-Soar, Nottingham, NG11 0EE, UK 4 Department of Mechanical Engineering, Imperial College London, London SW7 2AZ, UK 5 RWE Generation SE, RWE npower, Moredon, Swindon, SN2 2NN, UK
Abstract
It is common that high temperature power plant components are now working far beyond their operative
designed life. Therefore, establishing their in-service material properties has become a matter of
significant concern for power generation companies. Advantages for the assessment of creep material
properties may come from miniature specimen creep testing techniques, such as impression creep
testing method, which can be treated as a quasi-static non-destructive technique and requires a small
volume of material that can be scooped from in-service critical components, and can produce reliable
secondary creep data.
This paper presents an overview of impression creep testing method to highlight the capability in
determining the minimum creep strain rate data by use of conversion relationships that relates uniaxial
creep test data and impression creep test data. Stepped load and stepped temperature impression creep
tests are also briefly described. Furthermore, the paper presents some new impression creep test data
and their correlation with uniaxial data, obtained from P91, P92 and ½CrMoV steels, and a
31-year-aged ½CrMoV steel, at different stresses and temperatures. The presented data, in terms of creep strain
rate against the reference uniaxial stress, are useful for calibration of impression creep testing technique
and provide further comparative results for the evaluation of the reliability of the method in determining
secondary creep properties.
Keywords: Impression creep test; P91; P92; CrMoV; Steel; Conversion parameters
* Corresponding author. E-mail address [email protected]
1
Introduction
Manuscript Click here to download Manuscript
Manuscript_Cacciapuoti_et_al.docx
Establishing the remaining life of components operating at high temperatures is a major
concern for power plant utilities. In particular, repair ranking and replacement strategies require
acquisition of creep data of the in-service components. Although the characterisation of the full
creep curve of these materials can be accomplished by use of standard size uniaxial creep tests,
shortage of materials to be tested has led to the development of non-conventional creep testing
techniques, which include miniature creep test specimens. The latters can also be very useful
to investigate material creep behaviour of critical regions of power plant components,
including, for examples, welds with the heat affected zones and bends. Moreover, miniature
creep testing techniques can be treated as quasi-non-invasive methods and do not require weld
repair when samples are carefully removed, “scooped”, from in-service components as long as,
for example, the maximum excavation depth does not exceed 10% of the wall thickness of the
main steam pipe [1-3]. In the last two decades, researchers all over the world (USA, UK,
Europe, Japan and China) have developed and investigated these non-traditional techniques,
also trying to assess relevant Standards and Codes of Practice [4-7].
Among miniature specimen creep testing techniques only small punch creep test (SPCT) and
small two-bar creep test allow the full creep curve to be characterised, because the specimens
are taken to rupture [8, 9]. Despite this advantage, during small punch creep test, interaction of
several non-linearities, such as large deformations, large strains, non-linear material behaviour
and non-linear contact interactions between the specimen and the punch, induces a complex
multi-axial stress field in the specimen that also evolves in time [10]. This affects the SPCT
fracture mechanism and introduces several challenges into the development of a robust
correlation to convert SPCT data into respective standard uniaxial creep test data [11]. Another
major concern is the non-repeatability of the testing method, since the experimental results
depend on the set up geometry [6]. With two-bar creep testing technique, the pins must be made
of a material with much higher (depending on the size of the sample, the pin diameter and
thickness of uniform section) creep strength than that of the specimen, therefore a limitation
resides in the range of materials that can be potentially tested. Accurate secondary creep
properties are provided by small ring creep testing technique, but time-dependent geometric
correction functions to compensate for the effects of geometry changes during the deformation
process are needed [9, 12]. Impression creep testing method is easy to perform and it has shown
to be able to provide reliable secondary creep properties, particularly at relatively high stresses
and in the heat affected zones of welds [13]. Although specimens are not taken to rupture, the
technique has shown to be very suitable in power plant component life assessment [14].
A requirement all of the miniature creep testing techniques have in common is the need to
convert small specimen creep testing data to the corresponding uniaxial data. Conversion
relationships exist, except for the small punch creep test, for which a procedure to interpret the
experimental output is still under research [6, 15]. The aim of this paper is to evaluate the
reliability of impression creep testing technique, with particular attention to the conversion
parameters established so far. Secondary creep data, from the existing work, obtained by
impression creep tests, are presented for “standard-sized” specimen case and “sub-sized”
specimen case for a number of ductile materials used for power plant applications. Attention is
also paid to the potentiality of stepped-load and stepped-temperature impression creep tests.
Some new data obtained from a collaborative research programme for P91, P92 and 1/2CrMoV
steels are also included.
2
Impression Creep Test
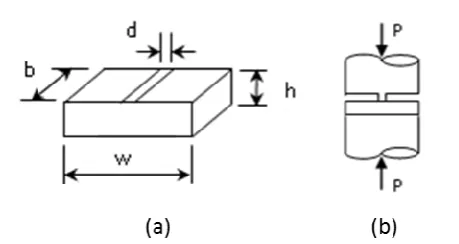
Impression creep testing technique consists of applying a steady load to a material by means
of a flat-ended rectangular indenter. Figure 1 (a) and Figure 1 (b) show the typical specimen
geometry and a schematic diagram of load arrangement, respectively, where d is the indenter
width, w, b and h are the width, the length and the thickness of the sample, respectively. The
recommended geometry dimensions are w = b 10mm, d 1mm, h 2.5mm [16]. Dimension
ratio and size effects that can affect the test output can be avoided if the recommended specimen
dimensions are chosen for the test [17, 18]. Also, bulk creep properties are obtained because
the contact area between the specimen and the indenter is large enough to cover more than
6-10 grains [13]. The test is generally isothermal and the load is constant with time. During the
test, the indenter displacement is measured, e.g. through a LVDT, and the output is represented
by creep displacement against time curve, which includes the primary and secondary stages.
Since the specimen is not taken to rupture, this test does not allow for the tertiary stage data of
the creep behaviour to be acquired. The technique has been proved reliable in determining
secondary creep properties of the tested material and Monkman-Grant’s relationship can be
used to evaluate the component time to failure [19].
Figure 1. (a) Impression creep test specimen and (b) schematic diagram showing the specimen loading arrangement, adapted form ref. [16].
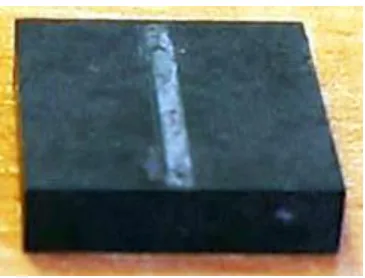
During an impression creep test the deformation of the specimen is strongly localised in the
immediate vicinity of the indenter. Figure 2 shows a typical tested specimen of a cast
1/2CrMoV.
[image:6.595.184.414.358.480.2]Figure 2. Typical tested specimen of a cast 1/2CrMoV.
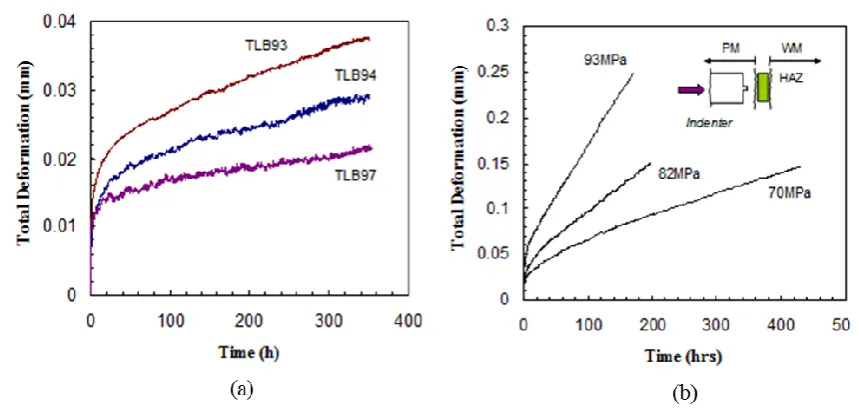
Figure 3 (a) shows impression deformations with time at 90 MPa and 600 °C, obtained from
three different ex-service 1/2CrMoV steam pipe samples (TLB93, TLB94, TLB97) [18].
Figure 3 (b) presents impression deformations of the heat affected zone (HAZ) of a P91 weld
at 650 oC, subjected to steady loading from the parent material side. These are typical
deformation creep curves from an impression creep test, from which the two regions of primary
and secondary creep can be easily identified. In fact, during an impression creep test, the
specimen is subjected to compression, while small deformations take place and there is no
crack development. During a uniaxial creep test, the necking of the specimen leads to an
increase in stress and strain. When the uniaxial creep test is carried out at constant stress, by
means of load feedback, the stress do not increase with the increasing necking and the uniaxial
specimen experiences an acceleration in the creep rate due to the propagation of micro-cracks
(e.g. inter-granular cavitation damage), which actually characterize the tertiary creep regime of
the uniaxial specimen.
The slight fluctuations in the data observed are mainly caused by temperature variations within
the furnace and laboratory. However, it can be seen that these variations are typically well
within about ±1 μm [18].
Figure 4 presents a comparison between minimum creep strain data obtained by uniaxial creep
tests and conveniently converted minimum creep strain rate (MSR) data obtained by
impression creep tests for 316 stainless steel at 600 °C and 2¼Cr1Mo weld metal at 640 °C
samples [18]. Typically, minimum creep strain rates data from impression and unixial creep
[image:8.595.85.515.203.409.2]tests of a given materal lie on the same straigth line, on a log-log scale.
Figure 3.(a) Impression deformations with time at 90 MPa and 600 °C obtained from three different ex-service 1/2CrMoV steam pipe samples (TLB93, TLB94, TLB97), from ref. [18], and (b) impression deformations of the HAZ of a P91 weld at
650 oC, subjected to steady loading from the parent material side, from ref. [18].
Figure 4. Minimum creep strain rate data for 316 stainless steel at 600 °C and 2¼Cr1Mo weld metal at 640 °C,
obtained from uniaxial and impression creep tests, from ref. [18].
3
Theoretical Background
3.1 Reference Stress Approach
[image:8.595.166.418.463.658.2]Since the stress state of the impression creep specimen beneath the indenter is multi-axial,
conversion is needed to correlate the impression creep test data to uniaxial creep test data. For
ductile materials that obey Norton’s creep law, the reference stress method is usually used for
data conversion [20, 21]. The uniaxial form of Norton creep law is expressed by equation (1),
where A and n are material constants that depend on the test temperature, σ is the applied stress
and ε̇ssc is the creep strain rate in the steady state.
𝜀̇𝑠𝑠𝑐 = 𝐴𝜎𝑛 (1)
The aim of using the reference stress method here is to find two reference parameters, η and β,
that allow a relationship to be established between the equivalent uniaxial stress, σref, and the
stress applied during a non-conventional creep test, σnom, and to establish a relationship
between the creep strain rate in the steady state of the uniaxial test and the creep displacement
rate Δ̇𝑐𝑠𝑠, obtained by a non-traditional creep test. Δ̇𝑠𝑠𝑐 is a function of the creep material
properties, of the specimen geometry and σnom, which can be expressed as in equation (2).
Δ̇𝑐𝑠𝑠 = 𝑓
1(𝑛)𝑓2(𝑑𝑖𝑚𝑒𝑛𝑠𝑖𝑜𝑛𝑠)𝐴𝜎𝑛𝑜𝑚𝑛 (2)
An equivalent gauge length of the sample, EGL, can be defined as in equation (3), where η is
the reference parameter, material independent and non-dimensional constant, such that the ratio
𝑓1(𝑛)/𝜂𝑛 does not vary with n. Since the ratio 𝑓1(𝑛)/𝜂𝑛 and 𝑓2(𝑑𝑖𝑚𝑒𝑛𝑠𝑖𝑜𝑛𝑠) do not depend
on n, the equivalent gauge length is also constant with n.
𝐸𝐺𝐿 =𝑓1(𝑛)
𝜂𝑛 𝑓2(𝑑𝑖𝑚𝑒𝑛𝑠𝑖𝑜𝑛𝑠)
(3)
If s is a characteristic dimension of the specimen, for example a length, the reference parameter
β can be expressed as in equation (4). β is also independent of n.
𝛽 =𝐸𝐺𝐿
𝑠
(4)
The relationships for Δ̇𝑠𝑠𝑐 and ε̇ssc are so obtained and here reported in equations (5) and (6).
Δ̇𝑐𝑠𝑠 = 𝐸𝐺𝐿 𝐴𝜎
𝑛𝑜𝑚𝑛 = 𝛽𝑠𝐴𝜎𝑛𝑜𝑚𝑛 = 𝛽𝑠 ε̇ssc (𝜎𝑟𝑒𝑓) (5)
ε̇ssc (𝜎𝑟𝑒𝑓) = 𝐴𝜎𝑟𝑒𝑓𝑛 , 𝜎𝑟𝑒𝑓= 𝜂𝜎𝑛𝑜𝑚 (6)
3.2 Conversion Relationships for Impression Creep Test
For the specific case of impression creep testing technique with a rectangular indenter, the
nominal stress is the mean indenter pressure, 𝑝̅ given by the ratio between the applied load, P,
and the contact area, as expressed in equation (7), where b is the length of the specimen and d
the width of the indenter. Thus, the reference stress is expressed as in equation (8).
𝑝̅ = 𝑃
𝑏𝑑 (7)
𝜎𝑟𝑒𝑓 = 𝜂𝑝̅
(8)
If the load-line impression displacement in the steady state, Δ𝑐𝑠𝑠, is relatively small, compared
to the specimen thickness, the reference stress parameters, η and β, are assumed to be not
dependent on the impression depth and the minimum creep strain rate in the steady state is
given by equation (9) [17]. The reference parameter 𝛽′ can be determined by equation (10),
where the stress multiplier, α, is chosen arbitrarily (as η is the parameter which is set by
minimizing the variation of 𝛽′ with n). η is the value of α such that 𝛽′ is constant with n, thus
𝛽′(η) = β, as expressed in equation (11)[17]. Hence, the creep displacement rate, Δ̇𝑐𝑠𝑠, needs to
be known for different n values, e.g. by means of numerical analysis, in order for β to be
calculated [17].
𝜀̇𝑠𝑠𝑐 =
Δ̇𝑐𝑠𝑠
𝛽𝑑 (9)
𝛽′ = Δ̇𝑐𝑠𝑠
𝑑𝐴(𝛼𝑝̅)𝑛 (10)
𝛽′(𝜂) = 𝛽 = Δ̇𝑐𝑠𝑠
𝑑𝐴(𝜂𝑝̅)𝑛 (11)
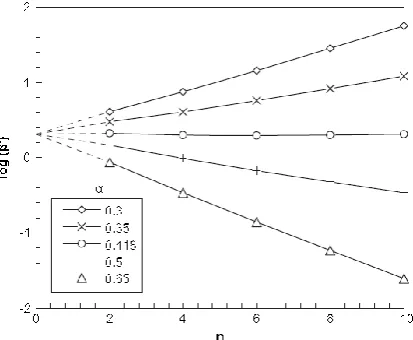
3.3 Determination of the Conversion Factors
The conversion parameters, η and β, for an impression creep test can be determined by finite
element (FE) analyses for different n values. Solutions have been provided by Hyde et al. for
a number of w/d and h/d values by performing several elastic-creep FE analyses [17]. By 2D
plane strain FE analysis, for the recommended geometry, “standard size”, w/d = 10 and h/d =
2.5, β has been assessed to be practically constant and equal to 2.051 if α = η = 0.418, as shown
in Figure 5, where log(𝛽′) is plotted against n [13]. By 3D FE analysis and for the same
geometry, β is practically constant and equal to 2.18 if α = η = 0.430[17]. The latter are the
recommended results in order to avoid errors of up 3% when converting the displacement rate
[image:11.595.193.400.415.585.2]of an impression creep test to the equivalent uniaxial minimum creep strain rate [17].
Figure 5. Variation of log(𝛽′) with n, obtained by 2D FE analysis, adapted from ref. [13].
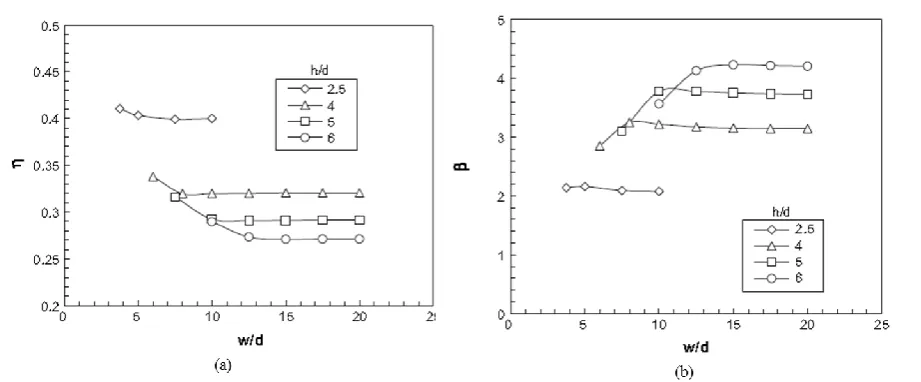
FE analysis also showed that, for a particular value of h/d, above a certain w/d value η and β
are practically independent of w/d. Also, the values of w/d over which η is independent of w/d
vary as h/d is varied, as it can be seen from Figure 6 (a) and Figure 6 (b), where η and β are
plotted against w/d for different values of h/d, respectively [17]. Generally, η decreases when
h/d increases, while β increases when h/d increases. When there is shortage of material and
lower w/d and h/d ratios must be used for impression creep test specimens (sub-sized
specimens), it is recommended, in order to achieve the highest accuracy, to use the η and β
-values for actual w/d and h/d values [17].
Figure 6. (a) Variationof η with w/d and h/d, and (b) variationof β with w/d and h/d from ref. [17].
4
Comparison of Uniaxial Creep and Impression Creep Test Data Output
Several uniaxial creep and impression creep tests data are presented below for different
materials, for both standard-sized and sub-sized specimens. Data from stepped-load and
stepped-temperature impression creep tests are also presented.
4.1 Standard Size Specimen Case
For the present work, several uniaxial creep and impression creep tests have been carried out
for a number of power plant materials, including P91, P92 and 1/2CrMoV steels, at a range of
temperatures from 575 to 650 °C, and stresses, from 90 to 200 MPa. The values of the
conversion parameters used to convert the displacement rates obtained by impression creep
tests to the corresponding uniaxial minimum creep strain rates are 0.43 and 2.18 for η and β,
respectively.
Figure 7 (a) shows impression deformations with time at different reference stresses and at 600
°C obtained for P91 steel and ½CrMoV steel, while Figure 7 (b) presents a comparison between
[image:12.595.76.537.155.346.2]the minimum creep strain data obtained by uniaxial creep tests and the conveniently converted
MSR data obtained by impression creep tests for the same materials.
Figure 7. (a) Impression deformations with time at different reference stresses and 600 °C and (b) minimum creep strain rate data at 600 °C, obtained for P91 steel and ½CrMoV steel.
Figure 8 (a) shows impression deformations with time at different reference stresses and at 575
°C obtained for an ex-service ½CrMoV steel and a cast ½CrMoV steel, while Figure 8 (b)
presents a comparison between the minimum creep strain data obtained by uniaxial creep tests
and the converted MSR data obtained by impression creep tests for the same materials.
Figure 8. (a) Impression deformations with time at different reference stresses and 575 °C and (b) minimum creep strain rate data at 575 °C, obtained for ex-service ½CrMoV steel and a cast ½CrMoV steel.
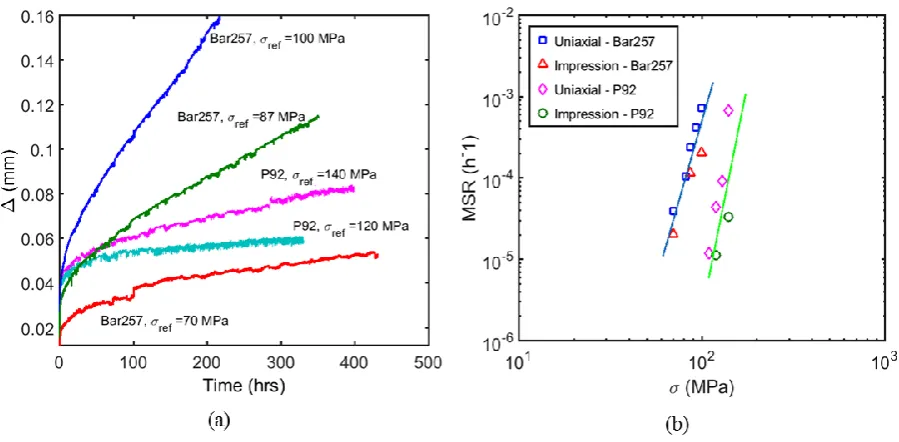
[image:13.595.75.525.136.340.2] [image:13.595.73.518.498.709.2]Figure 9 (a) shows impression deformations with time at different reference stresses and at 650
°C obtained for P91 Bar257/KA1200 and P92 steels, while Figure 9 (b) compares the minimum
creep strain data obtained by uniaxial creep tests with the converted MSR data obtained by
impression creep tests for the same materials. The deformation versus time curve related to the
specimen of P91 Bar257/KA1200 tested at 70 MPa shows a drastic increment in displacement
at about 100 hrs. This behaviour is mostly related to a grain effect than to
temperature
variations within the furnace and laboratory
because the MSR in the secondary statebefore 100 hrs is the same than the MSR after 100 hrs.
Figure 9. (a) Impression deformations with time at different reference stresses and 650 °C and (b) minimum creep strain rate data at 650 °C, obtained for P92 steel and P91 Bar257/KA1200 steel.
4.2 Sub-sized Specimen Case
A study on sub-sized specimen case has been carried out at the University of Nottingham [18]
in order to assess the consistency of data acquired during “sub-sized” impression creep tests
with respect to those collected during “standard size” impression creep tests. In particular, the
total deformations of the sub-sized specimens and of “standard size” specimens have been
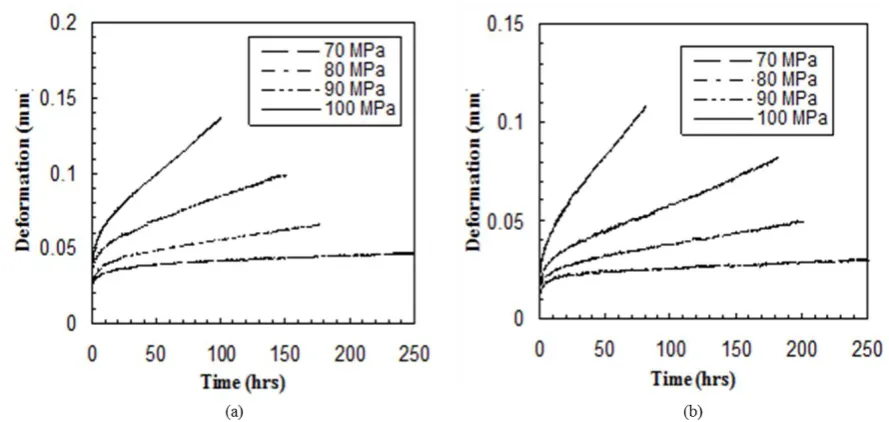
compared, as well as the minimum creep strain rates obtained by the two set of tests. Figure 10
(a) shows the deformation versus time curves obtained from 10102.5 mm specimens for a
[image:14.595.75.525.301.522.2]P91 steel at 650 oC, while Figure 10 (b) shows the deformation versus time curves obtained
from 661.5 mm specimens for a P91 steel at 650 oC [18]. Although a difference in the
deformation magnitudes occurs, the minimum creep strain rates obtained by the “sub-sized”
impression creep tests by using η = 0.43 and β = 2.18, are similar to those obtained by
“standard” impression creep tests [18]. This can be noted from Figure 11, that plotted the
minimum creep strain rates against stress obtained by uniaxial creep tests of the same material
at the same test temperature and stresses [18].
Figure 10. (a) Deformation versus time curves obtained from 10102.5 mm specimens for a P91 steel at 650 °C, and (b) deformation versus time curves obtained from 661.5 mm specimens for a P91 steel at 650 °C,
[image:15.595.77.522.269.480.2]from ref. [18].
Figure 11. Minimum creep strain rate data for the P91 steel at 650°C, obtained from impression tests with two sets of specimen dimensions, compared with those obtained from uniaxial creep tests, from ref. [18].
[image:15.595.179.407.545.720.2]4.3 Stepped Load and Stepped Temperature Impression Creep Testing
A previous work carried out at the University of Nottingham [18] has shown the reliability of
impression creep testing technique in determining secondary creep properties when non
isothermal and non iso-stress tests are performed. In particular, the results of minimum creep
deformation rate corresponding to a number of stress and temperature levels, from a single
impression creep test sample, can be obtained by stepped-load and stepped-temperature tests.
The former consists of applying an increasing or reducing load when a section of deformation
curve has been obtained from the previous step, while the temperature is held constant. The
stepped-temperature test, on the other hand, consists in applying a constant load, while the
temperature increases or decreases at suitable time intervals.
Figure 12 (a) shows the deformation curves for a 1/2Cr1/2Mo1/4V steel at 565 oC, obtained
from stepped-load impression creep tests [22]. The loading history is important in terms of
primary creep component. In fact, when the previous load level is lower, there is primary creep
under the new loading; while, when the previous load level is higher, there is no primary creep
under the new loading [18]. This does not affect the minimum creep strain rate associated with
each region of the presented creep deformation curves. As shown in Figure 12 (b), the
minimum creep strain rate data, obtained by stepped-load tests, with η = 0.4003 and β = 2.079
(from 2D FE analysis), and plotted against the applied stress, are in good agreement with the
MSRs resultant by uniaxial tests and practically the same as those obtained by impression creep
tests with no-loading histories [22]. It should be noted that the tests carried out with previous
lower loading histories leads to more accurate MSR data, with respect to tests with previous
higher loading histories, when compared to the corresponding single load tests [18].
Figure 12. (a) Deformation curves for a 1/2Cr1/2Mo1/4V steel at 565 °C, obtained from stepped-load impression creep tests, from ref. [18], and (b) minimum creep strain rate data for the 1/2Cr1/Mo1/4V steel at
565 °C, obtained from stepped-load impression tests and uniaxial creep tests, from ref. [22].
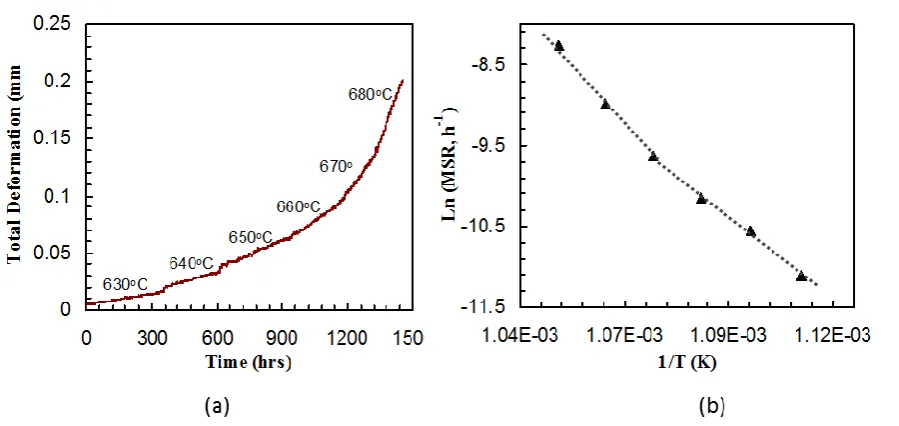
Figure 13 (a) shows the variation of total impression deformation with time for an ex-service
½CrMoV steam pipematerial (MSC9/MT572), subjected to stepped-temperatures, at 40 MPa,
while Figure 13 (b) shows the corresponding, converted, MSR data [18]. A comparison with
individual temperature test data is needed and, at this stage, only the activation energies can be
calculated by using a temperature-dependent Norton’s law [18]. The latter is expressed by
equation (12), where 𝐴′ and 𝑛′ are material constants, T is the temperature in K, R is the gas
constant, equal to 2 in this case, and Q is the activation energy. The Q values in the temperature
ranges of 630-655 °C and 655-680 °C are 20082 and 30259 cal/mole, respectively [18].
𝜀̇𝑠𝑠𝑐 = 𝐴′𝜎𝑛′
exp [−𝑄 𝑅𝑇⁄ ] (12)
[image:17.595.83.513.73.268.2]Figure 13.(a) Variation of total impression deformation with time and (b) minimum creep strain rates versus 1/T for an ex-service ½CrMoV steam pipe material (MSC9/MT572), subjected to stepped-temperatures, at 40
MPa, from ref. [18].
5
General Comments on the Conversion Relationships
The accuracy of the reference stress parameters, η and β, plays a critical role in converting
creep deformation rates obtained by impression creep tests to the corresponding minimum
creep strain rates. Although they do not vary with the material constant n, η and β are sensitive
to the specimen dimensions (see Figure 6 (a) and Figure 6 (b)), thus, care in calculating their
values must be taken when “non-standard-sized” samples are used. An important aspect to be
noted is that the material constant n depends on the test temperature. Therefore, since the
conversion parameters do not depend on n, they do not depend on the test temperature either.
This allows comparison of a large number of creep data of different materials tested at different
temperatures by using the same values for η and β.
Data provided in Section 4 show that converted minimum creep strain rates are, in general, in
good agreement with the corresponding uniaxial creep test data. On occasion, the converted
impression MSRs could vary by a factor of up to 10 time different from the corresponding
uniaxial minimum creep strain rates (see data of ex-service 1/2CrMoV steel in Figure 8 (b)).
The causes of this are likely to be partly related to the factors beyond the conversion
relationships. For example if the indenter is slightly misaligned with respect to the sample or
the length of the indenter is shorter than the specimen width, using the reference stress
parameters, which are derived from the idealised conditions, cannot give accurate results.
Experimental evidence of data collected so far, in fact, indicates the reliability of the conversion
relationships, even though a standard procedure for impression creep test and further
improvements are still needed. In particular, the conversion parameters are determined without
considering the geometry changes due to the indentation deformation during the test. Although
small deformations are involved during impression creep test, the indentation depth is not
constant and it differs from zero after a certain time. This may have a noticeable effect on the
conversion parameters when the impression creep deformation is relatively large, and therefore
requires further investigation.
Figure 14 shows the microstructure of a 316NL stainless steel sample near the contact area
with the indenter, where three regions can be identified [23]. The grains in the first region,
indicated as 1 in Figure 14, that is the closest to the indenter, are not significantly distorted,
due to the hydrostatic stress field [23, 24]. On the contrary, the grains in the second zone,
indicated as 2 in Figure 14, are stretched by shear deformation, while the grains in the third
region, indicated as 3 in Figure 14, that is the farthest from the indenter, do not show any
distortion, meaning that their shape is not affected by the test loading conditions [23, 24].
Although it can be concluded that plastic deformation occurs in the specimen areas only in the
vicinity of the indenter [23, 24], elastic-plastic-creep FE analysis could give reasonably
accurate results in establishing the conversion parameters with respect to the elastic-creep FE
analysis performed so far. In fact, the conversion parameters strongly depend on the accuracy
of the creep deformation rate in the steady state, especially if the applied load is so high to
induce relatively large deformation in the indentation area.
Figure 14. Microstructure of a 316NL stainless steel sample near the contact area with the indenter, adapted from ref. [23].
6
Discussion and Future Work
Impression creep testing technique is easy to perform and it has shown to be reliable in
providing secondary creep properties, e.g. conveniently converted minimum creep strain rate.
Creep data acquired by means of impression creep tests could be useful in a life assessment
model for power plant components. Collection of this data from the service-aged structures in
power plant companies can be a major concern for the utilities that, generally, in order to
perform conventional uniaxial creep tests, have to remove a large volume of material from out
of service components, which then need to be weld repaired, resulting in potentially large costs
for the power plant. Although a standard procedure still does not exist, a way forward to
overcome these problems and take away only a small amount of material from in-service
components could be considering impression creep testing technique as a valuable candidate
to, in part, substitute traditional creep tests.
The conversion relationships available so far are based on the hypothesis that the conversion
parameters do not vary during the steady state, because the change in specimen geometry is
small. Verifying this hypothesis, taking into account the variation of the indentation depth
during the test, is part of the future work of some of the present authors, since increasing the
accuracy of η and β would produce great benefits in data comparison. An investigation of the
effects of indenter misalignments during impression creep tests on the conversion parameters
and on test output is ongoing by some of the present authors.
Acknowledgments
This work is supported by the Engineering and Physical Sciences Research Council (Grant number: EP/K021095/1).
We would like to thank the Flex-E-Plant partners for their the valuable contributions: GE Power, Doosan Babcock Limited, Centrica plc., EDF Energy (West Burton Power) Limited, E.ON Technologies (Ratcliffe) Limited, Goodwin Steel Castings Limited, NPL Management Limited, R-MC Power Recovery Limited, RWE Generation UK plc., Scottish and Southern Energy (SSE) plc., Siemens Industrial Turbomachinery and TWI Limited.
We would also thank Mr Shane Maskill for his expert assistance in experimental testing during the development of this research.
7
References
1. Rolls-Royce Power Engineering Plc, Scoop Sampling – Extraction of Material Samples for Examination and Analysis. 2010.
2. Brett, S.J., Small Scale Sampling and Impression Creep Testing of Aged ½CrMoV Steam Pipework Systems, in Proc. of ECCC Conf. on Creep and Fracture in High Temperature Components - Design and Life Assessment. April 2009: Dübendorf, Switzerland. p. 1088-1096.
3. Klevtsov, I. and A. Dedov. Impact of Small Specimens Sampling on Durability of In-Service Power Plant Components. in SSTT. Proceedings of the 2nd International Conference SSTT: Determination of Mechanical Properties of Materials by Small Punch and Other Miniature Testing Techniques. October 2-4, 2012. Ostrava, Czech Rep.
4. GB/T 29459.1-2012 Small Punch Test Methods of Metallic Materials for In-Service Pressure Equipment-Part 1: General Requirements. General Administration of Quality Supervision, Inspection and Quarantine of China/ Standardization Administration of China, 2012.
5. GB/T 29459.1-2012 Small Punch Test Methods of Metallic Materials for In-Service Pressure Equipment-Part 2: Method of Test For Tensile Properties at Room Temperature. General Administration of Quality Supervision, Inspection and Quarantine of China/ Standardization Administration of China, 2012.
6. CEN WORKSHOP AGREEMENT, Small Punch Test Method for Metallic Materials,
CWA 15627: 2007, D/E/F. European Committee for Standardisation, December 2007. 7. Hyde, T.H., W. Sun, and J.A. Williams, Requirements for and Use of Miniature Test Specimens to Provide Mechanical and Creep Properties of Materials: a Review. Int. Mater. Rev., 2007. 52(4): p. 213-255.
8. Dobeš, F. and K. Milička, Application of Creep Small Punch Testing in Assessment of Creep Lifetime. Materials Science and Engineering: A: Properties, Microstructure and Processing, 2009. 510(11): p. 440-443.
9. Hyde, T.H. and W. Sun, A Novel, High Sensitivity, Small Specimen Creep Test. The Journal of Strain Analysis, 2009. 44(3): p. 171-185.
10. Dymáček, P. and K. Milička, Creep Small-Punch Testing and its Numerical Simulations. Materials Science and Engineering: A, 2009. 510–511: p. 444-449. 11. Hyde, T.H., M. Stoyanov, W. Sun, and C.J. Hyde, On the Interpretation of Results from
Small Punch Creep Tests. The Journal of Strain Analysis for Engineering Design, 2010. 45(3): p. 141-164.
12. Hyde, C.J., T.H. Hyde, W. Sun, S. Nardone, and E. De Bruycker, Small Ring Testing of a Creep Resistant Material. Materials Science and Engineering: A, 2013. 586(0): p. 358-366.
13. Hyde, T.H., W. Sun, and A.A. Becker, Analysis of the Impression Creep Test Method Using a Rectangular Indenter for Determining the Creep Properties in Welds.
International Journal of Mechanical Sciences, 1996. 38: p. 1089-1102.
14. Sun, W., T.H. Hyde, and S.J. Brett, Application of Impression Creep Data in Life Assessment of Power Plant Materials at High Temperatures. Proc. Instn Mech Engrs, Journal of Materials Design and Applications, 2008. 222(Part L): p. 175-182.
15. Cacciapuoti, B., W. Sun, and D.G. McCartney, A study on the evolution of the contact angle of small punch creep test of ductile materials. International Journal of Pressure Vessels and Piping, 2016. 145: p. 60-74.
16. Sun, W., T.H. Hyde, and S.J. Brett, Small Specimen Creep Testing and Application for Power Plant Component Remainig Life Assessment, in IRF2013 - 4th International Conference on Integrity, Reliability and Failure. 2013: Funchal, Portugal.
17. Hyde, T.H. and W. Sun, Evaluation of Conversion Relationships for Impression Creep Test at Elevated Temperatures. International Journal of Pressure Vessels and Piping, 2009. 86(11): p. 757-763.
18. Sun, W., T.H. Hyde, and S.J. Brett, Use of the Impression Creep Test Method for Determining Minimum Creep Strain Rate Data, in SSTT - Determination of mechanical properties of materials by small punch and other miniature testing techniques K. Matocha, R. Hurst, and W. Sun, Editors. 2012, OCELOT s.r.o.: Ostrava (CZ).
19. Monkman, F.C. and N.J. Grant, An Empirical Relationship Between Rupture Life and Minimum Creep Rate in Creep-Rupture Tests. Proc. ASTM, 1956. 56: p. 593–605. 20. MacKenzie, A.C., On the use of a Single Uniaxial Test to Estimate Deformation Rates
in Some Structures Undergoing Creep. International Journal of Mechanical Sciences, 1968. 10(5): p. 441-453.
21. Penny, R.K. and D.L. Marriott, Design for creep, ed. 2nd. 1995, London: Chapman and Hall.
22. Hyde, T.H. and W. Sun, Multi-step Load Impression Creep Tests for a 1/2Cr1/2Mo1/4V Steel at 565°C. Strain, 2001. 37(3): p. 99-103.
23. Naveena, V.D. Vijayanand, V. Ganesan, K. Laha, and M.D. Mathew, Evaluation of the Effect of Nitrogen on Creep Properties of 316LN Stainless Steel from Impression Creep Tests. Materials Science and Engineering: A, 2012. 552: p. 112-118.
24. Cortellino, F., Experimental and Numerical Investigation of Small Punch Creep Test. 2015, Ph. D Thesis, The Univeristy of Nottingham.