Development and Validation of LC-MS/MS Method for
the Quantification of Chiral Separated R-Bicalutamide
in Human Plasma
N. T. Ramarao1*, S. Vidyadhara2, R. L. C. Sasidhar2, B. Deepti3, R. Surendra Yadav4
1Alkem Research Center, Navi Mumbai, India
2Chebrolu Hanumaiah Institute of Pharmaceutical Sciences, Guntur, India
3Vignan Pharmacy College, Guntur, India
4GVK Biosciences, Hyderabad, India
Email: *[email protected]
Received November 28, 2012; revised December 30, 2012; accepted January 6, 2013
ABSTRACT
A simple, rapid, specific and precise liquid chromatography—tandem mass spectrophotometric (LC-MS/MS) method was developed and validated for the quantification of chiral separated R-bicalutamide from S-bicalutamide, in human plasma. Topiramate (TPM) was used as internal standard, added to plasma sample prior to extraction using t-butyl methyl ether (TBME). Chromatographic separation was achieved on CHIRALPAK AD-RH column (150 mm × 4.6 mm, 5 μm) with acteonitrile: 0.1% formic acid Buffer (50:50 v/v) as an isocratic mobile phase with a flow rate of 1.0 mL·min−1. Quantitation was performed by transition of 429.0 → 255.0 (m/z) for R-bicalutamide and 338.1 → 77.8 (m/z)
for topiramate. The lower limit of quantitation was 20 ng·mL−1 with a 100 μL plasma sample. The concentrations of
eight working standards showed linearity between 20 to 3200 ng·mL−1 (r2≥ 0.9990). Chromatographic separation was
achieved within 6 min, compared to the 15 min of previous methods. The average extraction recoveries of 3 quality control concentrations were 98.56% for R-bicalutamide and 92.42% for topiramate. The coefficient of variation was
≤15% for intra- and inter-batch assays. Therefore a rapid, specific and sensitive LC-MS/MS method for the quantifica- tion of R-bicalutamide in human plasma was developed and validated can be used in the bioequivalence study of this drug.
Keywords: LC-MS/MS; R-Bicalutamide; Topiramate; Validation; Human Plasma
1. Introduction
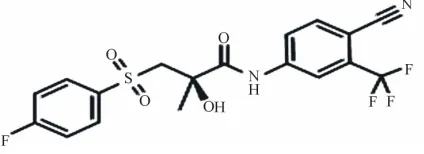
Bicalutamide, N-[4-cyano-3(trifluoromethyl) phenyl]-3- [(4-fluorophenyl sulfonyl)]-2-hydroxy-2-methyl propana- mide, is an oral, nonsteroidal, anti-androgen agent used for the treatment of prostate cancer. Bicalutamide treatment prevents the activation of the androgen receptor, which inhibits the growth of prostate cancer cells in patients with early, non-metastatic, or advanced prostate cancer [1,2]. Te structure of bicalutamide is sown in the Figure 1. Bicalutamide is a racemate that shows antiandrogenic activity in the R-enantiomer form, but little or no anti- androgenic activity in the S-enantiomer form. Literature survey described several methods for the determination of bicalutamide enantiomers in pharmaceuticals by liquid chromatography with ultraviolet detection (LC-UV) [3-6]. In addition, a previous exploratory study described bi- calutamide levels in human plasma with liquid chroma- tography and tandem mass spectrometry (LC-MS-MS).
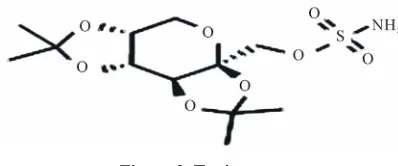
[image:1.595.319.531.645.722.2]The use of liquid chromatography with mass spectrome- try (LC-MS/MS) is now generally accepted as preferred technique for the determination of small molecules, me- tabolites and enantiomers in biological samples, since this technique is highly selective and sensitive. In the present work a new LC-MS/MS method for the chiral separation and quantification of R-bicalutamide in hu- man plasma with a short time of analysis (6 min) was developed using topiramate (Figure 2) as internal stan- dard and validated. The proposed method is suitable for comparing the pharmacokinetic profiles of different for-
Figure 1. Bicalutamide.
Figure 2. Topiramate.
mulations of bicalutamide.
2. Materials and Methods
2.1. Chemicals and Reagents
R-Bicalutamide, S-Bicalutamide and topiramate (assigned purity 99.9%) were procured from Symed Labs Ltd. Acetonitrile (HPLC grade) was purchased from Merck Millipore India Ltd. Milli-Q water from Millipore water system (Billerica, USA) was used throughout the ex- periments. Analytical grade formic acid and Tertiary- Butyl methyl ether (TBME) were obtained from Sigma Aldrich (Bangalore, India). Blank plasma was purchased from Kaveri blood bank (Hyderabad, India).
2.2. Equipment
The following equipments were used: vortex mixer CM- 101 plus (Remi Laboratory Instruments, Mumbai); ana- lytical balance Mettler Toledo® model XS 205 (Greifen-
see, Switzerland); refrigerated centrifuge 5702 R (Ep- pendorf India Limited, Chennai); Analysis was carried on Agilent (Santa Clara, CA, USA) 1200 series HPLC coupled with triple quadrupole mass spectrometer (MS/ MS) API 3200 (Applied Biosystems/AB Sciex).
2.3. Chromatographic and Mass Spectrometry Conditions
Samples were separated on a CHIRALPAK AD-RH column (150 × 4.6 mm, 5 μm) Daicel Chiral Technolo- gies (India) Pvt. Ltd.). The column temperature was set at 40˚C. The mobile phase was acetonitrile: 0.1% formic acid in water (50:50 v/v) as an isocratic mobile phase with a flow rate of 1.0 mL·min−1 and total run time was 6
min. Analysis was performed in negative electro spray ionization mode. The MS/MS detection was conducted by multiple reaction monitoring at a transition of 429.0
→ 255.0 (m/z) for R-bicalutamide and 338.1 → 77.8 (m/z) for the IS (Figures 3 (a) and (b)). For both R-bicalu- tamide and the IS, the source-dependent parameters were as follows: Gas 1 (nebulizer gas): 40psig; Gas 2 (heater gas): 50 psig; ion spray voltage: 4500 V; turbo heater temperature: 400˚C; interface heater: On; entrance poten- tial: 10V; collision activation dissociation gas: 6 psig. The optimized values for compound-dependent parame- ters were set as follows: declustering potential, collision
energy, and cell exit potential were set to: 75, 22, and 10 V for R-bicalutamide and 90, 30, and 10 V for the IS respectively. Quadrupoles 1 and 3 were maintained at unit mass resolution and the dwell time was set at 200 ms.
2.4. Standard and Quality Control (QC) Sample Preparation
R-bicalutamide, S-bicalutamide and the IS stock solu- tions were prepared in acteonitrile to a final concentra- tion of 1 mg·mL−1. The appropriate dilutions with ace-
tonitrile: Water (50:50 v/v) were prepared to produce 8 working standards of 64, 52, 38, 26, 18, 8, 0.8 and 0.4
μg·mL−1 of R-bicalutamide, 25 μg·mL−1 S-bicalutamide
sample prepared for adding to aqueous standard sample to find out the separation of R-bicalutamide and S-bi- calutamide, 5 μg·mL−1 sample of IS. Calibration stan- dards ranging from 20 to 3200 ng·mL−1 were prepared by
spiking 50 μL of the working standards into 1 mL of blank plasma. The QC samples were prepared with a different Bicalutamide Stock solution and diluted in blank plasma. The QC Bicalutamide concentrations in- cluded 20 ng mL-1 for lower limit of quantitation (LLOQ QC), 60 ng·mL−1 for low quality control (LQC), 840
ng·mL−1 for Middle quality control (MQC), 2400 ng·mL−1
for High quality control (HQC), and 4800 ng·mL−1 for
Dilution Integrity quality control (DIQC). All spiked plasma samples were stored at −70˚C.
2.5. Sample Preparation
Aliquots of frozen plasma samples (100 mL) were tha- wed at room temperature and thoroughly vortexes prior to extraction. The calibration curve consists of a blank sample (matrix sample processed without IS), a zero sample (matrix sample processed with IS), and eight non- zero samples covering the expected range, including LLOQ. To each calibration sample and quality control sample, 20 μL of IS dilution (5 μg·mL−1) was added fol-
lowed by 1.5 mL of Tertiary-butyl methyl ether (TBME) was added as an extraction solvent in a centrifuge tube. They were vortex well, and centrifuged at 4000 rpm for 5 min at 5˚C. The supernatant organic layer was transferred to a polyethylene tube and evaporated in nitrogen evapo- rator at 40˚C for 15 min. Then the residue was reconsti- tuted with 500 µL of mobile phase and vortex for 1 min from this 5 μL was injected into LC-MS/MS.
2.6. Data Collection and Integration
The data were gathered and processed with Analyst ver- sion 1.5 data collection and integration software on a Microsoft windows compatible computer.
2.7. Bioanalytical Method Validation
-MRM (2 pairs): 3.656 min from Sample 1 (CC-08A) of 13.wiff (Turbo Spray) Max. 1.6e5 cps.
429.0/255.0 338.1/77.8
Q1/Q3 Masses, amu 1.0e4
2.0e4 3.0e4 4.0e4 5.0e4 6.0e4 7.0e4 8.0e4 9.0e4 1.0e5 1.1e5 1.2e5 1.3e5 1.4e5 1.5e5 1.6e5
In
te
n
s
ity
, c
p
s
(a)
-MRM (2 pairs): 2.098 min from Sample 1 (CC-08A) of 13.wiff (Turbo Spray) Max. 6.7e5 cps.
429.0/255.0 338.1/77.8
Q1/Q3 Masses, amu 5.0e4
1.0e5 1.5e5 2.0e5 2.5e5 3.0e5 3.5e5 4.0e5 4.5e5 5.0e5 5.5e5 6.0e5 6.5e5
In
te
n
s
ity
, c
p
s
(b)
Figure 3. (a) MRM spectra of bicalutamide; (b) MRM spectra of topiramate.
method validation [7,8]. Assay performance was evalu- ated through determination of specificity, linearity, pre- cision, accuracy, recovery and stabilities. Specificity was investigated by analysing six drug-free volunteer plasma samples for the interference of endogenous compounds. The standard curve was obtained through analysis of calibration plot of peak area ratio (analyte to IS) versus
the corresponding drug concentrations. Linearity of the standard curve was evaluated using least-squares linear regression analysis with weighting of 1/x2. Intra- and
[image:3.595.55.538.80.625.2]analysed in a batch to establish the method’s precision (% relative standard deviation was calculated). Recovery was evaluated by comparing the observed concentration with the true value of spiked controls. The recoveries of R-Bicalutamide and topiramate were determined by com- paring the response of quality control plasma samples with the response of identical standards prepared in the mobile phase which did not undergo sample pre-treat- ment. The recovery was evaluated at all the three quality control concentration levels. Stability of R-Bicalutamide in plasma samples stored at −70˚C, in plasma samples after freeze-thaw cycles and in pre-treated plasma sam- ples(short term) was evaluated. Stability of R-Bicaluta- mide and topiramate were also evaluated in respective stock solution and in mobile phase in the processed sam- ples. Higher and lower quality control standards were used for evaluating the stability of spiked plasma sam- ples.
3. Result and Discussion
The main aim of this work was to develop a rapid, pre- cise, selective and sensitive LC-MS/MS method for the quantification of chiral separated R-bicalutamide from S-bicalutamide, in human plasma. Topiramate was used as internal standard. Chromatographic separation was achieved on Chiralpak AD-RH column with acteonitrile: 0.1% formic acid in water (50:50 v/v) as an isocratic mobile phase with a flow rate of 1.0 mL·min−1. Quantita-
tion was performed by transition of 429.0 → 255.0 (m/z) for R-bicalutamide and 338.1 → 77.8 (m/z) for topi- ramate.
3.1. Chromatography
Representative chromatograms of Aqueous Standard, drug free blank plasma, blank plasma with topiramate and LLOQ QC sample are given in Figures 4 (a)-(d) re- spectively.
3.2. Selectivity and Sensitivity
Six different lots of plasma were harvested under con- trolled conditions, extracted and analyzed using the de- veloped method. No interferences were observed at the retention times of R-Bicalutamide and topiramate. Sam- ples were compared with those obtained from an extract of a previously spiked plasma sample at LLOQ contain- ing R-Bicalutamide and topiramate. Representative chro- matograms of the blank human plasma and blank human plasma spiked with R-Bicalutamide and topiramate are given in Figures 4 (b) and (d) respectively. The effect of po- tentially interfering drugs (PID) (caffeine, nimesulide, paracetamol, ibuprofen and aspirin) on R-Bicalutamide analysis was performed by spiking PIDs at their ap-
proximately Cmax concentration in the MQC sample in
triplicate. Samples were prepared by spiking 25 μL of each interfering drug in the MQC containing R-Bicaluta- mide. Similarly blank samples also prepared by taking 100 μL of blank plasma and 25 μL of potentially inter- fering drug. The samples were quantified against calibra- tion curve. The back calculated concentrations of MQC sample spiked with PID were found to be within +15% of the actual concentration of the MQC sample. Hence the above mentioned PIDs have no effect on the R-Bica- lutamide analysis. The lowest limit of quantification for R-Bicalutamide was set at the concentration of the LLOQ QC 20.000 ng·mL−1. The precision and accuracy for R-
Bicalutamide at this concentration was found to be 5.21% and 98.82% respectively.
3.3. Goodness of Fit
The data of four precision and accuracy batches was subjected to goodness of fit analysis after taking the back calculated concentrations of calibration standards meet- ing the acceptance criteria by using 1/x and 1/x2 weigh-
ing. After performing the goodness of fit, 1/x2 was found
to be the best fit for regression.
3.4. Linearity
Linear calibration curves were plotted by using the par- tial least square method in which least square regression of quantities versus peak area ratio R-bicalutamide to IS with a weighting factor (1/x2) was utilized. R-bicaluta-
mide was linear in the range of 20 to 3200 ng·mL−1 with
a coefficient of determination greater than 0.99 (Table 1).
3.5. Precision and Accuracy
The precision of the assay was measured by the percent coefficient of variation over the concentration range of LLOQC, LQC, MQC and HQC samples respectively during the course of validation. The intraday and inter- day precisions were less than 10.00% for each QC level of R-bicalutamide. The accuracy, determined for QC samples, was within 10.00% for each QC level. The re- sults obtained are given in Table 2.
3.6. Recovery
Prepared 6 sets of recovery comparison samples by spik- ing 5 μL dilution of quality control samples (LQC, MQC, HQC) of R-bicalutamide, 20 μL of topiramate and 457
μL of mobile phase, representing 100% extraction and injected. The recovery comparison samples of R-bica- lutamide were compared against extracted samples of LQC, MQC and HQC. The mean overall recovery of R-bicalutamide was 98.56% with precision of 3.43%.
Table 1. Results of linearity.
S. No. STD Run 1 Run 2 Run 3 Mean Standard Deviation % Accuracy
1 20.000 20.252 19.862 20.518 20.2107 0.33 101.05
2 40.000 42.159 41.241 39.215 40.8717 1.51 102.18
3 400.000 392.264 410.266 405.128 402.5527 9.27 100.64
4 900.000 902.125 909.485 895.268 902.2927 7.11 100.25
5 1300.000 1282.298 1325.348 1313.289 1306.9783 22.21 100.54
6 1900.000 1825.362 1925.276 1912.357 1887.6650 54.34 99.35
7 2600.000 2489.125 2526.228 2544.851 2520.0680 28.37 96.93
8 3200.000 3321.487 3292.378 3189.745 3267.8700 69.21 102.12
Correlation Coefficient (r) 0.9982 0.9992 0.9997
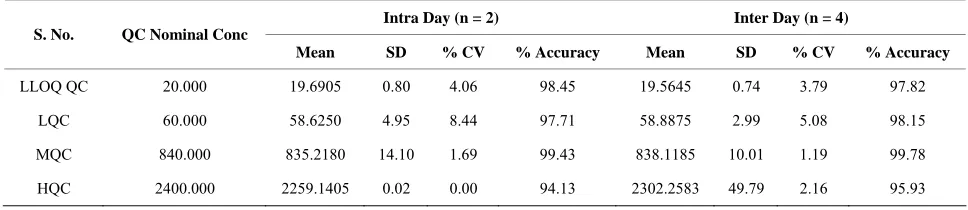
Table 2. Accuracy and precision of the determination
Intra Day (n = 2) Inter Day (n = 4) S. No. QC Nominal Conc
Mean SD % CV % Accuracy Mean SD % CV % Accuracy
LLOQ QC 20.000 19.6905 0.80 4.06 98.45 19.5645 0.74 3.79 97.82
LQC 60.000 58.6250 4.95 8.44 97.71 58.8875 2.99 5.08 98.15
MQC 840.000 835.2180 14.10 1.69 99.43 838.1185 10.01 1.19 99.78
HQC 2400.000 2259.1405 0.02 0.00 94.13 2302.2583 49.79 2.16 95.93
3.7. Stabilities
3.7.1. Refrigerated Stock Solution Stability
Refrigerated stock solution stability was carried out for 9 days by making six injections of stability standard stock solution and the fresh standard (comparison stock) stock solution of R-bicalutamide and topiramate. The response of stability sample was corrected by multiplying with correction factor. The % change for R-bicalutamide was 4.62 and % stability was 95.38%. The refrigerated stabil- ity of topiramate was carried out for 9 days and the % change was 2.35% and % stability was 102.35%.
3.7.2. Correction Factor Was Calculated as Follows Correction factor = [Corrected concentration of compari- son (fresh) standard stock solution]/[Corrected concen- tration of stability standard stock solution].
Note: Corrected concentration: Concentration correc- ted using potency, actual amount weighed and molecular weight of the compound.
[
]
[
]
Mean response of stability stock % Stability
Mean response of comparison stock
=
Correction × factor 100×
3.7.3. Room Temperature Stock Dilution Stability Room temperature stock dilution stability of R-bicaluta-
mide and topiramate was carried out for 24 hours by in- jecting each six replicates of stock dilutions of stability standard stock solution and the fresh standard (compari- son stock) stock solution. The response of stability sam- ple was corrected by multiplying with correction factor. The standard stock solution % stability for R-bicaluta- mide was 97.82%, and for topiramate was 99.24%.
3.7.4. Stability Studies
Six sets of QC samples at LQC and HQC were processed and placed in the auto sampler. These samples were in- jected after a period of around 84 hours and were quanti- fied against freshly spiked calibration curves standards. The samples were found to be stable over a period of 84 hours. The percentage nominal at around 84 hours ranged from 97.39% (HQC) to 101.54% (LQC) and precision ranged from 1.84% (LQC) to 3.82% (HQC) respectively.
The stability in human plasma was determined for five freeze-thaw cycles. Six injections of LQC and HQC were analyzed after undergoing five freeze thaw cycles. The freeze-thaw quality control samples were quantified against the freshly spiked calibration curve standards. The percent nominal ranged from 99.52% (HQC) to 102.42% (LQC) and precision ranged from 2.29% (HQC) to 3.96% (LQC) respectively.
[image:5.595.55.539.302.407.2]Sample Name: "SS" Sample ID: "" File: "01.wiff" Peak Name: "R-Bicalutamide" Mass(es): "429.0/255.0 amu" Comment: "" Annotation: ""
Sample Index: 2 Sample Type: Unknown Concentration: N/A Calculated Conc: 3274.768 ng/mL Acq. Date: 7/9/2009 Acq. Time: 2:15:29 PM
Modified: No Proc. Algorithm: Analyst Classic Bunching Factor: 3 Noise Threshold: 10.00 cps Area Threshold: 100.00 cps Num. Smooths: 10 Sep. Width: 1.00 Sep. Height: 1.00 Exp. Peak Ratio: 5.00 Exp. Adj. Ratio: 4.00 Exp. Val. Ratio: 3.00 RT Window: 30.0 sec Expected RT: 3.70 min Use Relative RT: No
Int. Type: Base To Base Retention Time: 3.697 min Area: 5516798 counts Height: 3.262e+005 cps Start Time: 3.36 min End Time: 4.99 min
0.5 1.0 1.5 2.0 2.5 3.0 3.5 4.0 4.5 5.0
Time, min
5.5 0.0
1.0e4 2.0e4 3.0e4 4.0e4 5.0e4 6.0e4 7.0e4 8.0e4 9.0e4 1.0e5 1.1e5 1.2e5 1.3e5 1.4e5 1.5e5 1.6e5 1.7e5 1.8e5 1.9e5 2.0e5 2.1e5 2.2e5 2.3e5 2.4e5 2.5e5 2.6e5 2.7e5 2.8e5 2.9e5 3.0e5 3.1e5 3.2e5
In
te
n
s
ity
, c
p
s
Sample Name: "SS" Sample ID: "" File: "01.wiff" Peak Name: "Topiramate(IS)" Mass(es): "338.1/77.8 amu" Comment: "" Annotation: ""
Sample Index: 2 Sample Type: Unknown Concentration: 1.00 ng/mL Calculated Conc: N/A Acq. Date: 7/9/2009 Acq. Time: 2:15:29 PM
Modified: No Proc. Algorithm: Analyst Classic Bunching Factor: 1 Noise Threshold: 10.00 cps Area Threshold: 100.00 cps Num. Smooths: 10 Sep. Width: 1.00 Sep. Height: 1.00 Exp. Peak Ratio: 5.00 Exp. Adj. Ratio: 4.00 Exp. Val. Ratio: 3.00 RT Window: 30.0 sec Expected RT: 2.06 min Use Relative RT: No
Int. Type: Base To Base Retention Time: 2.107 min Area: 8431834 counts Height: 1.177e+006 cps Start Time: 1.95 min End Time: 3.46 min
0.5 1.0 1.5 2.0 2.5 3.0 3.5 4.0 4.5 5.0
Time, min
5.5 0.00
5.00e4 1.00e5 1.50e5 2.00e5 2.50e5 3.00e5 3.50e5 4.00e5 4.50e5 5.00e5 5.50e5 6.00e5 6.50e5 7.00e5 7.50e5 8.00e5 8.50e5 9.00e5 9.50e5 1.00e6 1.05e6 1.10e6 1.15e6
In
te
n
s
ity
, c
p
s
2.11
Sample Name: "BLANK" Sample ID: "" File: "02.wiff" Peak Name: "R-Bicalutamide" Mass(es): "429.0/255.0 amu" Comment: "" Annotation: ""
Sample Index: 1 Sample Type: Blank Concentration: 0.000 ng/mL Calculated Conc: N/A Acq. Date: 7/9/2009 Acq. Time: 2:25:19 PM
Modified: No
0.5 1.0 1.5 2.0 2.5 3.0 3.5 4.0 4.5 5
Time, min
.0 5.5 0
5 10 15 20 25 30 35 40 45 50 55 60 65 70 75 80 85 90 95 100 105 110 115 120
In
te
n
si
ty,
Sample Name: "BLANK" Sample ID: "" File: "02.wiff" Peak Name: "Topiramate(IS)" Mass(es): "338.1/77.8 amu" Comment: "" Annotation: ""
Sample Index: 1 Sample Type: Blank Concentration: 1.00 ng/mL Calculated Conc: N/A Acq. Date: 7/9/2009 Acq. Time: 2:25:19 PM
Modified: No Proc. Algorithm: Analyst Classic Bunching Factor: 1 Noise Threshold: 10.00 cps Area Threshold: 100.00 cps Num. Smooths: 10 Sep. Width: 1.00 Sep. Height: 1.00 Exp. Peak Ratio: 5.00 Exp. Adj. Ratio: 4.00 Exp. Val. Ratio: 3.00 RT Window: 30.0 sec Expected RT: 2.06 min Use Relative RT: No
Int. Type: Base To Base Retention Time: 2.096 min Area: 874 counts Height: 1.926e+002 cps Start Time: 2.00 min End Time: 2.17 min
0.5 1.0 1.5 2.0 2.5 3.0 3.5 4.0 4.5 5.0
Time, min
5.5 0
20 40 60 80 100 120 140 160 180 200 220 240 260 280 300 320 340 360 380 400 420 440 460 480 500 520 540 560 580 600 620 640 660 680 700
In
te
n
s
it
y
, c
p
s
2.10 0.10 0.19
0.33
0.47 0.70
0.98 1.14
1.60 1.35
1.66 2.29
2.69
2.46 3.10
3.21 2.77
3.56 3.84
4.49
4.10 5.22 5.54
4.99
4.91 5.94
5.36 5.70
Sample Name: "BLANK+IS" Sample ID: "" File: "03.wiff" Peak Name: "R-Bicalutamide" Mass(es): "429.0/255.0 amu" Comment: "" Annotation: ""
Sample Index: 1 Sample Type: Blank Concentration: 0.000 ng/mL Calculated Conc: N/A Acq. Date: 7/9/2009 Acq. Time: 2:32:17 PM
Modified: No
0.5 1.0 1.5 2.0 2.5 3.0 3.5 4.0 4.5 5
Time, min
.0 5.5 0
2 4 6 8 10 12 14 16 18 20 22 24 26 28 30 32 34 36 38 40 42 44 46 48 50 52 54 56 58 60 62 64 66 68 70
In
te
n
si
ty,
cps
3.68
3.58
1.88 1.76
2.07
3.52
2.32
3.04 2.96
3.15 0.39
Sample Name: "BLANK+IS" Sample ID: "" File: "03.wiff" Peak Name: "Topiramate(IS)" Mass(es): "338.1/77.8 amu" Comment: "" Annotation: ""
Sample Index: 1 Sample Type: Blank Concentration: 1.00 ng/mL Calculated Conc: N/A Acq. Date: 7/9/2009 Acq. Time: 2:32:17 PM
Modified: No Proc. Algorithm: Analyst Classic Bunching Factor: 1 Noise Threshold: 10.00 cps Area Threshold: 100.00 cps Num. Smooths: 10 Sep. Width: 1.00 Sep. Height: 1.00 Exp. Peak Ratio: 5.00 Exp. Adj. Ratio: 4.00 Exp. Val. Ratio: 3.00 RT Window: 30.0 sec Expected RT: 2.06 min Use Relative RT: No
Int. Type: Base To Base Retention Time: 2.097 min Area: 3576922 counts Height: 5.426e+005 cps Start Time: 1.96 min End Time: 2.82 min
0.5 1.0 1.5 2.0 2.5 3.0 3.5 4.0 4.5 5.0
Time, min
5.5 0.0
1.0e4 2.0e4 3.0e4 4.0e4 5.0e4 6.0e4 7.0e4 8.0e4 9.0e4 1.0e5 1.1e5 1.2e5 1.3e5 1.4e5 1.5e5 1.6e5 1.7e5 1.8e5 1.9e5 2.0e5 2.1e5 2.2e5 2.3e5 2.4e5 2.5e5 2.6e5 2.7e5 2.8e5 2.9e5 3.0e5 3.1e5 3.2e5 3.3e5 3.4e5 3.5e5 3.6e5 3.7e5 3.8e5 3.9e5 4.0e5 4.1e5 4.2e5 4.3e5 4.4e5 4.5e5 4.6e5 4.7e5 4.8e5 4.9e5 5.0e5 5.1e5 5.2e5 5.3e5 5.4e5
Int
ens
it
y,
cp
s
2.10
Sample Name: "LLOQ QC" Sample ID: "" File: "14.wiff" Peak Name: "R-Bicalutamide" Mass(es): "429.0/255.0 amu" Comment: "" Annotation: ""
Sample Index: 1 Sample Type: QC Concentration: 20.674 ng/mL Calculated Conc: 22.607 ng/mL Acq. Date: 7/9/2009 Acq. Time: 3:49:14 PM
Modified: No Proc. Algorithm: Analyst Classic Bunching Factor: 3 Noise Threshold: 10.00 cps Area Threshold: 100.00 cps Num. Smooths: 10 Sep. Width: 1.00 Sep. Height: 1.00 Exp. Peak Ratio: 5.00 Exp. Adj. Ratio: 4.00 Exp. Val. Ratio: 3.00 RT Window: 30.0 sec Expected RT: 3.70 min Use Relative RT: No
Int. Type: Base To Base Retention Time: 3.671 min Area: 17140 counts Height: 1.137e+003 cps Start Time: 3.31 min End Time: 4.03 min
0.5 1.0 1.5 2.0 2.5 3.0 3.5 4.0 4.5 5.0
Time, min
5.5 0
50 100 150 200 250 300 350 400 450 500 550 600 650 700 750 800 850 900 950 1000 1050 1100 1150
In
te
ns
it
y,
cp
Sample Name: "LLOQ QC" Sample ID: "" File: "14.wiff" Peak Name: "Topiramate(IS)" Mass(es): "338.1/77.8 amu" Comment: "" Annotation: ""
Sample Index: 1 Sample Type: QC Concentration: 1.00 ng/mL Calculated Conc: N/A Acq. Date: 7/9/2009 Acq. Time: 3:49:14 PM
Modified: No Proc. Algorithm: Analyst Classic Bunching Factor: 1 Noise Threshold: 10.00 cps Area Threshold: 100.00 cps Num. Smooths: 10 Sep. Width: 1.00 Sep. Height: 1.00 Exp. Peak Ratio: 5.00 Exp. Adj. Ratio: 4.00 Exp. Val. Ratio: 3.00 RT Window: 30.0 sec Expected RT: 2.06 min Use Relative RT: No
Int. Type: Base To Base Retention Time: 2.095 min Area: 4011368 counts Height: 6.377e+005 cps Start Time: 1.95 min End Time: 2.84 min
0.5 1.0 1.5 2.0 2.5 3.0 3.5 4.0 4.5 5.0
Time, min
5.5 0.0
2.0e4 4.0e4 6.0e4 8.0e4 1.0e5 1.2e5 1.4e5 1.6e5 1.8e5 2.0e5 2.2e5 2.4e5 2.6e5 2.8e5 3.0e5 3.2e5 3.4e5 3.6e5 3.8e5 4.0e5 4.2e5 4.4e5 4.6e5 4.8e5 5.0e5 5.2e5 5.4e5 5.6e5 5.8e5 6.0e5 6.2e5
In
te
ns
it
y,
cp
s
2.09
(d)
Figure 4. (a) Aqueous Standard with Separated R-Bicalutamide and S-Bicalutamide with IS; (b) Drug free blank plasma; (c) lank Plasma with IS; (d) LLOQ Sample with IS.
[image:13.595.62.536.85.711.2]quantifying six sets each of LQC and HQC against the freshly spiked standards. The % nominal ranged from 98.28% (LQC) to 101.78% (HQC) and the precision ranged from 1.43% (HQC) to 3.52% (LQC) respectively.
Short-term room temperature stability in plasma was determined around 12 hours, using six sets each of LQC and HQC. The quality control samples were quantified against the freshly spiked calibration curve standards. R-bicalutamide was found to be stable around 12 hours. The % nominal ranged from 98.72% (HQC) to 100.48% (LQC) and the precision ranged from 1.75% (HQC) to 3.26% (LQC) respectively.
All the above stability studies results were summarized in Table 3.
3.8. Application: Pharmacokinetic Study
The proposed validated bioanalytical method was suc- cessfully applied to determine R-bicalutamide concentra- tion in plasma samples for pharmacokinetic study in healthy male volunteer, who were administered orally a tablet containing 50 mg bicalutamide in a fasted state. Venous blood samples collected into heparinized tubes and blood samples were centrifuged (4000 rpm for 10 min). Plasma was separated and stored at −70˚C until assay. The maximum plasma concentration was 915.250 ng·mL−1 which occurred at about 30 hours post dosing.
4. Conclusion
[image:14.595.58.284.509.631.2]The objective of this work was to develop a simple, cost effective rugged and a high throughput method for esti- mation of R-bicalutamide in human plasma. The method consists of a simple sample pretreatment by liquid-liquid
Table 3. Summarized results of stability studies.
S. No. Stability Parameter Stability Duration
1 Refrigerated Stock Solution Stability 9 days
2 Room temperature Stock Dilution Stability 24 hours
3 Autosampler Stability 84 hours
4 Freeze Thaw Stability 5 cycles
5 Long Term Plasma Stability at below −70˚C 82 days
6 Short Term Room Temperature in Plasma 12 hours
extraction to give consistent and reproducible recoveries of R-bicalutamide. The run time is 6 minutes suggests high throughput of the proposed method. This was con- siderably less compared to the reported procedure [3], which helps high throughput sample analysis.
REFERENCES
[1] B. J. Furr, “The Development of Casodex (Bicalutamide):
Preclinical Studies,” European Urology, Vol. 29, Suppl. l
2, 1996, pp. 83-95.
[2] S. Lee, Y. J. Chung, B. H. Kim, J. H. Shim and S. H.
Yoon, “Comparative Pharmacokinetic Evaluation of Two Formulations of Bicalutamide 50-mg Tablets: An Open- Label, Randomized-Sequence, Single-Dose, Two-Period Crossover Study in Healthy Korean Male Volunteers,”
Clinical Therapeutics, Vol. 31, No. 12, 2009, pp. 3000-
3008. doi:10.1016/j.clinthera.2009.12.004
[3] R. NageswaraRao, A. NarasaRaju and D. Nagaraju, “An
Improved and Validated LC Method for Resolution of Bicalutamide Enantiomers Using Amylase Tris-(3,5-Ime-
thylphenylcarbamate) as a Chiral Stationary Phase,” Jour-
nal of Pharmaceutical and Biomedical Analysis, Vol. 42, No. 3, 2006, pp. 347-353. doi:10.1016/j.jpba.2006.04.014
[4] D. McKillop, G. W. Boyle, I. D. Cockshott, D. C. Jones,
P. J. Phillips, et al. “Metabolism and Enantioselective
Pharmacokinetics of Casodex in Man,” Xenobiotica, Vol.
23, No. 11, 1993, pp. 1241-1253. doi:10.3109/00498259309059435
[5] F. Boccardo, A. Rubagotti, G. Conti, D. Potenzoni, A.
Manganelli and D. Del Monaco, “Exploratory Study of Drug Plasma Levels during Bicalutamide 150 mg Ther- apy Co-Administered with Tamoxifen or Anastrozole for Prophylaxis of Gynecomastia and Breast Pain in Men
with Prostate Cancer,” Cancer Chemotherapy and Phar-
macology, Vol. 56, No. 4, 2005, pp. 415-420.
doi:10.1007/s00280-005-1016-1
[6] US Food and Drug Administration, “Guidance for Indus-
try. Bioavailability and Bioequivalence Studies for Orally Administered Drug Products-General Considerations,” 2009.
www.fda.gov/downloads/Drugs/.../Guidances/ucm070124
[7] “ICH Text on Validation of Analytical Procedures, Q2A
(R1),” International Conference on Harmonization, IF-
PMA, Geneva, 1994.
[8] Anonymous, “Guide for Industry, Bioanalytical Method