Abstract—A first principle model for DC permanent magnetic motor is used in the robustness analysis of Pulse Width Modulation (PWM) motor speed control. A Simulink model is developed for simulation and analysis. Based on the simulation result, the main factors that contributed to the average speed variation are identified using Design of Experiment (DOE). A robust solution is derived to improve the average speed control accuracy using Response Surface Method (RSM). The robustness of the new design is verified using the simulation model.
Index Terms—Design of Experiment, Monte Carlo Analysis, Pulse Width Modulation, Response Surface Method.
I. INTRODUCTION
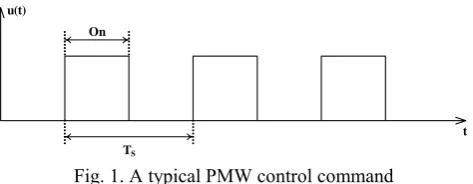
Pulse Width Modulation (see [7]) is commonly used in industry. For instance, in many automotive applications, battery/alternator is often used as power source. The battery/alternator has a constant voltage of about 12 Volts. When a voltage different from this value is needed to control an actuator, one can either use a hardware voltage regulator or PWM control. The hardware solution is usually not desirable due to the high cost and packaging issues associated with it. The idea of using PWM control is very simple: the power to the actuator is effectively reduced by an amount that can be adjusted with PWM duty cycles. A 50% PWM control command is shown in Fig. 1, where the PWM frequency is defined to be 1/Ts, and the PWM duty cycle is defined to be On/Ts * 100%. When the command is “high”, the constant voltage source is connected to the actuator. When the command is “low”, the constant voltage source is disconnected from the actuator. A rule of thumb for PWM duty cycle (see [4]) selection is
min
100%
DesiredVoltage No alVoltage
DutyCycle
=
×
(1) This is a very attractive solution. However, it was found in [9] that the results are usually not accurate. In real world application one gets large variation in the result. The causes for the variation can be from the nonlinearity in the system, the variation in the system parameters and the voltage source etc.Manuscript received July 5, 2007. Wei Zhan is with the Department of Engineering Technology and Industrial Distribution, Texas A&M University, College Station, TX 77843-3367 USA (Tel.: 979-862-4342; Fax: 979-847-3367; e-mail: wei.zhan@ tamu.edu).
t u(t)
TS
[image:1.595.310.547.215.307.2]On
Fig. 1. A typical PMW control command
Using the Six Sigma (see [1]) approach, the robustness of the PWM control of motor speed was discussed in [9]. Details and references in controlling DC permanent magnetic motors can be found in [8]. In this paper, we will try to generalize the result in [9] by adding the temperature factor in the robustness analysis. First, the model for the motor developed in [3] is modified so that the temperature is taken into consideration. The baseline performance of PWM control is established using Monte Carlo analysis (see [2] and [12]). DOE analysis (see [5] and [6]) is conducted to find the main factors contributing to the speed variation. A very useful tool, Response Surface Method (RSM) (see [10] and [11]), is used to derive a robust design. The new design is verified and compared to the baseline using Monte Carlo analysis.
II. MODELING
A DC permanent magnetic motor can be modeled by the following equations:
)
(
1
)
(
1
)
(
)
(
)
(
)
(
)
(
1
)
(
)
(
1
)
(
2 2 ) (t
T
J
t
T
J
dt
t
d
K
t
e
t
i
K
t
T
t
e
L
t
i
L
R
t
e
L
dt
t
di
L m dt t d b b a i m b a a a a a a a−
=
=
=
−
−
=
θ
θ (2)
where
•
K
b=
K
i(This can be easily derived based on the factthat energy goes in is equal to energy comes out) ;
•
K
iis the torque constant, in N-m/A;•
K
bis the back-emf constant, in V/rad/sec; •i
a( )
t
is the armature current, in A;Robustness Analysis of Pulse Width Modulation
Control of Motor Speed
1 speed volatge
-K-torque gain
rpm load
-K-gain R
R 1/L
L_inv
1 s Integrator1 1
s
Integrator 9.5493
Gain4
-K-Gain3 I
I
speed
[image:2.595.74.514.105.232.2]back emf v oltage
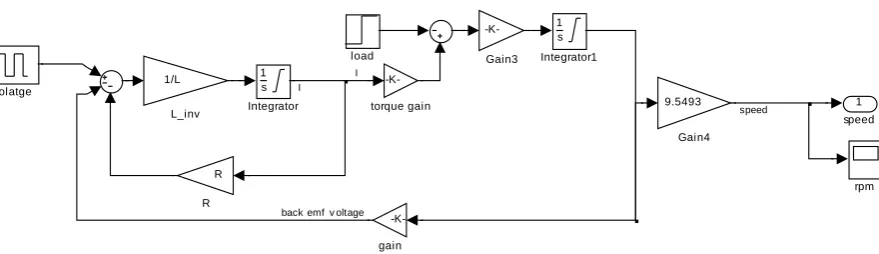
Fig. 2. Simulink model for DC permanent magnetic motor
•
R
a is the armature resistance, inΩ
; •e t
b( )
is the back emf, in V;•
T t
L( )
is the load torque, in N-m; •T t
m( )
is the motor torque, in N-m; •θ
( )
t
is the rotor displacement, in rad; •L
ais the armature inductance, in H; •e
a(
t
)
is the applied motor voltage, in V; •J
is the rotor inertia, in kg-m
2 .The coil resistance and torque/back emf gain are dependent on the temperature:
)]
20
(
0039
.
0
1
[
)
(
T
=
R
+
T
−
R
a (3))]
20
(
0021
.
0
1
[
)
(
T
=
K
−
T
−
K
i (4)where K is the nominal torque gain and R is the nominal resistance of the coil, both at 20 oC.
The first equation in (2) is derived using the Kirchoff Voltage Law: the sum of the voltage drops across the resistor, the inductor, and the back emf is equal to the applied voltage. The second equation in (2) is simply from the linear approximation of the torque-current curve. The third equation in (2) is from the fact that the back emf voltage is proportional to the angular velocity of the rotor. The fourth equation in (2) is derived using Newton’s Second Law.
Based on (2), we build a Simulink model (Fig. 2). The values for the motor model parameters such as
K
i,R
a ,L
a,J
,the temperature, and the control parameter (Duty Cycle) are assigned in a Matlab script file. (3) and (4) are also evaluated in the same script file for simplicity. This allows us to easily simulate thousands of different parameter values for statistic analysis.
It was discovered in [9] that peak-to-peak speed is mainly determined by the PWM frequency and the average speed is
mainly determined by the PWM duty cycle. In this paper, the focus will be on the average speed. Thus, without loss of generality, we assume that the PWM frequency is 40 Hz. Using the model, it can be easily shown that with the following motor/control parameter set:
K
i= 0.02 Nm/A,R
a = 0.1Ω
,a
L
= 1.0e-4 H,J
=9.0e-5 kgm2, V = 12 V, DC = 20%, Tload = 0.3 Nm, T=20 oC, a 28.5% duty cycle would give an average speed of 3000 rpm. The “rule of thumb” defined in equation (1) would give a duty cycle of 64.83% which would result in an average speed of 4570 rpm.III. BASELINE RESULT
The average error defined by the following formula
average error = average speed – target speed (5) will be used as a metric for performance. To establish the baseline performance, we use the Simulink model with the following assumption on the model parameters:
• Nominal resistance: normal distribution, mean value 1.0e-1
Ω
,σ
= 5.0e-3Ω
;• Inductance: normal distribution, mean value 1.0*e-4 H,
σ
= 5.0e-6 H;• Inertia: normal distribution, mean value 9.0e-5 kg m^2,
σ
= 4.5e-6 kg m^2;• Nominal torque gain: normal distribution, mean value 2.0e-2 Nm/A,
σ
= 1.0e-3 Nm/A;• Back emf gain: normal distribution, mean value 2.0e-2 v/rad/s,
σ
= 1.0e-3 v/rad/s;• Voltage: normal distribution, mean value 12 v,
σ
= 1.5v;• Temperature: uniform distribution, range: -10 oC ~ 60 oC.
• Load: TL = 0.3 Nm;
2400 1600 800 -0 -800 -1600 -2400
Median Mean
-80 -100 -120 -140 -160 -180 -200
A nderson-Darling Normality Test
V ariance 585621.34 Skew ness -0.0040510 Kurtosis -0.0878949
N 1000
Minimum -2780.00
A -Squared
1st Q uartile -667.75
Median -133.00
3rd Q uartile 410.00
Maximum 2490.00
95% C onfidence Interv al for Mean -184.80
0.36
-89.83 95% C onfidence Interv al for Median
-209.47 -81.72
95% C onfidence Interv al for StDev
733.13 800.36
P-V alue 0.454
Mean -137.32
StDev 765.26
95% Confidence Intervals
Fig. 3. Baseline performance The simulation result is shown in Fig. 3. The error distribution
is approximately normal with a mean of -137 rpm and a standard deviation of 765 rpm.
IV. DETERMINING THE MAIN FACTORS
To understand how each parameter in the model affects the result, we conduct a DOE for motor PWM control. The 2-level full factorial DOE with the following variables is chosen:
• Resistance: 0.085
Ω
, 0.115Ω
;• Inductance: 8.5e-5 H, 1.15e-4 H;
• Inertia: 7.65e-5 kg m^2, 1.04e-4 kg m^2;
• Torque/back emf gain: 0.017 Nm/A, 0.023 Nm/A;
• Voltage: 8 v, 16 v;
• Temperature: -10 oC, 60 oC;
• Duty cycle: 25%, 35%.
Te
rm
Standardized Effect
BC ACAB BF CGCF BD BG CE CDBE AGC FGB AF AED ADEF EG DGDF DEA GF E
120 100 80 60 40 20 0 2.0
F actor
K
E V
F T
G D
Name
A R
B L
C J
D
Pareto Chart of the Standardized Effects (response is average error (rpm), Alpha = .05)
Fig. 4. Pareto chart of effects for motor speed
The total number of test is therefore 27 = 128. The result is shown in Fig. 4.
It can be seen that battery voltage, temperature and PWM duty cycle are the main factors that cause the speed control variation. Since temperature is usually not monitored, voltage is usually monitored, and duty cycle is a control variable, we focus on the voltage and duty cycle. This will be justified in Section V.
V. RESPONSE SURFACE METHOD
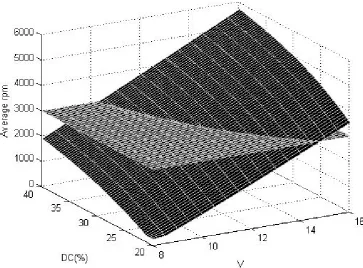
To further investigate the impact of PWM duty cycle and battery voltage on the average motor speed, we do the following to find the response surface (i.e., the average motor speed as a function of PWM duty cycle and battery voltage):
• Assume the nominal value for all the motor parameters;
• Vary the battery voltage from 8 v to 16 v by incremental of 0.5 v;
• Vary the PWM duty cycle from 15% to 65% by incremental of 0.3%;
Fig. 5. Average motor speed as a function of voltage and duty cycle The intersection of these two surfaces defines a relationship
between Voltage and PWM duty cycle
DC = f(V) (6) Since the curve specified by (6) lies on a plane, we can plot it in a two dimensional plane, as shown in Fig. 6.
The function in (6) can be estimated by using numerical curve fitting method as follows
4 3 2
0.029 1.6 33.6 319.5 1185.5
D C = V − V + V − V + (7)
Fig. 6. Duty cycle as a function of Voltage
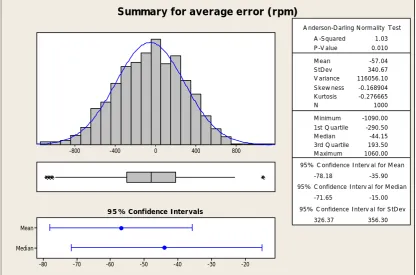
If we adjust the duty cycle using (7), then we will have a constant average motor speed of 3000 rpm. This leads us to a new PWM control design: The duty cycle of PWM is adjusted according to the value of the voltage being applied to the motor. Of course the actual result will have variation since we still have the part-to-part variation and temperature variation. To compare the new design to the baseline design, we conduct the same Monte Carlo analysis with the new design. The result is shown in Fig. 7.
The error distribution is approximately normal with a mean of -57 rpm and a standard deviation of 340 rpm. The mean value is similar to that of the baseline. The standard deviation is reduced by 55%.
[image:4.595.62.277.563.734.2]800 400
0 -400
-800
Median Mean
-20 -30
-40 -50 -60
-70 -80
A nderson-Darling Normality Test
V ariance 116056.10
Skew ness -0.168904
Kurtosis -0.276665
N 1000
Minimum -1090.00
A -Squared
1st Q uartile -290.50
Median -44.15
3rd Q uartile 193.50
Maximum 1060.00
95% C onfidence Interv al for Mean -78.18
1.03
-35.90 95% C onfidence Interv al for Median
-71.65 -15.00
95% C onfidence Interv al for StDev
326.37 356.30
P-V alue 0.010
Mean -57.04
StDev 340.67
95% Confidence Intervals
[image:5.595.89.506.98.373.2]Summary for average error (rpm)
Fig. 7. Performance of new design (average speed error)
VI. CONCLUSIONS
A first principle model, which takes temperature into consideration, is used to simulate the PWM control of DC permanent magnetic motors. Using DOE, the main cause of the average speed variation is found. A new robust PWM control design is derived using RSM. The average speed error variation for the new design is reduced by 55% compared to the baseline PWM control. This is achieved without tightening the tolerance bands for the motor parameters. In other words, the robustness of the PWM control is achieved without additional cost. As one can easily see that the methodology used in this paper is not limited to motor speed control. The basic robustness analysis concept can be used in many other areas.
VII. REFERENCES
[1] M. Harry and R. Schroeder, “Six Sigma: The Breakthrough Management Strategy Revolutionizing the World’s Top Corporations”, 1st edition, Doubleday, New York, 2000.
[2] G. Casella, “Monte Carlo Statistical Methods”, Springer, September 2004.
[3] W. Zhan, “Sensorless Speed Control For DC Permanent Magnetic Motors”, The Ninth IASTED International Conference on Control and Applications, Montreal, May 2007.
[4] M. Barr, "Pulse Width Modulation," Embedded Systems Programming, September 2001, pp. 103-104.
[5] G. Taguchi, “Taguchi on Robust Technology Development”, ASME Press, New York, 1993.
[6] G. Taguchi, “System of Experimental Design”, Unipub/Kraus/American Supplier Institute, Dearborn, MI, 1987.
[7] A.K. Gelig and A. N. Churilov, “Stability and Oscillations of Nonlinear Pulse-Modulated Systems”, Birkhauser, Boston, 1998.
[8] R. Valentine, “Motor Control Electronics Handbook”, McGraw-Hill, 1998.
[9] W. Zhan, “Robust Design For Pulse Width Modulation Control Using Six Sigma Tools”, The 12th Annual International Conference on Industry, Engineering & Management Systems, Florida, March 2007. [10] R.H. Myers and D.C. Montgomery, “Response Surface Methodology”,
John Wiley & Sons, Inc., 1995.
[11] E. del Castillo, “Process Optimization: A Statistical Approach”, International Series in Operations Research & Management Science, Vol. 105, American Institute Physics, 2007.