Abstract—In this paper an experimental study of classification and diagnosis of different number of broken rotor bars and broken end-ring in the three-phase squirrel cage induction motors is presented. Six different faulted rotors are investigated. These faults are one, two, three broken bars, broken end-ring, a bar with high resistance and healthy rotor. The base structure of the study consist of current signal analysis (CSA), feature extraction, Artificial Neural Network (ANN) and diagnosis algorithm. The motor current signal is used for obtaining of effects of broken bars and end-ring in the rotor. To get sight of the effects the current signal that is in the time domain is transformed time-frequency domain via Short Time Fourier Transform (STFT). And the spectrums are averaged and normalized on the time axis. The rotor cage faults are classified with ANN by using these spectrums. And result matrixes of ANN are considered improved decision structure. Thus the faulted rotors are diagnosed at 100% accuracy and classified 98,33% accuracy.
Index Terms—Broken rotor bars, rotor faults diagnosis, classification of rotor faults, short time Fourier transform.
I. INTRODUCTION
Induction motors are critical component of many industrial processes and are widely used as main drive for most rotating mechanical loads. Most electric motor failures interrupt a process, reduce production, and may damage other related machinery. Motor parameters (e.g. current, temperature, and vibration) are used in the diagnosis of faults. In many applications, vibration monitoring methods were utilized for incipient fault detection. However, stator current monitoring was found to provide the same indication without requiring access to the motor. Furthermore, assembly of the vibration sensors is required sensitivity and is more expensive than the other. Motor current spectral analysis is clearly an effective tool for condition monitoring and fault detection in induction motors.
In literature, there has been a substantial amount of research to provide condition monitoring techniques for ac induction
Manuscript received December 29, 2008. Scientific Research Project Found of Selcuk University has been provided the financial support to this project.
H. Arabacı is with the Department of Electrical and Electronics Engineering, Selcuk University, 42075, Konya, Turkey, (corresponding author’s phone: +90-332-2232031; fax: +90-332-2410635; e-mail: [email protected]).
O. Bilgin is with the Department of Electrical and Electronics Engineering, Selcuk University, 42075, Konya, Turkey (e-mail: [email protected]).
motors based on analyzing stator current signals [1]-[10]. A large amount of research has been directed toward using the stator current spectrum to detect rotor faults associated with broken rotor bars [3]-[11]. The early detection of rotor cage faults is very important because in the case of a broken rotor bar, the changes in torque characteristic are usually still not noticeable without measuring devices [7]-[9].
Rotor faults can be detected by using differences in the stator currents. That benefit from side-band in the spectrum. But locations of the side-band component in the spectrum change according to the motor load. Hence the diagnosis and classification of the faults get difficult. Shirt Time Fast Fourier Transform (STFFT) or MUSIC algorithms have been used to overcame that the bad effect [14]. Those algorithms need very long data sets and process time. The long of the data are decreased via averaged and normalized on the time axis. And region have feature of faults is selected in the current spectrus.
The lots of studies about motor faults in literature show that the faults can be classified. In this paper, we have especially investigated and classified rotor faults. To detect the faults we have constructed the diagnosis system. And powerful decision structure is required because of that effects of the faults on current spectrum are similar to other rotor faults. Therefore, ANN is used for classification. Interval of frequency which includes sidebands inputs to ANN. The effects of fault in the spectrum are come clear by using absolute values of FFT result matrixes and these data are normalized to better training for ANN. Obtained the ANN result matrixes were used the result matrixes for diagnosis.
II. SHORT TIME FOURIER TRANSFORM
The STFT transforms a signal into time-varying spectra. It uses Discrete Fourier Transform (DFT) or Fast Fourier Transform (FFT). FFT is chosen in the process because of that FFT is fatter then DFT in computing.
DFT can be represented by Eq. 1.
∑
−= −
=
1 n
0 k
n mk 2 j k
m
x
e
n
1
X
π
(1) An array of samples representing a signal
x
k is transformed into an array of complex numbersX
m representing effectively the frequency and phase response of the signal.Neural Network Classification and Diagnosis
of Broken Rotor Bar Faults by Means of Short
Time Fourier Transform
Fig. 1 STFT of x(k) series.
For a signal
x
k (where k is an index representing successive element of the signal) STFT process;-A small sub-section of the signal of size M samples is grabbed.
-It is windowed by multiplying by a suitable windowing function (hamming, hanning, etc).
-A DFT or FFT on the section of the signal to generate a spectra
X
m (where m is an index representing successive elements of the spectra) is applied.-The spectra in an array of spectra indexed by the integer
l
is stored.-Hop size is determined (by s samples). This process is repeated.
As shown in the Fig. 1the process effectively uses a succession of Short Time Fourier Transform and can be represented by Eq. 2.
( )
∑
+
=
− −
=
M ls
ls k
n mk j ls k k l
m
x
h
e
X
π
2
, (2)
Where
M is the window length s is the ‘hop’ size
l is an integer (0,1,2,….L)
h is the impulse response of the window
Note the mth element of a given spectra will represent a frequency by Eq. 3.
s
m
f
M
m
f
=
×
(3) wheref
s is the sampling frequency.III. ROTOR FAULTS AND THE EFFECTS ON CURRENT
Rotor failures account for 5-10% of total induction motor failures. Rotor faults are very important because their symptoms are sensed by usual measurement systems and they affect the motor moment characteristic. Rotor faults are in the following three categories [8]-[10];
• Broken or cracked (High Resistance) rotor bars or end rings.
• Bad or high resistance connection between rotor bars and end rings.
• Short circuit rotor laminas.
A. Effects of Broken Rotor Bars on The Current
The main reasons of the rotor bar and end ring breakage are
• Residual stresses due to manufacturing problems, • Thermal stresses due to thermal overload and unbalance, hot spots or excessive losses, sparking (mainly fabricated rotors),
• Magnetic stresses caused by electromagnetic forces, unbalanced magnetic pull, electromagnetic noise and vibration,
• Dynamic stresses arising from shaft torque, centrifugal forces and cyclic stresses,
• Environmental stresses caused by contamination or abrasion of the rotor materials due to chemicals or moisture,
Mechanical stresses due to loose laminations, fatigue parts or bearing fault.
IV. THE USED ALGORITHM AND DIAGNOSIS
[image:2.595.318.536.401.771.2]A. Specifications of Used Motor and Data
Six motors were used for obtaining of artificial rotor faults. The motors have 36 stator slots with full pitch three phase concentric winding, 18 rotor slots (squirrel cage), 2 poles and power of 1,5 kW. The stator windings are star connected. The results were obtained using balanced three phase, 380 V, 50 Hz AC source. Each motor was used for different rotor conditions. For healthy and faulty motors current signals were converted to digitalize from analogue via DAC. Sampling was made at 5 kHz. Length of the saved data was 10000. Twenty different data were saved for every motor condition.
B. Spectral Analyze of Current Data
Spectral analyze was made to determine effects of rotor faults on stator current. Therefore, STFFT was used to show the effects in the spectrum.
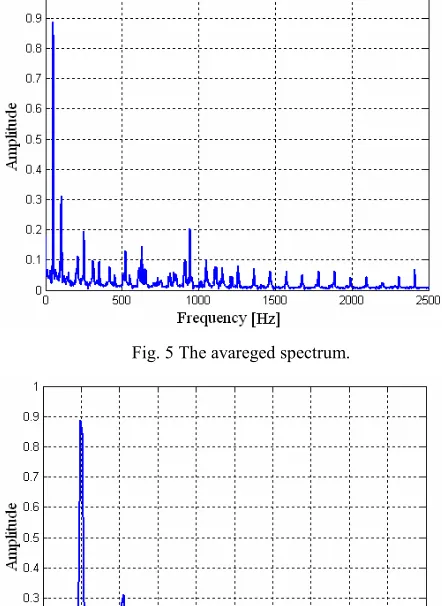
[image:3.595.306.527.64.367.2]FFT is used to see the effects of the faults on the current spectrum. Increasing of account of sampled data for each situation is necessary to better accuracy of fault diagnosis. Therefore, STFT can be used instead of using a great number of data. But it is data having very long dimensions. Fig. 3 shows that spectogram of the healty motor and Fig. 4 shows that spectogram of the motor with one broken bar. This situation makes difficult the calculating process and extends the time of diagnosis. If the data obtaining after STFT process can be reduce via separately averaging of each column of the frequency components. The frequency spectrum obtaining this way, it is for healthy motor, is shown in the Fig. 5.
[image:3.595.51.273.411.573.2]Fig. 3 The spectogram of the healty motor.
Fig. 4 The spectogram of the motor with one broken bar.
Fig. 5 The avareged spectrum.
Fig. 6 The spectrum between 0-500 Hz of the healty motor.
Fig. 7 The spectrum between 0-500 Hz of the motor with one broken
bar.
[image:3.595.49.272.486.746.2]C. ANN Training and Test
In this study ANN which has got a backpropagation algorithm was used for classification of motor conditions. Inputs propagate from input layer to output layer via one hidden layer.
The inputs were the frequency spectrum between 0 and 500 Hz.
Output matrixes are column matrixes and they consist of 6 components. Every line represents 6 different motor conditions.
Each fault representing output matrixes: Healthy : [1 0 0 0 0 0]T A high resistance bar : [0 1 0 0 0 0]T A broken bar : [0 0 1 0 0 0]T Two broken bars : [0 0 0 1 0 0]T Three broken bars : [0 0 0 0 1 0]T Broken end-ring : [0 0 0 0 0 1]T
The choosing of output matrix having six components increased accuracy of the diagnosis.
There were twenty data for every condition. the ten of the data were used for training and others were used for test.
Training and test were implemented at different number of hidden layers and iterations to find optimal number of hidden layers and iterations. Following criteria were used for optimization:
Training Error : Per unit of ratio of difference between real results and training results to number of total samples.
Test Error : Per unit of ratio of difference between
real results and test results to number of total samples.
Diagnosis Error : Per unit of ratio of number of mistaken diagnosises to number of total diagnosis.
Healthy Error : Per unit of ratio of number of mistaken diagnosises in healthy motor conditions to number of total diagnosises.
[image:4.595.47.282.532.611.2]Because of that goal is the fault detection, “Diagnosis Error” was used to be the most significantly indicator in the optimization.
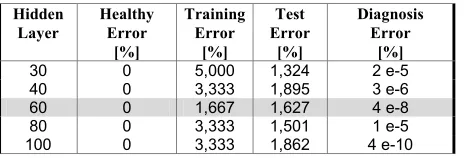
TABLE I.THE ERRORS FOR 1000ITERATIONS AT DIFFERENT
NUMBER OF HIDDEN LAYER.
Hidden Layer Healthy Error [%] Training Error [%] Test Error [%] Diagnosis Error [%]
30 0 5,000 1,324 2 e-5
40 0 3,333 1,895 3 e-6
60 0 1,667 1,627 4 e-8
80 0 3,333 1,501 1 e-5
100 0 3,333 1,862 4 e-10
TABLE II.THE ERRORS FOR 50HIDDEN LAYERS AT DIFFERENT
NUMBER OF ITERATIONS.
Iteration Number Healthy Error [%] Training Error [%] Test Error [%] Diagnosis Error [%]
400 0 1,667 2.093 0,230 600 0 1,667 1,801 0,003 800 0 1,667 1,725 3 e-6 1000 0 1,667 1,613 4 e-8 2000 0 1,667 1,587 7 e-12 3000 0 1,667 1,438 5 e-15 4000 0 1,667 1,524 2 e-16 5000 0 1,667 1,652 1 e-16
By investigating the results, the optimal values have been reached. As shown in Table I and TableII the most efficient number of hidden layer is 60 and the most efficient number of iteration is 3000. At the end of the process the error of training is calculated as 5e-15%, the error of test is 1,44% and the error of diagnosis is 1,67%.
V. CONCLUSION
In the experiments unexpected result matrixes were met. In one of the situations, every component of the result matrix was zero (result matrix=[0 0 0 0 0 0]). In the other one, there were a multiple number of ones in the result matrix (exp. [0 0 0 1 0 1]). These situations were named “No Diagnosis” and any diagnosis result was not given.
Because data which were obtained from motor that has got certain power and diameter were used for the training, the decision structure should be generalized to test all produced motors. Even if the system can not classify faults, healthy motors can be detected by using normalized values. Healthy Error was calculated as zero in whole tests. For this reason it is shown that the constructed decision structure is useful to detect the rotor faults. The experimental study shows that choosing of STFT for diagnosing and fault classifying in the squirrel cage induction motors increased the accuracy rates. So the decision structure classified motor faults with 1,67% error and diagnosed the faulted motors with 100% accuracy.
REFERENCES
[1] G. Bossio, C. De Angelo, J. Solsona, M.I. Valla, “Effects of rotor bar and end-ring faults over the signals of a position estimation strategy for induction motors”, IEMDC'03, IEEE Electric Machines and Drives Conference, Vol. 1, 2003, pp. 151-155.
[2] A. Siddique, G.S. Yadava, B. Singh, “Identification of three phase induction motor incipient faults using neural network”, IEEE International Symposium on Electrical Insulation, 2004, USA, pp. 30-33.
[3] K. Abbaszadeh, J. Milimonfared, M. Haji, H.A. Toliyat, “Broken bar detection in induction motor via wavelet transformation”, IECON’01, The 27th Annual Conference of the IEEE Industrial Electronics Society, 2001, pp. 95-99.
[4] N. Subhasis, A. Shehab, H. A. Toliyat, “Detection of rotor slot and other eccentricity related harmonics in a three phase induction motor with different rotor cages”, IEEE Transactions on Energy Conversion, Vol. 16, No. 3, 2001, pp. 253-260.
[5] M.E.H. Benbouzid,G. B. Klimam, “What stator current
processing-based technique to use for induction motor rotor faults diagnosis?”, IEEE Transactions on Energy Conversion, Vol. 18, No. 2, 2003, pp. 238-244.
[6] X. Huang, T. G. Habetler, R. G. Harley, “Detection of rotor eccentricity faults in closed-loop drive-connected induction motors using an artificial neural network”, 35th Annual IEEE Power Electronics Specialists Conference, 2004, Germany, pp. 913-918.
[7] R. Fiser, S. Ferkolj, H. Solinc, “Steady state analysis of induction motor with broken rotor bars”, Electrical Machines and Drives. Seventh International Conference on (Conf. Publ. No. 412), 1995, pp. 42-46.
[8] M. Haji, H.A. Toliyat, “Pattern recognition – a technique for induction machines rotor fault detection ‘Eccentricity and broken bar fault’ “, IEEE Industry Applications Conference, 2001. Industry Applications Conference, 2001. Thirty-Sixth IAS Annual Meeting. Vol. 3, 2001, pp. 1572-1578.
[9] Arabacı H., “The Detection of Broken Rotor Bars in Squirrel Cage Induction Motors Based on Neural Network Approach”, M.S., Selçuk University Graduate School of Natural and Applied Sciences, Konya, 2005.
International Electrical-Electronics Engineering Symposium, Turkey, 2005, pp. 148-151.
[11] M.E.H. Benbouzid, “A review of induction motors signature analysis as a medium for faults detection”, IECON '98. Proceedings of the 24th Annual Conference of the IEEE, vol. 4, 1998, pp. 1950-1955. [12] ST. J. Manolas, J. A. Tegopoulos, “Analysis of squirrel cage induction
motors with broken bars and rings”, IEEE Transactions on Energy Conversion, Vol. 14, No. 4, 1999, pp. 1300-1305.
[13] S. Premrudeepreechacharn, T. Utthiyoung, K. Kruepengkul, P. Puongkaew, “Induction motor fault detection and diagnosis using supervised and unsupervised neural networks”, IEEE ICIT '02. IEEE International Conference, Vol. 1, 2002, pp.93-96.