SHORT COMMUNICATION
Energetic costs of performance in trained and untrained
Anolis carolinensis
lizards
Simon P. Lailvaux1,*, Andrew Z. Wang2and Jerry F. Husak2
ABSTRACT
The energetic costs of performance constitute a non-trivial component of animals’ daily energetic budgets. However, we currently lack an understanding of how those costs are partitioned among the various stages of performance development, maintenance and production. We manipulated individual investment in performance by trainingAnolis carolinensislizards for endurance or sprinting ability. We then measured energetic expenditure both at rest and immediately following exercise to test whether such training alters the maintenance and production costs of performance. Trained lizards had lower resting metabolic rates than controls, suggestive of a maintenance saving associated with enhanced performance as opposed to a cost. Production costs also differed, with sprint-trained lizards incurring a larger energetic performance cost and experiencing longer recovery times compared with endurance trained and control animals. Although performance training modifies metabolism, production costs are probably the key drivers of trade-offs between performance and other life-history traits in this species.
KEY WORDS: Endurance, Exercise, Metabolic rate, Lizard, Locomotion, Performance
INTRODUCTION
Most fundamental fitness-related processes, from growth rate and immune function to reproductive investment, are affected by an
organism’s overall energy budget. Measures of daily energetic
intake and expenditure therefore delimit the quantity of energetic resources that an organism can dedicate towards supporting key physiological and behavioural processes, including (but not limited to) the minimal metabolic machinery that keeps organisms alive. Because that available resource pool is finite, organisms are forced to dynamically prioritize investment in certain traits at the expense of others, resulting in trade-offs in trait expression (De Jong and Van Noordwijk, 1992; Roff and Fairbairn, 2007; Tomkins et al., 2004). Those trade-offs can have clear effects on fitness, and so understanding the costs involved in driving resource allocation decisions is an important goal of life-history evolution.
Activity level constitutes a significant portion of daily energetic expenditure (DEE) in animals such as predators that rely extensively on locomotor activity for foraging (Garland, 1983; Williams et al., 2014). There is mounting evidence that the expression of locomotor performance (and of whole-organism performance in general) can
drive trade-offs with other life-history traits that are linked to fitness (reviewed in Lailvaux and Husak, 2014), and that the relative costs of daily locomotor activity and reproduction in particular may be large enough to impinge upon each other in certain species (Lailvaux and Husak, 2017). However, a proper understanding of such trade-offs requires fine-grained estimates of the costs of expression of each trait. The costs of performance expression range from ecological costs imposed by the external environment to intrinsic, energetic costs associated with use of a given performance trait. With regard to these energetic costs specifically, Husak and Lailvaux (2017) distinguished between maintenance costs associated with the support and maintenance of those physiological and morphological pathways that bolster performance, and production costs that accrue to animals when they use their performance traits to conduct ecological tasks. Quantifying the relative magnitude of these costs is important because changes in either or both can affect how acquired energetic resources are allocated towards other fitness-enhancing traits, and could do so in different, cost-specific ways. Although a large literature is focused on understanding both energetic expenditure associated with locomotor activity and variation in basal/ resting metabolic rates in animals following exercise (e.g. Donovan and Gleeson, 2006; Gleeson and Hancock, 2002), no studies thus far have experimentally distinguished between the maintenance and production costs of performance.
A powerful way to disentangle maintenance and production costs of performance is to experimentally manipulate investment in performance through exercise training. Husak et al. (2015) showed
that green anole lizards (Anolis carolinensisVoight 1832) can be
trained for endurance and sprinting, resulting in significant
morphological and physiological changes compared with
untrained controls. Endurance training in particular not only enhances endurance capacity relative to untrained controls, but also suppresses immune function and fecundity (Husak et al., 2016, 2017). Thus, manipulations of locomotor performance investment through training hold enormous opportunity for understanding not only the life-history consequences of performance expression, but also the various energetic costs of that expression in these organisms.
Here, we test the following explicit hypotheses and associated predictions: (1) training affects metabolic rate. Because both endurance and sprint training alter aspects of physiology and muscle morphology in measurable ways, we expect that these training regimes will also influence the costs that organisms pay to maintain those performance levels. Specifically, we predict that both sprint- and endurance-trained lizards will exhibit higher resting metabolic rates than control animals. We expect sprint-trained lizards to have the highest maintenance costs because enhanced performance is primarily due to increases in tissue mass (Husak et al., 2015) compared with levels in endurance-trained lizards, where training may cause more efficient metabolism (reviewed in Speakman and Selman, 2003). (2) Training affects the energetic
Received 31 December 2017; Accepted 2 March 2018
1Department of Biological Sciences, University of New Orleans, New Orleans,
LA 70148, USA.2Department of Biology, University of Saint Thomas, Saint Paul,
MN 55105, USA.
*Author for correspondence ([email protected])
S.P.L., 0000-0002-2737-8682
Journal
of
Experimental
production cost of performance expression. Previous studies of lizard locomotion show that the costs of intense locomotor activity are reflected in metabolic rates measured immediately post-exercise (reviewed in Gleeson and Hancock, 2002). We predict that the physiological changes associated with exercise training will drive higher costs of performance production in trained animals, as indicated by larger increases in metabolic rate from resting levels during the post-exercise recovery phase in trained versus untrained animals. Furthermore, we predict that sprint-trained lizards would have the longest recovery times of all due to their investment in anaerobic metabolic pathways.
MATERIALS AND METHODS General husbandry
We obtained juvenile male (N=18) and female (N=18) green anoles
from a commercial vendor (Candy’s Quality Reptiles, LaPlace, LA,
USA), and housed them in male–female pairs in 12 liter tanks
(medium Kritter Keepers, Lee’s Aquarium & Pet Products, San
Marcos, CA). Lizards were housed at 30–33°C on a 12 h:12 h light:
dark cycle for 4 weeks of acclimation before the beginning of the experiment (Husak et al., 2015, 2016). Training and all measures of performance were conducted within this temperature range. Lizards
were fedad libitumcommercially obtained crickets (Fluker Farm,
Port Allen, LA, USA) three times a week, with calcium and vitamin D supplemented once a week throughout the experiment. Cages were sprayed with tap water three times a day so that water was
available ad libitum, and humidifiers were used to maintain
humidity above 40%. All research was conducted under approval by the University of Saint Thomas Animal Care and Use Committee.
Pre-treatment measurements
Prior to the onset of training, we took several measurements from
each lizard. We measured mass and snout–vent length (SVL) of
each lizard, as well as sprint speed and endurance capacity. Sprint speed was measured with each lizard being run three times in one day (trials being separated by 2 h). Lizards were motivated by gently tapping their tails with a paintbrush as they ran. The racetrack was a dowel 2 m long and 5 cm in diameter covered in cork (for traction), and was equipped with vertically paired infrared photocells (Trackmate Racing, Surrey, British Columbia, Canada) at 0.25 m intervals so that a running lizard broke the beams sequentially and
the elapsed time (ms, then converted to m s−1) for each interval was
recorded by a computer. The track was placed at a 45 deg angle to simulate natural conditions (Cox et al., 2009). The fastest 0.25 m speed was considered maximal. Endurance was measured on a motorized treadmill (PetRun model PR700 modified for lower speeds) by recording the time to exhaustion, determined by when lizards lost their righting response while running on a treadmill
rotating at 0.3 km h−1(Cox et al., 2009; Husak et al., 2016, 2015;
Perry et al., 2004). Treadmills were cleaned with ethanol between lizards during measurements and training bouts described below.
After pre-treatment measures, lizards were allowed to rest for 3 days after which we randomly assigned each to one of three
treatment groups: sprint trained (N=6 males, 6 females), endurance
trained (N=6 males, 6 females) or untrained (control;N=6 males, 6
females). The three treatment groups did not differ from each other in initial SVL (two-way ANOVA with sex and training treatment as
factors:P>0.3 for both main effects and interaction), mass (two-way
ANOVA with sex and training as factors: P>0.7 for both main
effects and interaction), sprint speed (two-way ANCOVA with SVL
as a covariate and sex and training as factors:P>0.4 for both main
effects and interaction) or endurance (two-way ANCOVA with SVL
as a covariate and sex and training as factors:P>0.8 for both main
effects and interaction).
Training
Lizards were trained three days a week (Monday, Wednesday and Friday) for 9 weeks, following previous protocols (Husak et al., 2016, 2015, 2017). Endurance training was conducted on the same treadmill on which we measured endurance capacity, but at a slower
speed (0.18 km h−1instead of 0.3 km h−1). Lizards were run each
training session for 30 min, eventually increasing intensity by increasing incline (following a modified procedure in Husak et al.,
2016). We began with no incline (weeks 1–3) before adding an
incline of 9 deg (weeks 4–6), and then 13 deg for the remaining
3 weeks.
Sprint speed training consisted of lizards being run up the same racetrack used to measure pre-treatment sprint speed, with intensity increased by adding weights to lizards. In the first phase, lizards were run in three sessions of three runs per day with 2 h of rest between sessions (for a total of 9 runs per day). In the second phase, runs were the same, but individuals had one-quarter of the average weight for each sex (1 g for males, 0.3 g for females) tied around their waist with thin monofilament. In the third phase, weight was increased to one-half of the average weight of each sex (2 g for males, 0.6 g for females) tied around their waist with thin monofilament. There were no apparent detrimental effects of the added weight beyond reduced speeds, and all lizards were able to run their trials successfully.
The control treatment lizards were handled twice a week. This was meant to stimulate any stress response that may have resulted just from handling the trained lizards. Control lizards were captured, removed from their cage, and held for approximately 30 s. Any effect on trained individuals of being in an unfamiliar location during training is unlikely, since the treadmills eventually became familiar places because lizards were trained on the same treadmill by the same person.
Respirometry
Standard metabolic rates (SMRs) were measured during normal periods of inactivity (between 21:00 h and 02:00 h). Cages were placed in black bags and gently moved from the animal housing room to the laboratory. Lizards were removed from their cage in the dark, placed in a flow-through metabolic chamber (60 ml syringe barrel), which was then placed in an incubator at 33°C (Orrell et al., 2004). They were left in the chamber for 45 min, and we used the
lowest 5 min of stable CO2production as SMR. CO2production was
measured (1 sample s−1) with a Qubit S151 h CO
2analyzer. Air was
drawn from an undisturbed area of the laboratory (a large, well-ventilated room) and dried with Drierite before entering the
metabolic chamber. Each metabolic rate of interest was
determined by calculating an average CO2 level over the
timeframe stated, subtracting stable background levels determined before the trial began, and multiplying by the flow rate
(0.4 l min−1).
Resting RMR before running to exhaustion was measured similarly to SMR, but during normal times of activity. Lizards were removed from their cages, placed into a metabolic chamber in an incubator.
They acclimated for 10 min before 30 min of CO2production was
measured, taking the lowest stable 5 min as RMR. They were then
taken to a treadmill and run to exhaustion at 0.33 km h−1, with the
time it took to reach exhaustion being their endurance capacity
(Husak et al., 2016, 2107). Immediately after exhaustion (all <30 s),
Journal
of
Experimental
lizards were placed in a metabolic chamber. We left lizards in the
metabolic chamber until CO2 consumption reached 1.5 times the
previously measured RMR (Hancock et al., 2001; Hancock and
Gleeson, 2002). Peak metabolic rate (V̇CO2,max) was the highest
CO2 production achieved during this period (averaged across the
highest 10 s), and recovery time was the period of time from that peak to 1.5-times RMR (mean time was 15.7±0.94 s). We also calculated
the change in metabolic rate (ΔMR) as the difference between peak
MR and minimal MR (either RMR or SMR, coded as metabolic rate type; see statistical analysis below). All respirometry measurements were performed after the conclusion of training and other post-training measurements.
Statistical analysis Endurance performance
We compared final endurance times for control, sprint and endurance trained individuals using a two-way ANCOVA with sex and treatment as factors, SVL as a covariate, and a sex×treatment
interaction. We used Tukey’s Honest significant differencepost hoc
tests to determine which treatment means differed from each other.
Resting metabolic rates
Because we measured RMR and SMR on the same individuals, these metabolic measures are not independent of each other. To test for an effect of training treatment on metabolic rate, we therefore used a general linear mixed-model with metabolic rate as a dependent variable; metabolic rate type (i.e. RMR or SMR) as random slopes (Schielzeth and Forstmeier, 2009); treatment, metabolic rate type, mass and sex as explanatory variables; and
individual as a random factor as implemented in the R packagenlme
(https://cran.r-project.org/web/packages/nlme/index.html). We also included an interaction between treatment and metabolic rate type to
test whether SMR and RMR responded similarly to training regimes.
Metabolic increment data
We used mixed-models with random intercepts for each individual and random slopes for metabolic rate type as above to test for effects of treatment, metabolic rate type, mass, sex, and the interaction
between treatment and metabolic rate type onΔMR. As a further test
of the production costs incurred by performance, we also used tested recovery time following final endurance measurement as a function of treatment, resting metabolic rates, sex, mass, endurance time, peak metabolic rate, and final metabolic rate. Because endurance time following training was measured only once per individual, we analyzed these data using a general linear model.
All statistical analyses were conducted using R v.3.4.2 (https:// www.r-project.org/). In all cases, variables were transformed using log or Tukey transformations as required to meet assumptions of normality and homoscedasticity. We based model simplification on log-likelihood ratio tests using maximum likelihood, and re-fitted all final models using restricted maximum likelihood (REML).
RESULTS AND DISCUSSION
We found a significant effect of training treatment on final
endurance performance (F2,29=11.28, P<0.001), but not of sex
(F1,29=0.28,P>0.6) following correction for SVL. Tukey’s HSD
test showed that this treatment effect is driven by significantly
greater endurance in sprint-trained (P<0.002) and
endurance-trained (P<0.001) lizards compared with controls. Thus, both
sprint and endurance training increased endurance capacity in these animals, although endurance-trained lizards exhibited the greatest final endurance capacities (Table S1), consistent with earlier studies (e.g. Husak et al., 2015).
1.2
RMR
A
B
ΔMR ΔSMRSMR
1.0
0.8
MR (ml CO
2
h
–1
)
0.35
Δ
MR (ml CO
2
h
–1
)
0.45
0.6
0.4
2 3 4 5 2
Mass (g)
3 4 5
2 3 4 5 2 3 4 5
2.5
2.0
1.5
1.0
[image:3.612.50.365.429.731.2]Control Endurance Sprint
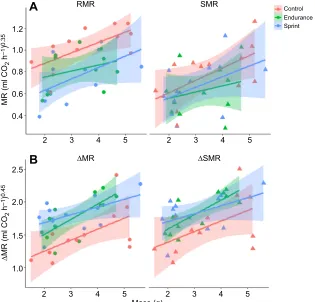
Fig. 1. Influence of performance training on metabolic rate in green anole lizards.We tested for an effect of mass and training treatment on MR0.35andΔMR0.45. (A) RMR (left) is higher than SMR (right) and control lizards exhibited higher MRs (of both types) than either sprint-trained or endurance-sprint-trained lizards. (B) The greatest change in MR was observed when comparing SMRs to post-exercise peak MR (ΔSMR, right) of sprint-trained lizards (blue), whereas the SMRs of endurance trained lizards (green) were not different from those of controls (red). Shaded areas represent 95% confidence intervals; n=6 for all treatment/sex combinations.
Journal
of
Experimental
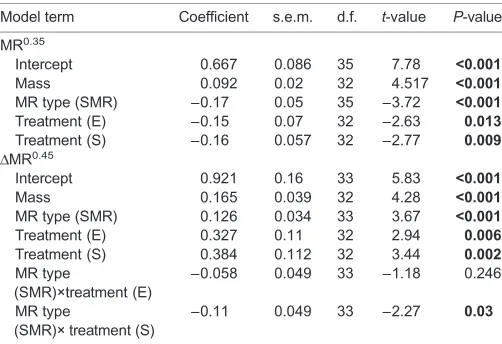
The mixed model that best described metabolic rate yielded significant terms for mass, training treatment and MR type (Akaike
information criterion, AIC=−22.13). Control lizards exhibited
higher metabolic rates than either sprint- or endurance-trained lizards, and RMRs were always higher than SMRs (Fig. 1A, Fig. S1). This model did not retain an interaction between metabolic rate type
and treatment (model with interaction AIC=−19.28), nor did it
contain a sex effect (model with sex effect AIC=−20.78; Table 1).
Thus, both types of metabolic rate responded comparably to training in males and females (see Table S2 for mean MR values).
The mixed model that best described change in metabolic rate
following endurance exercise (i.e.ΔMR) retained effects of mass,
metabolic rate type and treatment, as well as an interaction between treatment and metabolic rate type (Table 1). This model also had the
lowest AIC (AIC=−34.31) compared with the model including a
sex effect, which was the next most likely (AIC=−32.32). Lizards
trained for sprinting thus increase their metabolic rates more following exercise than do untrained controls when comparing their SMR with their post-exercise peak MR (Fig. 1B, Fig. S2). Results for mass-specific metabolic rates can be found in Table S2, and exhibit comparable patterns to those presented here, with the sole
exception of a marginal sex effect on Δ mass-specific MR
( presented in Table S3B).
The general linear model that best described variation in recovery
time retained effects of mass, treatment, ΔRMR and V̇CO2,max
(Table 2). Sprint-trained individuals had the longest recovery
times, and there was a negative relationship betweenV̇CO2,max and
recovery time within the context of the final model. Endurance time was not retained in the final model, and thus the recorded recovery times are not influenced by the length of the final endurance trial.
The energetic costs of locomotor performance have received a great deal of attention, but measuring the specific costs associated with the maintenance and expression of certain performance traits has long been a challenge (Husak and Lailvaux, 2017). In this study, we trained lizards for either endurance or sprinting and measured their metabolic rates both at rest and immediately following a bout of endurance exercise, and compared results with measurements in lizards that were not trained. By doing so, we aimed to identify the
specific signatures of energetic expenditure associated with enhanced locomotor performance.
Our first hypothesis was that training would alter resting metabolic rates compared with levels in untrained controls, and we specifically predicted that lizards that had undergone either sprint or endurance training would exhibit higher resting metabolic rates than untrained lizards, reflecting the maintenance costs of performance. We did find an effect of training on metabolic rates, albeit in the opposite direction to our prediction: metabolic rates of trained lizards at rest are lower than those of control individuals, and we found no support for a difference between the metabolic rates of endurance and sprint-trained lizards (Table 1). We also found an additional effect of metabolic rate type, whereby resting metabolic rates measured during the daytime (RMRs) are higher than SMRs measured at night. However, the pattern of trained lizards spending less energy than controls at rest is the same for both types (Fig. 1A). Reduced costs of resting metabolism associated with training might be explicable on the grounds of increased efficiency, whereby trained animals are able to make more efficient use of oxygen, perhaps through plasticity in mitochondrial function (Bouchard and Guderley, 2003). Although evidence from trained humans suggests that exercise can increase metabolic efficiency to decrease RMR (Byrne and Wilmore, 2001; Westerterp et al., 1992), this energetic efficiency scenario is not always supported by studies in other animal species, which generally show an increase in resting metabolic rates associated with long-term exercise (reviewed in Speakman and Selman, 2003). However, this trend is not consistent
across all species; trained zebra finches (Taeniopygia guttata), for
example, exhibit reduced RMRs that are not accounted for by changes in lean body mass (Nudds and Bryant, 2001). In any case, our data suggest that green anoles do not pay maintenance costs associated with performance enhancement via training, but instead realize energetic savings associated with the exercise response.
Our second hypothesis (that training would affect the production costs of performance) was supported, with trained lizards showing larger increments in metabolic rates following a bout of endurance exercise (Table 1), and sprint-trained lizards showing the longest recovery times, as we predicted (Table 2). Given that the excess post-exercise oxygen consumption (EPOC) observed during the recovery phase immediately following exertion is estimated to
account for 80–90% of the total energy expended during activity
[image:4.612.48.299.78.250.2](Baker and Gleeson, 1998, 1999; Edwards and Gleeson, 2001), this can be interpreted as evidence that sprint-trained lizards pay the highest production costs of performance. The increased recovery time of sprint-trained lizards is probably due to their lower aerobic capacities relative to those of endurance-trained and control individuals because sprint training forces allocation towards pathways and morphology associated with anaerobic metabolism (Husak et al., 2015).
Table 1. Best-fitting models describing the variation in MR0.35and
ΔMR0.45
Model term Coefficient s.e.m. d.f. t-value P-value
MR0.35
Intercept 0.667 0.086 35 7.78 <0.001 Mass 0.092 0.02 32 4.517 <0.001 MR type (SMR) −0.17 0.05 35 −3.72 <0.001 Treatment (E) −0.15 0.07 32 −2.63 0.013 Treatment (S) −0.16 0.057 32 −2.77 0.009
ΔMR0.45
Intercept 0.921 0.16 33 5.83 <0.001 Mass 0.165 0.039 32 4.28 <0.001 MR type (SMR) 0.126 0.034 33 3.67 <0.001 Treatment (E) 0.327 0.11 32 2.94 0.006 Treatment (S) 0.384 0.112 32 3.44 0.002 MR type
(SMR)×treatment (E)
−0.058 0.049 33 −1.18 0.246
MR type
(SMR)× treatment (S)
−0.11 0.049 33 −2.27 0.03
The baseline category for MR type is RMR, and that for treatment is control. Thus, the reported values give estimated change in the dependent variable between the category named in the table and the baseline category. Bold values indicate significant (P<0.05) estimates. E, endurance training; S, sprint training.
Table 2. Best-fitting models describing the variation in recovery time following a bout of endurance exercise
Model term Coefficient s.e.m. t-value P-value
Intercept 9.7 3.03 3.2 0.003
Mass 2.17 1.02 2.14 0.041
ΔMR 9.83 2.28 4.31 <0.001
Treatment (E) 1.34 2.35 0.57 0.57
Treatment (S) 8.58 2.5 3.44 0.002
V̇CO2,max −9.327 2.27 4.11 <0.001
The baseline category for treatment is control (C). Degrees of freedom=30 for all terms. Bold values indicate significant (P<0.05) estimates. E, endurance training; S, sprint training.
Journal
of
Experimental
[image:4.612.312.564.80.156.2]Increased understanding of the effects of performance training on metabolism also sheds light on the nature of life-history trade-offs previously observed in trained green anole lizards, such as reduced reproductive investment and immune function associated with a greater response to training in females. We found no evidence for a sex effect on any of the metabolic variables considered here, which suggests that the sex differences in trade-offs are not driven by sex-specific asymmetries in energetic expenditure. Furthermore, the unexpected finding that locomotor training is associated with energetic savings with regard to resting metabolism implies that it is the production costs of performance as opposed to the posited maintenance costs that drive trade-offs between performance and other life-history traits in green anoles, although future studies, perhaps on exercise-trained juveniles, might consider the energetic development costs, as also proposed by Husak and Lailvaux (2017).
Acknowledgements
We thank E. Magnuson, K. Reardon and C. Rohlf for help with lizard husbandry and training, A. Lewno for logistical support, and R. Brown, L. Deichmann, D. Jafari and N. Pionke for inspiration.
Competing interests
The authors declare no competing or financial interests.
Author contributions
Conceptualization: S.L., A.W., J.F.H.; Methodology: J.F.H.; Formal analysis: S.L.; Investigation: A.W., J.F.H.; Resources: J.F.H.; Writing original draft: S.L.; Writing -review & editing: S.L., A.W., J.F.H.; Supervision: J.F.H.; Project administration: J.F.H.
Funding
This research received no specific grant from any funding agency in the public, commercial or not-for-profit sectors.
Supplementary information
Supplementary information available online at
http://jeb.biologists.org/lookup/doi/10.1242/jeb.176867.supplemental
References
Baker, E. J. and Gleeson, T. T.(1998). EPOC and the energetics of brief locomotor
activity inMus domesticus.J. Exp. Zool.280, 114-120.
Baker, E. J. and Gleeson, T. T.(1999). The effects of intensity on the energetics of
brief locomotor activity.J. Exp. Biol.202, 3081-3087.
Bouchard, P. and Guderley, H. (2003). Time course of the response of mitochondria from oxidative muscle during thermal acclimation of rainbow trout,
Oncorhynchus mykiss.J. Exp. Biol.206, 3455-3465.
Byrne, H. K. and Wilmore, J. H.(2001). The relationship of mode and intensity
of training on resting metabolic rate in women.Int. J. Sport Nutr. Exerc. Metab.
11, 1-14.
Cox, R. M., Stenquist, D. S., Henningsen, J. P. and Calsbeek, R. (2009). Manipulating testosterone to assess links between behavior, morphology, and
performance in the brown anole Anolis sagrei. Physiol. Biochem. Zool. 82,
686-698.
De Jong, G. and Van Noordwijk, A. J. (1992). Acquisition and allocation of
resources: genetic (co)variances, selection, and life histories.Am. Nat. 139,
749-770.
Donovan, E. R. and Gleeson, T. T.(2006). Metabolic support of moderate activity differs from patterns seen after extreme behavior in the desert iguana
Dipsosaurus dorsalis.Physiol. Biochem. Zool.79, 370-388.
Edwards, E. B. and Gleeson, T. T.(2001). Can energetic expenditure be minimized
by performing activity intermittently?J. Exp. Biol.204, 599-605.
Garland, T. (1983). Scaling the ecological cost of transport to body mass in
terrestrial mammals.Am. Nat.121, 571-587.
Gleeson, T. T. and Hancock, T. V.(2002). Metabolic implications of a‘run now, pay
later’ strategy in lizards: an analysis of post-exercise oxygen consumption.
Comp.Biochem. Physiol. A133, 259-267.
Hancock, T. V. and Gleeson, T. T.(2002). Metabolic recovery in the Desert Iguana (Dipsosaurus dorsalis) following activities of varied intensity and duration.Funct. Ecol.16, 40-48.
Hancock, T. V., Adolph, S. C. and Gleeson, T. T.(2001). Effect of activity duration
on recovery and metabolic costs in the desert iguana (Dipsosaurus dorsalis).
Comp. Biochem. Physiol. A Mol. Integr. Physiol.130, 67-79.
Husak, J. F. and Lailvaux, S. P.(2017). How do we measure the cost of
whole-organism performance traits?Integr. Comp. Biol.57, 333-343.
Husak, J. F., Keith, A. R. and Wittry, B. N.(2015). Making Olympic lizards: the
effects of specialised exercise training on performance. J. Exp. Biol. 218,
899-906.
Husak, J. F., Ferguson, H. A. and Lovern, M. B. (2016). Trade-offs among
locomotor performance, reproduction and immunity in lizards.Funct. Ecol.30,
1665-1674.
Husak, J. F., Roy, J. C. and Lovern, M. B.(2017). Exercise training reveals trade-offs between endurance performance and immune function, but does not
influence growth, in juvenile lizards.J. Exp. Biol.220, 1497-1502.
Lailvaux, S. P. and Husak, J. F. (2014). The life-history of whole-organism
performance.Q. Rev. Biol.89, 285-318.
Lailvaux, S. P. and Husak, J. F.(2017). Predicting life-history trade-offs with
whole-organism performance.Integr. Comp. Biol.57, 325-332.
Nudds, R. L. and Bryant, D. M.(2001). Exercise training lowers the resting
metabolic rate of Zebra Finches, Taeniopygia guttata.Funct. Ecol.15, 458-464.
Perry, G., Levering, K., Girard, I. and Garland, T. J. (2004). Locomotor
performance and social dominance in maleAnolis cristatellus.Anim. Behav.
67, 37-47.
Orrell, K. S., Congdon, J. D., Jenssen, T. A., Michener, R. H. and Kunz, T. H.
(2004). Intersexual differences in energy expenditure ofAnolis carolinensislizards
during breeding and postbreeding seasons.Physiol. Biochem. Zool.77, 50-64.
Roff, D. A. and Fairbairn, D. J.(2007). The evolution of trade-offs: where are we?
J. Evol. Biol.20, 433-447.
Schielzeth, H. and Forstmeier, W. (2009). Conclusions beyond support:
overconfident estimates in mixed models.Behav. Ecol.20, 416-420.
Speakman, J. R. and Selman, C.(2003). Physical activity and resting metabolic
rate.Proc. Nutr. Soc.62, 621-634.
Tomkins, J. L., Radwan, J., Kotiaho, J. S. and Tregenza, T.(2004). Genic capture
and resolving the lek paradox.Trends Ecol. Evol.19, 323-328.
Westerterp, K. R., Meijer, G. A. L., Janssen, E. M. E., Saris, W. H. M. and Hoor, T. F.(1992). Long-term effect of physical activity on energy balance and body
composition.Br. J. Nutr.68, 21-30.
Williams, T. M., Wolfe, L., Davis, T., Kendall, T., Richter, B., Wang, Y., Bryce, C., Elkaim, G. H. and Wilmers, C. C.(2014). Instantaneous energetics of puma kills
reveal advantage of felid sneak attacks.Science346, 81-85.