REVIEW ARTICLE
Arterial Spin-Labeling in Routine Clinical
Practice, Part 3: Hyperperfusion Patterns
A.R. Deibler J.M. Pollock R.A. Kraft H. Tan J.H. Burdette J.A. Maldjian
SUMMARY:Arterial spin-labeled (ASL) perfusion imaging can be implemented successfully into a routine clinical neuroimaging protocol and can accurately demonstrate alterations in brain perfusion. We have observed patterns of focal, regional, and global hyperperfusion in a wide variety of disease processes. The causes of hyperperfusion at clinical ASL have not been previously characterized. Focal lesions such as brain tumors and vascular malformations with increased perfusion can be well depicted by ASL. More global causes of hyperperfusion, including postanoxia vasodilation and hypercapnia, may go undetected on conventional MR images, whereas the regional hyperperfusion, which may occur in reversible encephalopathies and luxury perfusion, has been consistently illustrated on ASL cerebral blood flow maps at our institution.
A
rterial spin-labeling (ASL) is capable of demonstrating hyperperfusion in a clinical population. Our clinical im-aging experience has shown that ASL is very sensitive to patho-logic states manifesting as focal, regional, and global hyperper-fusion. With the availability of fully postprocessed ASL cerebral blood flow (CBF) maps at our institution within min-utes of acquisition, timely assessment of brain perfusion in a wide range of diseases is now possible.In Part 1 of this series, we described the technique, artifacts, and pitfalls related to the application of ASL into a routine clinical neuroimaging protocol.1Part 2 focused on patterns of
focal and global hypoperfusion on ASL CBF maps.2Here we
describe various causes of focal and global hyperperfusion, including tumor, infarct, seizure, vascular malformations, and various other neurologic disorders (Table).
Perfusion MR imaging, particularly dynamic susceptibility contrast (DSC) MR imaging, has been established as a valuable adjunct imaging technique for the evaluation of brain tumors. Specifically, perfusion techniques may be useful in directing surgical biopsy and resection, helping differentiate recurrent tumor versus radiation necrosis, and in distinguishing be-tween neoplasm and infection such as toxoplasmosis. Many studies exist in the literature establishing the validity of DSC MR imaging in tumor imaging. A recent study by Wolf et al3
found a 0.83 correlation between ASL and DSC MR imaging in measuring CBF within the tumor region. ASL maps consis-tently show elevated signal intensity in enhancing tumors such as high-grade gliomas and meningiomas, and studies have shown that perfusion MR imaging techniques can distinguish among high-grade gliomas, low-grade gliomas, and metastasis on the basis of various patterns of flow.3-5
The methods for data acquisition and analysis are de-scribed in detail in Part 1 of this series.1We identified common
patterns of hyperperfusion on the basis of a retrospective
anal-ysis of 3000 clinical pulsed ASL cases acquired consecutively during a 12-month period.
Discussion
Hyperperfusion Patterns Encountered with Clinical Spin-Tag Perfusion Imaging
Focally Increased Signal Intensity.Focally increased sig-nal intensity may be produced by true hyperperfusion or by artifact such as motion or intravascular spin-label. ASL is sen-sitive in depicting hyperperfusion in a number of conditions related to stroke, tumor, seizure, or loss of autoregulatory function of blood vessels. The regional hyperperfusion impli-cated in hypertensive encephalopathy, posterior reversible en-cephalopathy syndrome (PRES), and related syndromes6can
be readily disclosed by ASL, which on serial follow-up can demonstrate the waxing and waning time course often ob-served in these conditions. Relative high signal intensity may also occur in a regional or lobar distribution under normal physiologic conditions, such as with visual cortex activation in the occipital lobes.
Luxury Perfusion.Localized autoregulatory dysfunction occurs in the setting of stroke and is often visualized on
con-From the Departments of Radiology (A.R.D., J.M.P., J.H.B., J.A.M.) and Biomedical Engineering (R.A.K., H.T.), Wake Forest University School of Medicine, Winston-Salem, NC.
This work was supported by the Human Brain Project and the National Institute of Biomedical Imaging and Bioengineering through grant numbers EB004673, EB004673– 02S2, and EB003880 and was also partially supported by the Center for Biomolecular Imaging of Wake Forest University School of Medicine.
Please address correspondence to Joseph A. Maldjian, MD, Wake Forest University, Department of Radiology, Medical Center Blvd, Winston-Salem, NC 27157; e-mail: [email protected]
DOI 10.3174/ajnr.A1034
Hyperperfusion patterns on clinical spin-tag perfusion imaging
Hyperperfusion Pattern Causes
Focal Luxury perfusion
Reperfusion
Spontaneous recanalization Thrombolytic-induced recanalization Seizure activity (ictal or peri-ictal) Tumor
Vascular malformation
Localized autoregulatory dysfunction PRES
Migraine Postendarterectomy Inflammation Infection
Global Young age
Robust CBF Hypercapnia
Post-carotid endarterectomy Post-anoxic insult
ventional MR imaging as intravascular enhancement in the infarcted territory.7Sluggish transit of intravascular arterial
spins may account for the focal high ASL signal intensity often apparent in areas of acute infarct. Other causes of focal auto-regulatory dysfunction include the PRES and post-carotid endarterectomy hyperperfusion syndrome.8ASL is very
sensi-tive to states of hyperperfusion, which are depicted as focal areas of signal-intensity increase in the region of luxury per-fusion (Fig 1). In severe cases of PRES, initial hyperperper-fusion may give way to infarction and subsequent bilateral parieto-occipital perfusion deficits. Concomitant parenchymal hem-orrhage may create susceptibility artifact and contribute to the appearance of hypoperfusion.
Reperfusion.Because it is not subject to artifacts due to the recirculation of tracer, ASL is well suited for the serial assess-ment of brain perfusion in the setting of acute stroke and can provide important prognostic information regarding reperfu-sion. Restoration of flow to regions of the ischemic core or penumbra can be seen as high signal intensity on ASL follow-ing spontaneous recanalization of clot, administration of sys-temic or transcatheter thrombolytics, or extracranial-to-intra-cranial bypass. These areas of reperfusion can be distinguished from stagnant intravascular spin-label because they often
cor-respond to anatomic structures such as the basal ganglia, thal-amus, insula, or a cortical gyrus. Figure 2 demonstrates focal hyperperfusion in the left middle cerebral artery (MCA) terri-tory 12 hours following the administration of systemic throm-bolytic agents, whereas spontaneous reperfusion of an in-farcted territory is shown in Fig 3.
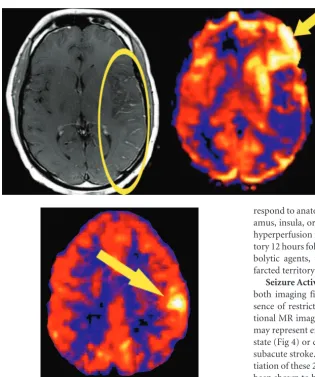
Seizure Activity.Seizure activity can mimic acute stroke in both imaging findings and clinical presentation. In the ab-sence of restricted diffusion or a discrete lesion on conven-tional MR imaging, focally increased signal intensity on ASL may represent either a complex partial seizure in the postictal state (Fig 4) or clot lysis and late reperfusion in the setting of subacute stroke. Often the clinical history will allow differen-tiation of these 2 entities. Ictal single-photon emission CT has been shown to be 90% sensitive in the depiction of hyperper-fusion in the ictal phase of temporal lobe epilepsy. In addition, in a meta-analysis by Lee et al,9late postictal hyperperfusion
was found in the epileptogenic zone in more than half of pa-tients with seizures. ASL has advantages in that both anatomic and perfusion MR images can be obtained in the same setting. The mechanism of hyperperfusion due to seizure activity is not completely understood but may be related to transient loss of autoregulatory function in the surrounding vasculature or to the release of excitatory neurostimulators such as glutamate in areas of increased neuronal firing.9In the seizure evalua-tion, ASL complements the traditional evaluation with elec-troencephalography (EEG), anatomic imaging, and nuclear medicine studies.
Subdural Hematoma.Subdural hematomas can also show
hyperperfusion in the adjacent cortex on pulsed arterial spin-labeling (Fig 5). This may be secondary to compression of the cortical venous outflow or malfunction of the local cerebral regulatory mechanisms secondary to trauma.
Tumor.Tumor evaluation with ASL has been studied, and correlations between flow and tumor grade have been made.10,11The ability to quantify perfusion with ASL poten-tially allows monitoring of tumor response to therapy. Addi-tionally, ASL can help distinguish areas of tumor recurrence from areas of radiation necrosis. Other cerebral perfusion methods that rely on dynamic bolus techniques require large-bore intravenous access devices and adequate renal function. In patients with metastatic disease or primary neoplasms who Fig 1.Luxury perfusion. Asymmetric intravascular enhance-ment of the cortical vessels in a large infarcted left MCA territory (ellipse) on the postcontrast T1-weighted images. ASL CBF map demonstrates hyperperfusion in the left cau-date, insula, and frontal lobe (arrow). The posterior parietal regions are hypoperfused.
Fig 2.Reperfusion. An 80-year-old woman presenting with right hemiparesis met the criteria for systemic thrombolytics. ASL CBF map acquired approximately 12 hours after tissue plasminogen activator administration reveals localized hyperperfusion within the left MCA territory (arrow). Perfusion is otherwise preserved throughout the left hemisphere.
REVIEW
[image:2.594.52.368.36.413.2]have undergone extensive chemotherapy or in patients with renal insufficiency, routine follow-up examinations with large-bore intravenous devices may not be practical. Addi-tionally, because ASL requires no contrast, the complication of nephrogenic systemic fibrosis can be avoided. Surgical crani-otomy closure devices can hinder perfusion evaluation sec-ondary to susceptibility artifacts. As modifications in closure
device materials are made, perfusion imaging evaluation adja-cent to the craniotomy site is likely to improve.
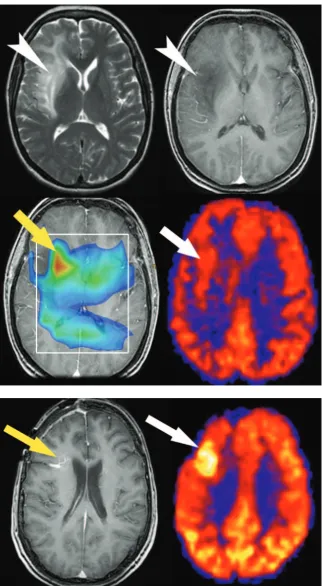
Figures 6 – 8 demonstrate high-flow states on ASL associ-ated with meningioma, glioblastoma multiforme, and ependymal metastases, respectively. Perfusion and T1-weighted enhancement mismatches may be used to indicate diffusely infiltrating tumors such as gliomatosis cerebri (Fig Fig 3.Hyperperfused stroke territory on ASL. A 73-year-old woman with atrial fibrillation and embolic infarcts in the left posterior cerebral artery and posterior watershed territories. Punctate areas of restricted diffusion are seen (left,yellow arrow). ASL map (right) shows gyral hyperperfusion in the left hemisphere (white arrow). Hypoperfusion is also seen in the right posterior watershed territory.
Fig 4.Hyperperfused seizure territory. A 6-year-old boy with a history of Landau-Kleffner syndrome who presented with complex partial seizures causing paresis of the right face and upper extremity. ASL shows regional hyperperfusion in the left parietal hemisphere associated with the ictal phase of seizure activity (arrows). EEG confirmed almost continuous seizure activity within the left hemisphere. Findings of the diffusion-weighted sequence were normal (not shown). Symptoms improved on antiepileptic medications and a course of intravenous immunoglobulin.
[image:3.594.51.537.49.614.2]9). On ASL, artifact must be excluded as a cause of the per-ceived absence of increased flow within a tumor because local susceptibility artifact, blood products, or masking effect may obscure hyperperfused foci within lesions.
Vascular Malformations. Localized hyperperfusion may
occur in the setting of vascular malformations, depending on the size and type of vessels involved and the rate of flow through the
lesion. Hyperperfusion can be seen in both arteriovenous malfor-mations and venous angioma (Fig 10). In addition to assessing flow within the lesion itself, various states of hyperemia and isch-emia in adjacent regions occurring in both the pre- and postop-erative settings may be disclosed with ASL.12,13
Localized Autoregulatory Dysfunction.PRES and
PRES-like syndromes can occur spontaneously or in association with Fig 6.A 57-year-old woman with atypical meningioma. An avidly enhancing falcine-based mass is demonstrated on the postgadolinium image (left). ASL map demonstrates ringlike hyperperfusion corresponding to the outer margins of the tumor (right,arrow).
Fig 7.Hyperperfusion of a glioblastoma multiforme. Axial postgadolinium T1-weighted image demonstrates avid en-hancement of a high-grade neoplasm centered in the genu of the corpus callosum. ASL CBF map demonstrates high signal intensity corresponding to increased flow within the periph-ery of the tumor (arrow).
[image:4.594.63.452.35.635.2]uncontrolled hypertension, eclampsia, and cyclosporine tox-icity and as a complication of certain chemotherapeutic regi-mens.14-16A loss of autoregulatory control occurs in these
syndromes, and initial attempts to maintain perfusion pres-sure result in arteriolar vasoconstriction. Hyperperfusion fol-lows and results in reversible edema, more commonly in the vertebrobasilar vascular territories likely because of the rela-tively fewer perivascular sympathetic nerves in this area.14
Fig-ure 11 demonstrates changes with time in a 31-year-old pa-tient with PRES, including initial vasoconstriction and hypoperfusion followed by rebound hyperperfusion. ASL is a robust technique in the evaluation of hyperperfusion syn-dromes due to its repeatability and its strength in depicting high-flow states. Figure 12 demonstrates a case of post-endar-terectomy hyperperfusion syndrome in a patient who had re-cently undergone ipsilateral carotid endarterectomy. This is a Fig 9.ASL hyperperfusion in infiltrative tumor. A 49-year-old woman who presented with seizures had an infiltrative T2 (upper left) hyperintense lesion in the right frontal lobe without significant enhancement on postgadolinium T1-weighted (upper right) imaging (arrowheads). Multivoxel MR spectroscopy (bottom left) reveals an elevated choline/crea-tine ratio (3:2) consistent with gliomatosis cerebri (yellow arrow). ASL CBF map (bottom right) demonstrates increased signal intensity in the subcortical white matter corresponding to tumor (white arrow).
[image:5.594.55.378.40.627.2]well-described phenomenon using other perfusion tech-niques17and is presumed to result from loss of autoregulatory
function.
Globally Increased Signal Intensity
Increases in signal intensity on ASL maps commonly occur on a global scale and may be secondary to physiologic, pathologic, or artifactual causes. Pediatric patients and healthy adults with robust brain perfusion are examples of individuals with true physiologic increases in global CBF. Disease states such as hy-percapnia and anoxia can result in loss of autoregulatory con-trol and striking hyperperfusion, which might have the ap-pearance of a “superscan.” Finally, artifacts must be excluded when one is confronted with higher than expected global sig-nal intensity.
Robust CBF.Wide variations in global CBF may occur
within the clinical population, even among healthy individu-als. Although the normal range of gray matter CBF in the lit-erature varies between 40 and 70 mL/100 g per minute,18
[image:6.594.55.535.41.437.2]dif-fusely intense ASL signal intensity may be seen in some healthy individuals with global gray matter CBF values exceeding 100 mL/100 g per minute. Performing ASL at higher field strengths predisposes to improved signal-to-noise ratio and less decay of the spin tag due to prolongation of T1 at 3T, yielding high-Fig 11.Evolution of perfusion changes in PRES in a 31-year-old woman.A, Initial images: high signal intensity on the initial diffusion-weighted image (left) represents T2 shinethrough secondary to edema seen on the apparent diffusion coefficient (ADC) images (center) in the occipital cortices. A corresponding ASL map (right) reveals marked flow asymmetry with hypoperfusion in the left occipital lobe (white arrow).B, At 2-week follow-up, diffusion and ADC images show new posterior restricted diffusion (yellow arrows), and bilateral hyperperfusion is now evident on perfusion images (right,white arrow).
[image:6.594.91.247.493.650.2]quality ASL maps in a larger percentage of cases. Furthermore, ASL in children consistently demonstrates increased global CBF, a phenomenon discussed in detail in Part 1 of this series.1
Global Cerebral Hyperperfusion.Global cerebral hyper-perfusion has been reported to occur as a complication of embolic stroke, carotid endarterectomy, and head injury.17,19 Acute restoration of flow above normal perfusion pressures may lead to loss of autoregulation and may result in elevated global CBF. Postischemic cerebral hyperemia is a
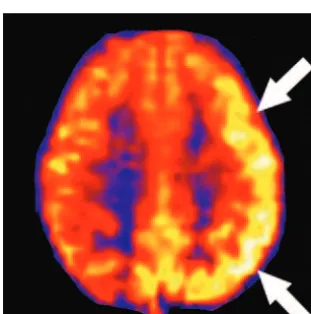
phenome-non that is known to occur and appears to be mediated by trigeminal neural input.20Figure 13 demonstrates a case of paradoxically high global CBF in the setting of restricted dif-fusion in multiple vascular territories following cardiopulmo-nary arrest.
[image:7.594.60.424.38.615.2]Hypercapnia.Hypercapnia is a potent cerebral vasodila-tory stimulus. Many studies in clinical research and practice have used hypercapnia challenge to produce global increases in CBF and determine cerebral vascular reserve.18,21Research
Fig 13.Paradoxical hyperperfusion following diffuse anoxic insult. A 69-year-old woman sustained a 10- to 15-minute period of pulseless electric activity. Diffusion-weighted im-age reveals multiple infarcts in the bilateral basal ganglia and watershed zones (top). ASL maps (bottom) show global hyperperfusion consistent with postischemic hyperemia.
studies have shown that even small elevations in end-tidal car-bon dioxide (CO2) on the order of 5-8 mm Hg are capable of
producing measurable increases in global CBF. In the clinical population, common conditions that can result in arterial blood gas disturbances include chronic obstructive nary disease, adult respiratory distress syndrome, and pulmo-nary edema. Increases of 30 mm Hg or more from baseline can occur in these patients and may significantly increase global CBF. Figure 14 demonstrates a case of unusually high global CBF for age in a patient with severe pulmonary edema and marked hypercapnia (PCO2⫽76) on arterial blood gas
anal-ysis on the day of the MR imaging.
Conclusion
The unique property of repeatability in ASL naturally lends itself to the evaluation of pathologic states with dynamic per-fusion anomalies, such as infarct, tumor, seizure, and vascular instability. In our experience, ASL has been quite sensitive to states of increased CBF, which have often led to the creation of CBF maps with high signal-to-noise ratios. In summary, Parts 1 (techniques and artifacts), 2 (hypoperfusion patterns), and 3 (hyperperfusion patterns) of this review series describe our current experience with ASL based on the largest clinical sam-ple to date.1,2As MR imaging manufacturers begin to offer
this new imaging technique and it is incorporated into clinical practice, knowledge of the typical artifacts, hypoperfusion, and hyperperfusion patterns will aid in the interpretation of perfusion images.
Acknowledgment
We thank Kathy Pearson for help with computer programming.
References
1. Deibler AR, Pollock JM, Kraft RA, et al.Arterial spin labeling in routine clinical practice, Part 1: Technique and artifacts. AJNR Am J Neuroradiol
2008;29:1228 –34
2. Deibler AR, Pollock JM, Kraft RA, et al.Arterial spin-labeling in routine clin-ical practice, Part 2: Hypoperfusion patterns. AJNR Am J Neuroradiol
2008;29:1235– 41
3. Wolf RL, Alsop DC, McGarvey ML, et al.Susceptibility contrast and arterial spin labeled perfusion MRI in cerebrovascular disease.J Neuroimaging
2003;13:17–27
4. Warmuth C, Gunther M, Zimmer C.Quantification of blood flow in brain tumors: comparison of arterial spin labeling and dynamic susceptibility-weighted contrast-enhanced MR imaging.Radiology2003;228:523–32 5. Weber MA, Gunther M, Lichy MP, et al.Comparison of arterial spin-labeling
techniques and dynamic susceptibility-weighted contrast-enhanced MRI in perfusion imaging of normal brain tissue.Invest Radiol2003;38:712–18 6. Schwartz RB.Hyperperfusion encephalopathies: hypertensive
encephalopa-thy and related conditions.Neurologist2002;8:22–34
7. Elster AD, Moody DM.Early cerebral infarction: gadopentetate dimeglumine enhancement.Radiology1990;177:627–32
8. Wagner WH, Cossman DV, Farber A, et al.Hyperperfusion syndrome after carotid endarterectomy.Ann Vasc Surg2005;19:479 – 86
9. Lee SK, Lee SY, Yun CH, et al.Ictal SPECT in neocortical epilepsies: clinical usefulness and factors affecting the pattern of hyperperfusion.Neuroradiology
2006;48:678 – 84
10. Brown GG, Clark C, Liu TT.Measurement of cerebral perfusion with arterial spin labeling. Part 2. Applications.J Int Neuropsychol Soc2007;13:526 –38 11. Kim HS, Kim SY.A prospective study on the added value of pulsed arterial
spin-labeling and apparent diffusion coefficients in the grading of gliomas.
AJNR Am J Neuroradiol2007;28:1693–99
12. Hacein-Bey L, Nour R, Pile-Spellman J, et al.Adaptive changes of autoregula-tion in chronic cerebral hypotension with arteriovenous malformaautoregula-tions: an acetazolamide-enhanced single-photon emission CT study.AJNR Am J Neu-roradiol1995;16:1865–74
13. Young WL, Kader A, Ornstein E, et al.Cerebral hyperemia after arteriovenous malformation resection is related to “breakthrough” complications but not to feeding artery pressure: The Columbia University Arteriovenous Malfor-mation Study Project.Neurosurgery1996;38:1085–93, discussion 1093– 85 14. Casey SO, McKinney A, Teksam M, et al.CT perfusion imaging in the
manage-ment of posterior reversible encephalopathy.Neuroradiology2004;46:272–76 15. Gupta V.Silent or non-clinical infarct-like lesions in the posterior circulation territory in migraine: brain hypoperfusion or hyperperfusion? Brain
2006;129:E39
16. Rogers LR.Cerebrovascular complications in cancer patients.Neurol Clin
2003;21:167–92
17. Macfarlane R, Moskowitz MA, Sakas DE, et al.The role of neuroeffector mech-anisms in cerebral hyperperfusion syndromes.J Neurosurg1991;75:845–55 18. Ito H, Kanno I, Ibaraki M, et al.Changes in human cerebral blood flow and
cerebral blood volume during hypercapnia and hypocapnia measured by positron emission tomography.J Cereb Blood Flow Metab2003;23:665–70 19. Muehlschlegel S, Voetsch B, Singhal AB.CT angiography and CT perfusion in
post-CEA hyperperfusion syndrome.Neurology2007;68:1437
20. Moskowitz MA, Macfarlane R, Tasdemiroglu E, et al.Neurogenic control of the cerebral circulation during global ischemia. Stroke 1990;21(11 suppl):III168 –71