4-Methoxy-3-(methoxymethyl)benzalde-hyde
Jing-Chao Zhang, Jun Sun, Juan Zhang, Guang-Lin Liu and Cheng Guo*
Department of Applied Chemistry, College of Science, Nanjing University of Technology, Nanjing 211816, People’s Republic of China
Correspondence e-mail: [email protected]
Received 7 December 2012; accepted 11 December 2012
Key indicators: single-crystal X-ray study;T= 293 K; mean(C–C) = 0.005 A˚;
Rfactor = 0.063;wRfactor = 0.165; data-to-parameter ratio = 14.7.
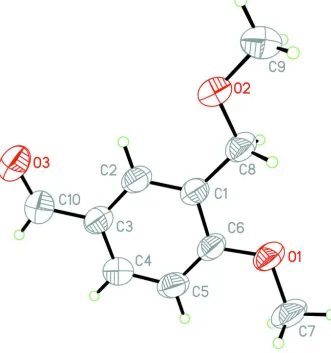
In the title compound, C10H12O3, the dihedral angle between the benzene ring and the methoxymethyl side chain is 9.7 (2).
The O atom of the aldehyde group and the C atom of the methoxy group deviate from the plane of the ring by 0.039 (3) and 0.338 (4) A˚ , respectively. The only intermolecular inter-actions are very weak C—H interactions.
Related literature
For the synthesis and applications of the title compound see: Jonaliet al.(2003).
Experimental
Crystal data
C10H12O3
Mr= 180.20
Monoclinic,P21=c
a= 7.8100 (16) A˚
c= 14.510 (3) A˚ = 98.01 (3)
V= 942.3 (3) A˚3
Z= 4
= 0.09 mm T= 293 K
0.300.200.10 mm
Data collection
Enraf–Nonius CAD-4 diffractometer
Absorption correction: scan (Northet al., 1968) Tmin= 0.973,Tmax= 0.991
1860 measured reflections
1729 independent reflections 860 reflections withI> 2(I) Rint= 0.099
3 standard reflections every 200 reflections
intensity decay: 1%
Refinement
R[F2> 2(F2)] = 0.063
wR(F2) = 0.165 S= 1.01 1729 reflections
118 parameters
H-atom parameters constrained
max= 0.19 e A˚
3
min=0.18 e A˚
3
Table 1
Hydrogen-bond geometry (A˚ ,).
Cg1 is the centroid of the C1–C6 ring.
D—H A D—H H A D A D—H A
C7—H7B Cg1i
0.96 2.84 3.650 (5) 143
C8—H8A Cg1ii
0.97 2.97 3.731 (3) 136
Symmetry codes: (i)xþ1;y1 2;zþ
1
2; (ii)xþ1;y;z.
Data collection: CAD-4 Software (Enraf–Nonius, 1985); cell refinement: CAD-4 Software; data reduction: XCAD4 (Harms & Wocadlo, 1995); program(s) used to solve structure: SHELXS97 (Sheldrick, 2008); program(s) used to refine structure:SHELXL97 (Sheldrick, 2008); molecular graphics:SHELXTL(Sheldrick, 2008); software used to prepare material for publication:SHELXTL.
The authors thank the Center of Testing and Analysis, Nanjing University, for the data collection.
Supplementary data and figures for this paper are available from the IUCr electronic archives (Reference: HB7010).
References
Enraf–Nonius (1985).CAD-4 Software. Enraf–Nonius, Delft, The Nether-lands.
Harms, K. & Wocadlo, S. (1995).XCAD4. University of Marburg, Germany. Jonali, G., Naleen, B. & Amrit, G. (2003).J. Chem. Res.S, 200–203. North, A. C. T., Phillips, D. C. & Mathews, F. S. (1968).Acta Cryst.A24, 351–
359.
Sheldrick, G. M. (2008).Acta Cryst.A64, 112–122. Structure Reports
Online
supporting information
Acta Cryst. (2013). E69, o112 [https://doi.org/10.1107/S1600536812050350]
4-Methoxy-3-(methoxymethyl)benzaldehyde
Jing-Chao Zhang, Jun Sun, Juan Zhang, Guang-Lin Liu and Cheng Guo
S1. Experimental
The title compound, (I) was prepared by the literature method (Jonali et al. 2003). Colourless blocks were obtained by
dissolving (I) (0.18 g, 1.0 mmol) in acetone (25 ml) and evaporating the solvent slowly at room temperature for about 7
d.
S2. Refinement
H atoms were positioned geometrically and refined as riding groups with Uiso(H) = xUeq(C), where x = 1.2 for aromatic H,
Figure 1
Figure 2
A packing diagram of (I).
4-Methoxy-3-(methoxymethyl)benzaldehyde
Crystal data
C10H12O3 Mr = 180.20
Monoclinic, P21/c
Hall symbol: -P 2ybc
a = 7.8100 (16) Å
b = 8.3970 (17) Å
c = 14.510 (3) Å
β = 98.01 (3)°
V = 942.3 (3) Å3 Z = 4
F(000) = 384
Dx = 1.270 Mg m−3
Melting point: 341 K
Mo Kα radiation, λ = 0.71073 Å Cell parameters from 25 reflections
θ = 9–13°
Enraf–Nonius CAD-4 diffractometer
Radiation source: fine-focus sealed tube Graphite monochromator
ω/2θ scans
Absorption correction: ψ scan (North et al., 1968)
Tmin = 0.973, Tmax = 0.991
1860 measured reflections
1729 independent reflections 860 reflections with I > 2σ(I)
Rint = 0.099
θmax = 25.4°, θmin = 2.6° h = 0→9
k = 0→10
l = −17→17
3 standard reflections every 200 reflections intensity decay: 1%
Refinement
Refinement on F2
Least-squares matrix: full
R[F2 > 2σ(F2)] = 0.063 wR(F2) = 0.165 S = 1.01 1729 reflections 118 parameters 0 restraints
Primary atom site location: structure-invariant direct methods
Secondary atom site location: difference Fourier map
Hydrogen site location: inferred from neighbouring sites
H-atom parameters constrained
w = 1/[σ2(F
o2) + (0.070P)2]
where P = (Fo2 + 2Fc2)/3
(Δ/σ)max < 0.001
Δρmax = 0.19 e Å−3
Δρmin = −0.18 e Å−3
Special details
Geometry. All e.s.d.'s (except the e.s.d. in the dihedral angle between two l.s. planes) are estimated using the full covariance matrix. The cell e.s.d.'s are taken into account individually in the estimation of e.s.d.'s in distances, angles and torsion angles; correlations between e.s.d.'s in cell parameters are only used when they are defined by crystal symmetry. An approximate (isotropic) treatment of cell e.s.d.'s is used for estimating e.s.d.'s involving l.s. planes.
Refinement. Refinement of F2 against ALL reflections. The weighted R-factor wR and goodness of fit S are based on F2,
conventional R-factors R are based on F, with F set to zero for negative F2. The threshold expression of F2 > σ(F2) is used
only for calculating R-factors(gt) etc. and is not relevant to the choice of reflections for refinement. R-factors based on F2
are statistically about twice as large as those based on F, and R- factors based on ALL data will be even larger.
Fractional atomic coordinates and isotropic or equivalent isotropic displacement parameters (Å2)
x y z Uiso*/Ueq
O1 0.3742 (3) −0.2060 (2) 0.10208 (17) 0.0606 (7) C1 0.4323 (4) 0.0653 (3) 0.1125 (2) 0.0449 (8) O2 0.2282 (3) 0.2507 (3) 0.03860 (18) 0.0736 (8) C2 0.5453 (4) 0.1885 (4) 0.1380 (2) 0.0512 (9)
H2A 0.5092 0.2927 0.1250 0.061*
O3 0.8048 (3) 0.4313 (3) 0.1968 (2) 0.0838 (10) C3 0.7125 (5) 0.1612 (4) 0.1829 (2) 0.0531 (9) C4 0.7648 (4) 0.0059 (4) 0.2027 (3) 0.0608 (10)
H4A 0.8752 −0.0133 0.2339 0.073*
C5 0.6561 (5) −0.1209 (4) 0.1772 (3) 0.0579 (10)
H5A 0.6928 −0.2248 0.1904 0.070*
C6 0.4919 (4) −0.0912 (3) 0.1318 (2) 0.0494 (9) C7 0.4335 (5) −0.3667 (4) 0.1007 (3) 0.0688 (12)
H7C 0.5196 −0.3749 0.0598 0.103* C8 0.2523 (4) 0.0900 (3) 0.0654 (2) 0.0547 (9)
H8A 0.2307 0.0221 0.0110 0.066*
H8B 0.1709 0.0614 0.1075 0.066*
C9 0.0623 (5) 0.2781 (4) −0.0121 (3) 0.0835 (13)
H9A 0.0509 0.3887 −0.0286 0.125*
H9B −0.0248 0.2497 0.0256 0.125*
H9C 0.0485 0.2145 −0.0676 0.125*
C10 0.8314 (5) 0.2919 (5) 0.2107 (3) 0.0680 (11)
H10A 0.9390 0.2644 0.2425 0.082*
Atomic displacement parameters (Å2)
U11 U22 U33 U12 U13 U23
O1 0.0666 (16) 0.0309 (13) 0.0856 (18) −0.0025 (11) 0.0151 (13) −0.0033 (11) C1 0.050 (2) 0.0358 (18) 0.052 (2) −0.0002 (16) 0.0158 (16) −0.0018 (14) O2 0.0662 (17) 0.0371 (14) 0.112 (2) 0.0032 (13) −0.0070 (15) 0.0046 (13) C2 0.058 (2) 0.0342 (17) 0.063 (2) 0.0024 (16) 0.0133 (18) 0.0005 (15) O3 0.082 (2) 0.0481 (16) 0.118 (3) −0.0127 (14) 0.0024 (17) −0.0007 (16) C3 0.058 (2) 0.0404 (19) 0.062 (2) 0.0006 (18) 0.0120 (18) −0.0036 (17) C4 0.055 (2) 0.053 (2) 0.075 (3) 0.0049 (19) 0.0107 (19) −0.0041 (19) C5 0.064 (2) 0.040 (2) 0.073 (3) 0.0082 (18) 0.019 (2) 0.0009 (18) C6 0.057 (2) 0.0321 (18) 0.061 (2) −0.0024 (16) 0.0157 (19) −0.0034 (15) C7 0.084 (3) 0.0297 (18) 0.097 (3) 0.0005 (18) 0.029 (2) −0.0046 (18) C8 0.060 (2) 0.0332 (18) 0.072 (3) −0.0042 (16) 0.0143 (19) 0.0049 (16) C9 0.066 (3) 0.062 (3) 0.119 (4) 0.016 (2) 0.000 (3) 0.004 (2) C10 0.060 (2) 0.058 (2) 0.084 (3) −0.007 (2) 0.006 (2) −0.003 (2)
Geometric parameters (Å, º)
O1—C6 1.360 (4) C4—H4A 0.9300
O1—C7 1.427 (3) C5—C6 1.380 (4)
C1—C2 1.376 (4) C5—H5A 0.9300
C1—C6 1.409 (4) C7—H7A 0.9600
C1—C8 1.490 (4) C7—H7B 0.9600
O2—C8 1.410 (3) C7—H7C 0.9600
O2—C9 1.416 (4) C8—H8A 0.9700
C2—C3 1.395 (5) C8—H8B 0.9700
C2—H2A 0.9300 C9—H9A 0.9600
O3—C10 1.201 (4) C9—H9B 0.9600
C3—C4 1.385 (4) C9—H9C 0.9600
C3—C10 1.457 (5) C10—H10A 0.9300
C4—C5 1.380 (4)
C6—O1—C7 118.0 (3) O1—C7—H7B 109.5
C2—C1—C6 117.8 (3) H7A—C7—H7B 109.5
C2—C1—C8 123.2 (3) O1—C7—H7C 109.5
C1—C2—C3 121.7 (3) O2—C8—C1 109.9 (3)
C1—C2—H2A 119.2 O2—C8—H8A 109.7
C3—C2—H2A 119.2 C1—C8—H8A 109.7
C4—C3—C2 118.8 (3) O2—C8—H8B 109.7
C4—C3—C10 119.6 (3) C1—C8—H8B 109.7
C2—C3—C10 121.6 (3) H8A—C8—H8B 108.2
C5—C4—C3 121.2 (3) O2—C9—H9A 109.5
C5—C4—H4A 119.4 O2—C9—H9B 109.5
C3—C4—H4A 119.4 H9A—C9—H9B 109.5
C4—C5—C6 119.0 (3) O2—C9—H9C 109.5
C4—C5—H5A 120.5 H9A—C9—H9C 109.5
C6—C5—H5A 120.5 H9B—C9—H9C 109.5
O1—C6—C5 124.4 (3) O3—C10—C3 126.8 (4)
O1—C6—C1 114.1 (3) O3—C10—H10A 116.6
C5—C6—C1 121.5 (3) C3—C10—H10A 116.6
O1—C7—H7A 109.5
C6—C1—C2—C3 −1.0 (5) C4—C5—C6—C1 −1.0 (5)
C8—C1—C2—C3 179.3 (3) C2—C1—C6—O1 −178.2 (3)
C1—C2—C3—C4 −0.6 (5) C8—C1—C6—O1 1.5 (4)
C1—C2—C3—C10 −179.4 (3) C2—C1—C6—C5 1.8 (5)
C2—C3—C4—C5 1.4 (5) C8—C1—C6—C5 −178.4 (3)
C10—C3—C4—C5 −179.8 (3) C9—O2—C8—C1 176.0 (3)
C3—C4—C5—C6 −0.6 (5) C2—C1—C8—O2 9.5 (4)
C7—O1—C6—C5 −13.0 (5) C6—C1—C8—O2 −170.2 (3)
C7—O1—C6—C1 167.1 (3) C4—C3—C10—O3 178.7 (4)
C4—C5—C6—O1 179.0 (3) C2—C3—C10—O3 −2.5 (6)
Hydrogen-bond geometry (Å, º)
Cg1 is the centroid of the C1–C6 ring.
D—H···A D—H H···A D···A D—H···A
C7—H7B···Cg1i 0.96 2.84 3.650 (5) 143
C8—H8A···Cg1ii 0.97 2.97 3.731 (3) 136