Rising concentration of atmospheric CO2 is expected to increase the growth and productiv-ity of C3 crops like rice and wheat (Kimball et al. 2002, Sujatha et al. 2008). Conversely, associated rise in air temperature may reduce the crop yield, particularly in tropical and subtropical countries like India (Manoj-Kumar et al. 2011b). Thus, to counter the yield reducing effect of atmospheric warming, benefits of carbon fertilisation under rising CO2 must be realized in Indian agriculture. Elevated CO2 (EC) studies, however, suggest that EC-induced growth stimulation cannot sustain on nutrient deficient soil (Campbell and Sage 2006), implying that nutrients’ application may have to be increased in future to materialize the carbon fertilisation effect of higher CO2 on crop pro-ductivity (Manoj-Kumar et al. 2011a). Given the already existing widespread deficiency of available phosphorus (P) in Indian soils, it is expected to become a critical nutrient to regulate the responses of crop plants under rising CO2 (Manoj-Kumar
et al. 2011b). Meeting the EC-induced increase in plant P requirement will, therefore, be important for sustaining crop productivity under the future elevation of atmospheric CO2 and temperature in India.
There could be broadly two possible ways to meet the enhanced P requirement by crops; first, by increasing the doses of P fertilization, and sec-ond, by plant’s adaptation in terms of its ability to extract P from soil (i.e. P acquisition efficiency), and to convert the absorbed P into grain/biomass yield (i.e. P utilization efficiency) (Raghothama 1999). As P fertilisation involves considerable economic and environmental cost (Vance et al. 2003), it is pertinent to investigate the use effi-ciency of applied fertilizer-P in a changing climate. Assessment of P uptake- and utilization efficiency is also required to predict the possibility of plants adaptation in response to enhanced P require-ment under the future scenario of atmospheric CO2 and temperature, particularly in the soil and
Effect of elevated CO
2
and temperature on phosphorus
efficiency of wheat grown in an Inceptisol of subtropical
India
Manoj-Kumar
1, A. Swarup
1, A.K. Patra
1, J.U. Chandrakala
2, K.M. Manjaiah
11
Division of Soil Science and Agricultural Chemistry, Indian Agricultural Research
Institute, New Delhi, India
2
Division of Plant Physiology, Indian Agricultural Research Institute, New Delhi, India
ABSTRACT
In a phytotron experiment, wheat was grown under two levels of atmospheric CO2 [ambient (385 ppm) vs. elevated (650 ppm)], two levels of temperature (ambient vs. ambient +3°C) superimposed with three levels of phosphorus (P) fertilization: 0, 100, and 200% of recommended dose. Various measures of P acquisition and utilization effi-ciency were estimated at crop maturity. In general, dry matter yields of all plant parts increased under elevated CO2 (EC) and decreased under elevated temperature (ET); however, under concurrently elevated CO2 and tem-perature (ECT), root (+36%) and leaf (+14.7%) dry weight increased while stem (–12.3%) and grain yield (–17.3%) decreased, leading to a non-significant effect on total biomass yield. Similarly, total P uptake increased under EC and decreased under ET, with an overall increase of 17.4% under ECT, signifying higher P requirements by plants grown thereunder. Although recovery efficiency of applied P fertilizer increased by 27%, any possible benefit of this increase was negated by the reduced physiological P efficiency (PPE) and P utilization efficiency (PUtE) under ECT. Overall, there was ~17% decline in P use efficiency (PUE) (i.e. grain yield/applied P) of wheat under ECT.
climatic conditions of India. The current study, therefore, investigates the possible changes in P acquisition and utilization efficiency by wheat under the projected elevation of atmospheric CO2 and temperature in subtropical India.
MATERIAL AND METHODS
Experimental conditions and treatment de-tails. In a factorial CRD experiment in phytotron growth chambers, wheat (Triticum aestivum L. cv. HD-2687) was grown in 1.5 kg capacity pots (3 plants/pot) under two levels of atmospheric CO2 [ambient (385 ppm) vs. elevated (650 ± 10 ppm)] and two levels of temperature (ambient vs. am-bient +3°C) superimposed with three levels of P fertilization: control (no P), 100% (30 mg P/pot) and 200% (60 mg P/pot) of recommended P applied through 32P-tagged DAP. Each of the treatment
combinations (2 CO2 × 2 temperature × 3 P) were replicated thrice. The experimental soil was a Typic Haplustept of subtropical India (New Delhi) with sandy-loam texture and pH of 8.15. It contained 0.48% organic carbon, 203, 31.2 and 221 kg/ha of available N, P and K, respectively. Further details can be seen elsewhere (Manoj-Kumar et al. 2011b). Considering the current (Figure 1) and the pro-jected CO2 and temperature levels in subtropical India, the ambient day/night temperatures (AT) during vegetative and grain filling period were set at 23/9°C and 27/12°C, respectively; ET in the re-spective growth phases were 26/12°C and 30/15°C, respectively, with a variation of ±0.3°C. 12-h pho-toperiod and photon flux density of 600 µmol/m2/s
were maintained inside the chambers. Pots were
regularly watered to avoid moisture stress. They were regularly transferred from one chamber to another, with the required changes in the growth conditions therein. Pots were frequently rotated within the chambers too.
Measurements, calculations and data analysis. Plants were harvested (3 plants/pot from 3 repli-cated pots) at maturity, and separated into root, leaf, stem and grains. Dry weight of plant parts was recorded after drying them in a hot-air oven till constant weight. Samples were digested in a 2:1 mixture of HNO3 and HClO4 and P concentra-tion was determined by molybdo-phosphoric acid method. Radio-assay for 32P activity was carried
out using liquid scintillation counter. Percent P derived from fertilizer (%Pdff ) was calculated as ratio of the specific activities of plant material and the fertilizer standard. Various measures of P
0 10 20 30 40
Nov Dec Jan Feb March April
Tem
pe
ra
tu
re
(°
C
)
[image:2.595.320.504.53.223.2]Months Maximum Minimum
Figure 1. Mean maximum and minimum temperature of wheat-growing months in New Delhi (average of 2001 to 2007) as recorded by meteorological observatory of IARI, New Delhi
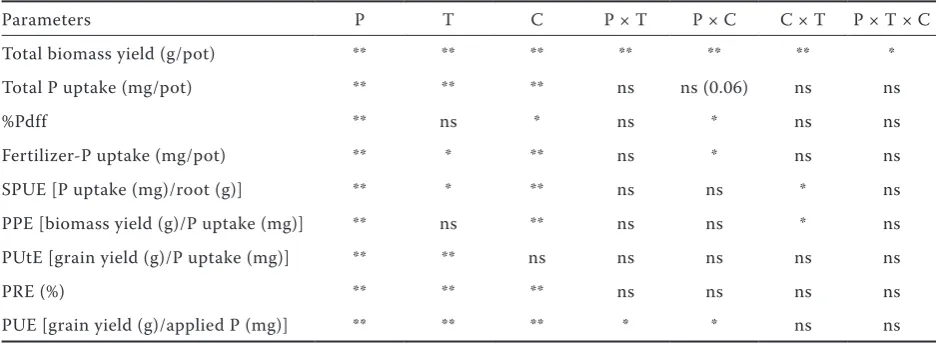
Table 1. Significance of phosphorus (P), temperature (T) and CO2 (C) effects on various parameters under study
Parameters P T C P × T P × C C × T P × T × C
Total biomass yield (g/pot) ** ** ** ** ** ** *
Total P uptake (mg/pot) ** ** ** ns ns (0.06) ns ns
%Pdff ** ns * ns * ns ns
Fertilizer-P uptake (mg/pot) ** * ** ns * ns ns
SPUE [P uptake (mg)/root (g)] ** * ** ns ns * ns
PPE [biomass yield (g)/P uptake (mg)] ** ns ** ns ns * ns
PUtE [grain yield (g)/P uptake (mg)] ** ** ns ns ns ns ns
PRE (%) ** ** ** ns ns ns ns
PUE [grain yield (g)/applied P (mg)] ** ** ** * * ns ns
ns – not significant; *P < 0.05; **P < 0.01; PRE – P recovery efficiency; SPUE – specific P uptake efficiency; PPE – physiological P efficiency; PUtE – P utilization efficiency; PUE – P use efficiency
[image:2.595.63.533.562.734.2]efficiency were calculated as follows (Doberman
2005): ard statistical methods of Gomez and Gomez (1984). Experimental data were analyzed following stand-Analysis of variance was carried out using statis-tical software MSTATC (version 1.41, Crop and Soil Sciences Department, Michigan, USA). The Duncan’s Multiple Range Test was used to segregate significance of difference among the mean values.
RESULTS AND DISCUSSION
Dry matter yields of wheat. Dry matter yields of all the plant parts increased under EC (root: SPUE = total P uptake in plant (mg P/pot)
root dry weight (g/pot)
PPE = total plant biomass (g/pot) total P uptake in plant (mg P/pot)
PUtE = total grain yield (mg P/pot) total P uptake in plant (mg P/pot)
PRE = total P uptake from fertilizer (mg P/pot) × 100 fertilizer applied (mg P/pot)
[image:3.595.66.532.84.486.2]PUE = total grain yield (g/pot) fertilizer applied (g/pot)
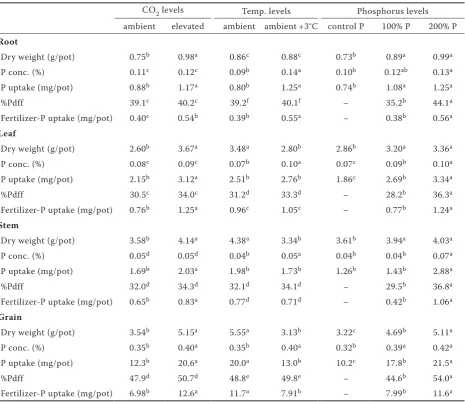
Table 2. Effects of atmospheric CO2 (385 vs. 650 ppm), temperature and phosphorus levels on dry weight, P concentration and P uptake of wheat plant parts
CO2 levels Temp. levels Phosphorus levels
ambient elevated ambient ambient +3°C control P 100% P 200% P
Root
Dry weight (g/pot) 0.75b 0.98a 0.86c 0.88c 0.73b 0.89a 0.99a
P conc. (%) 0.11c 0.12c 0.09b 0.14a 0.10b 0.12ab 0.13a
P uptake (mg/pot) 0.88b 1.17a 0.80b 1.25a 0.74b 1.08a 1.25a
%Pdff 39.1c 40.2c 39.2f 40.1f – 35.2b 44.1a
Fertilizer-P uptake (mg/pot) 0.40c 0.54b 0.39b 0.55a – 0.38b 0.56a
Leaf
Dry weight (g/pot) 2.60b 3.67a 3.48a 2.80b 2.86b 3.20a 3.36a
P conc. (%) 0.08c 0.09c 0.07b 0.10a 0.07c 0.09b 0.10a
P uptake (mg/pot) 2.15b 3.12a 2.51b 2.76b 1.86c 2.69b 3.34a
%Pdff 30.5c 34.0c 31.2d 33.3d – 28.2b 36.3a
Fertilizer-P uptake (mg/pot) 0.76b 1.25a 0.96c 1.05c – 0.77b 1.24a
Stem
Dry weight (g/pot) 3.58b 4.14a 4.38a 3.34b 3.61b 3.94a 4.03a
P conc. (%) 0.05d 0.05d 0.04b 0.05a 0.04b 0.04b 0.07a
P uptake (mg/pot) 1.69b 2.03a 1.98b 1.73b 1.26b 1.43b 2.88a
%Pdff 32.0d 34.3d 32.1d 34.1d – 29.5b 36.8a
Fertilizer-P uptake (mg/pot) 0.65b 0.83a 0.77d 0.71d – 0.42b 1.06a
Grain
Dry weight (g/pot) 3.54b 5.15a 5.55a 3.13b 3.22c 4.69b 5.11a
P conc. (%) 0.35b 0.40a 0.35b 0.40a 0.32b 0.39a 0.42a
P uptake (mg/pot) 12.3b 20.6a 20.0a 13.0b 10.2c 17.8b 21.5a
%Pdff 47.9d 50.7d 48.8e 49.8e – 44.6b 54.0a
Fertilizer-P uptake (mg/pot) 6.98b 12.6a 11.7a 7.91b – 7.99b 11.6a
+30.7%, leaf: +41.2%, stem: +15.6%, grain: +45.5%, and total plant biomass: +32.4%) (Tables 1, 2 and 3), but decreased (except root) under ET (leaf: –19.5%, stem: –23.7%, grain: –43.6% and total plant bio-mass: –28.7%). While EC-induced yield enhance-ment can be attributed to carbon-fertilisation effect (Kimball et al. 2002), yield reduction under ET might have been caused by the thermal stress particularly during grain-filling period of wheat. Interestingly, plant parts responded differently under the concurrently elevated CO2 and tem-perature (ECT). Particularly noticeable were the 36.2% increase in root mass and 17.3% decline in grain yield under ECT. While grain yield reduc-tion under ECT can be ascribed to shortening of grain filling period by 8 days, the higher root mass could be a compensatory response of plant to meet the increased P requirement under high-CO2 atmosphere (BassiriRad et al. 2001).
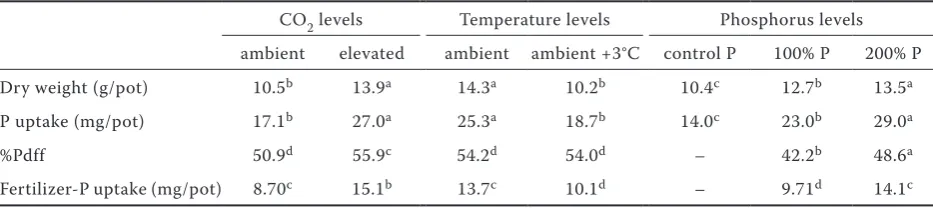
Phosphorus uptake by wheat. P content in plant parts was unaffected under EC (except in grains) but increased under ET (Table 2); as also under ECT. Total P uptake by plant increased by 58% and decreased by 26% under EC and ET respectively, with 17.4% increase under ECT relative to ACT. Increased grain P content (14%) under EC is not in line with the frequently observed reduction in elemental concentration in plant tissues under CO2-enriched atmosphere (Loladze 2002) which is usually ascribed to the ‘biomass dilution effect’. In our study, however, P uptake increased along with the increased biomass under EC, which might have checked the dilution of P in plant tissues. EC-induced increase in critical P concentration of wheat under EC (Rogers et al. 1993) also sup-ports our observation.
Percent (%) Pdff and total P uptake from ferti-lizer. There was a slight increase in %Pdff by whole plant at EC but was unaffected at ET (Table 3). The %Pdff was always higher at 200% P than at 100% P level. Increases in %Pdff under ECT compared
to ACT were non-significant. A massive increase (~74%) in total fertilizer-P uptake under EC was the combined effect of increased P uptake and slightly increased proportion of fertilizer-derived P. Fertilizer-P uptake by plant was ~45% higher at 200% P than at 100% P due to higher %Pdff at 200% P supply. Similarly, there was a substantial increase in fertilizer-P uptake (26.7%) under ECT compared to ACT.
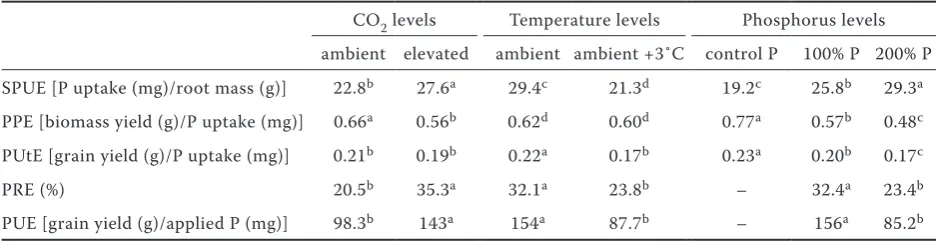
Specific P uptake efficiency (SPUE). Alteration in SPUE is an adaptation mechanism to cope with the conditions of P deficiency. A moderate increase in SPUE of wheat (~21%) under EC (Table 4) might have been induced by the higher P requirement of plant grown thereunder. Unlike our observation, Cure et al. (1988) reported a 22% decline in P uptake efficiency of soybean under doubled CO2 concentration; the finding, however, came out of a solution culture experiment with relatively higher levels of P supply. Contrary to the positive effect of EC, the SPUE of wheat was reduced by ET and ECT compared to their respective ambi-ent treatmambi-ents.
[image:4.595.64.531.642.746.2]Physiological P efficiency (PPE) and P uti-lization efficiency (PUtE). PPE and PUtE are the measures of plant’s ability to convert the ab-sorbed P into total biomass yield and grain yield, respectively. PPE of wheat was reduced by 15% under EC (Table 4). However, increased harvest index under EC restricted the decline in PUtE to a non-significant 9.5% (P = 0.35). This does not corroborate the findings of Conroy (1992) and Niklaus et al. (1998), who reported increased P use efficiency by plants under high-CO2 atmosphere. These studies, however, were not representative of the soil and climatic conditions in India. ET caused a non-significant decline in PPE but a significant decline of 23% in PUtE of wheat. The decline was mediated mainly through the adverse effects of higher temperature on total biomass and grain yield coupled with the less pronounced effects
Table 3. Effects of atmospheric CO2 (385 vs. 650 ppm), temperature and phosphorus levels on dry weight, P concentration and P uptake of whole plant
CO2 levels Temperature levels Phosphorus levels ambient elevated ambient ambient +3°C control P 100% P 200% P
Dry weight (g/pot) 10.5b 13.9a 14.3a 10.2b 10.4c 12.7b 13.5a
P uptake (mg/pot) 17.1b 27.0a 25.3a 18.7b 14.0c 23.0b 29.0a
%Pdff 50.9d 55.9c 54.2d 54.0d – 42.2b 48.6a
Fertilizer-P uptake (mg/pot) 8.70c 15.1b 13.7c 10.1d – 9.71d 14.1c
on total P uptake by plant. Increasing doses of P fertilization also showed suppressive effect on both the measures of P efficiency. Particularly noteworthy was the substantial decline in both PPE (–17.5%) and PUtE (–30.4%) under ECT compared to ACT. The reduced P efficiencies in combination with the increased P uptake under ECT imply that plant will absorb more P from soil to meet its higher P require-ment, but the conversion efficiency of absorbed P into grain and total biomass yield will be poor under the future scenario of high CO2 and temperature.
P recovery efficiency (PRE) and P use efficiency (PUE). PRE (% recovery of applied fertilizer) by wheat increased significantly under EC relative to AC (Table 4). This increase was the combined effect of higher %Pdff and the higher total P up-take by plant under EC. PUE (grain yield per unit P application) was also improved by 45.5% at EC owing to the similar increase in grain yield. ET caused 26% decline in PRE and 43% in PUE of wheat (Table 4). The results reinforce the prediction of Aggarwal (2007) who, based on a simulation study, expressed the possibility of reduced fertilizer use efficiency in Indian agriculture under the chang-ing scenario of global warmchang-ing. As expected, PRE and PUE at 200% P level were always lower than at 100% P. Notwithstanding the reduction in PRE under ET, it was increased by 27% under ECT. A 17% decline in PUE caused by a similar decline in grain yield under ECT is not an encouraging observation for future wheat production under a changing climate in India.
Overall, our study suggests that plant’s P require-ment may increase under the rising atmospheric CO2 and temperature as indicated by the signifi-cantly higher uptake of P despite the reduced yield of wheat under ECT. Although certain compensa-tory responses by plants, in terms of better root
growth and higher recovery efficiency of applied P, may be elicited in response to higher P requirement, the benefits of such responses may get offset by the reduction in P utilization efficiency and overall P use efficiency under ECT. Our study, therefore, underlines the need of P-efficient crop cultivars and the nutrient management practices for sus-taining crop productivity in a changing climate.
Acknowledgments
Financial assistance by the IARI, New Delhi is gratefully acknowledged.
REFERENCES
Aggarwal P.K. (2007): Climate change: Implications for Indian agriculture.Jalvigyan Sameeksha, 22: 37–46.
BassiriRad H., Gutschick V.P., Lussenhop J. (2001): Root system adjustments: regulation of plant nutrient uptake and growth responses to elevated CO2. Oecologia, 126: 305–320. Campbell C.D., Sage R.F. (2006): Interactions between the effects
of atmospheric CO2 content and P nutrition on photosynthesis in white lupin (Lupinus albus L.). Plant, Cell and Environment, 29: 844–853.
Conroy J.P. (1992): Influence of elevated atmospheric CO2 con-centrations on plant nutrition. Australian Journal of Botany, 40: 445–456.
Cure J.D., Rufty T.W. Jr., Israel D.W. (1988): Phosphorus stress effects on growth and seed yield responses of non-nodulated soybean to elevated carbon dioxide. Agronomy Journal, 80: 897–902. Dobermann A. (2005): Nitrogen Use Efficiency: State of the
Art. In: IFA International Workshop on Enhanced Efficiency Fertilizers, Frankfurt, Germany, June 28–30.
[image:5.595.63.533.86.207.2]Gomez K.A., Gomez A.A. (1984): Statistical Procedures for Ag-ricultural Research. John Wiley and Sons, New York.
Table 4. Effects of atmospheric CO2 (385 vs. 650 ppm), temperature and phosphorus levels on phosphorus ef-ficiency in wheat
CO2 levels Temperature levels Phosphorus levels ambient elevated ambient ambient +3˚C control P 100% P 200% P SPUE [P uptake (mg)/root mass (g)] 22.8b 27.6a 29.4c 21.3d 19.2c 25.8b 29.3a
PPE [biomass yield (g)/P uptake (mg)] 0.66a 0.56b 0.62d 0.60d 0.77a 0.57b 0.48c
PUtE [grain yield (g)/P uptake (mg)] 0.21b 0.19b 0.22a 0.17b 0.23a 0.20b 0.17c
PRE (%) 20.5b 35.3a 32.1a 23.8b – 32.4a 23.4b
PUE [grain yield (g)/applied P (mg)] 98.3b 143a 154a 87.7b – 156a 85.2b
Kimball B.A., Kobayashi K., Bindi M. (2002): Responses of agricul-tural crops to free-air CO2 enrichment. Advances in Agronomy, 77: 293–368.
Loladze I. (2002): Rising atmospheric CO2 and human nutrition: toward globally imbalanced plant stoichiometry. Trends in Ecology and Evolution, 17: 457–461.
Manoj-Kumar, Patra A.K., Swarup A. (2011a): Impact of cli-mate change on fertiliser demand in agriculture: concerns and imperatives for food security in India. Indian Journal of Fertilisers, 7: 48–62.
Manoj-Kumar, Swarup A., Patra A.K., Purakayastha T.J., Manjaiah K.M., Rakshit R. (2011b): Elevated CO2 and temperature effects on phosphorus dynamics in rhizosphere of wheat (Triticum
aestivum L.) grown in a Typic Haplustept of subtropical India.
Agrochimica, 55: 14–31.
Corresponding author:
Dr. Manoj-Kumar, Division of Natural Resource Management (Soil Science), ICAR Research Complex for NEH Region, Umiam, Meghalaya-793 103, India
e-mail: [email protected]
Niklaus P.A., Leadley P.W., Stocklin J., Korner C. (1998): Nutri-ent relations in calcareous grassland under elevated CO2? Oecologia, 116: 67–75.
Raghothama K.G. (1999): Phosphate acquisition. Annual Review of Plant Physiology and Plant Molecular Biology, 50: 665–693. Rogers G.S., Payne L., Milham P., Conroy J.P. (1993): Nitrogen and
phosphorus requirements of cotton and wheat under changing CO2 concentrations. Plant and Soil, 155: 231–234.
Sujatha K.B., Uprety D.C., Rao D.N., Rao P.R., Dwivedi N. (2008): Up-regulation of photosynthesis and sucrose-P synthase in rice under elevated carbon dioxide and temperature conditions. Plant, Soil and Environment, 54: 155–162.
Vance C.P., Uhde-Stone C., Allan D.L. (2003): Phosphorus ac-quisition and use: critical adaptations by plants for securing a nonrenewable resource. New Phytologist, 157: 423–447.