http://dx.doi.org/10.4236/ajac.2012.310089 Published Online October 2012 (http://www.SciRP.org/journal/ajac)
Utilization of Dispersive Liquid-Liquid Microextraction
Coupled with HPLC-UV as a Sensitive and Efficient
Method for the Extraction and Determination of Oleanolic
Acid and Ursolic Acid in Chinese Medicinal Herbs
Yaomei Hao, Xuan Chen, Shuang Hu*, Xiaohong Bai*, Deshuang Gu School of Pharmacy, Shanxi Medical University, Taiyuan, China
Email: *[email protected], *[email protected]
Received August 18, 2012; revised September 19, 2012; accepted September 26, 2012
ABSTRACT
Isomeric triterpenic acids of oleanolic acid (OA) and ursolic acid (UA) both have very low ultraviolet absorption and always exist in the same plant, so the separation and simultaneous determination of them have been a difficult task. In this study, asensitive method combining dispersive liquid-liquid microextraction (DLLME) with HPLC-UV was deve- loped for the extraction and determination of OA and UA in traditional Chinese medicinal herbs (CMHs). Variables in- fluencing DLLME such as type and volume of extraction solvent, volume of dispersive solvent, ionic strength, aqueous phase pH, extraction time, centrifugation speed and time, and sample volume were investigated and optimized. Under the optimum conditions, both OA and UA attained favorable extraction efficiencies with enrichment factors 1378 and 933, respectively. The linear dynamic ranges of 0.07 - 30.4 μg·mL–1 for OA and 0.08 - 33.6 μg·mL–1 for UA were
ob-tained with square correlation coefficients of 0.9963. The detection limits of OA and UA were both 0.02 μg·mL–1. The
method recoveries ranged between 88.2% - 116.2% for OA and 85.7% - 108.2% for UA with the RSDs (n = 5) lower than 8.6%. The proposed method was successfully applied to concentrate and simultaneously determine these two triterpenic acids in Hedyotis diffusa and Eriobotrya japonica samples.
Keywords: Dispersive Liquid-Liquid Microextraction; High Performance Liquid Chromatography; Enrichment Factor; Triterpenic Acids; Chinese Medicinal Herbs
1. Introduction
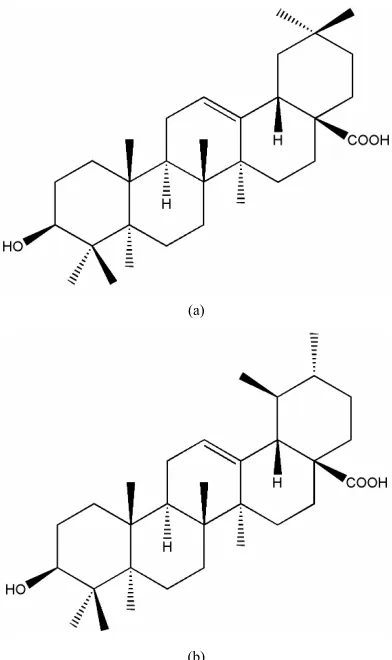
Oleanolic acid (OA) and ursolic acid (UA) are isomeric triterpenic acids with only one methyl’s position differ- ence between them (Figure 1). They exist abundantly in the plant kingdom and always simultaneously exist in the same plant. Based on the closeness of their chemical structures, both components usually exert similar thera- peutics and biological effects. They are well known for their hepatoprotective effects against both acute chemi- cally induced liver injury and chronic liver fibrosis and cirrhosis [1]. Moreover, a variety of novel pharmaco- logical effects produced by these triterpenoids have been reported, such as antioxidant [2,3], anti-inflammatory [4,5],antitumour [6,7],anti-HIV [8],antimicrobial [9,10], gastroprotective [11] and the antiobese potential [12,13]. Given their occurrence at low levels in many herbal medicines and very low UV absorptions, the determina- tion of OA and UA has attracted increasing attentions in
research of traditional Chinese medicinal herbs (CMHs). At present, the separation and determination of the two components in plants are usually performed by using chromatographic method, such as Micellar Electrokinetic Capillary Chromatography (MECC) [14], Capillary Zone Electophoresis (CZE) [15], direct HPLC-UV detection [16] and HPLC-DAD [17], pre-column derivatization HPLC (pre-CD-HPLC) [18] and Iodine Derivatization then High Performance Thin-Layer Chromatography (ID- HPTLC) [19]. However, these determination approaches suffer from some demerits either low sensitivity, poor precision or harsh derived reaction conditions. Thus, it is required that a simple and effective sample-preparation protocol should be designed to extract and preconcentrate then directly determine these two triterpenic acids from CMHs.
Dispersive liquid-liquid microextraction (DLLME), as a procedure of samples preparation inside “Green Che- mistry” because of the small volumes of dissolvent em- ployed [20], has attracted much attention in the recent years. DLLME is based on a ternary component solvent
(a)
[image:2.595.74.270.83.413.2](b)
Figure 1. Chemical structures of oleanolic acid (a) and ur-solic acid (b).
system including disperser solvent, extraction solvent and aqueous sample containing interest analytes [21]. This new sample-preparation technique, that set extrac- tion, purification and concentration of the target analytes in one step, has the following characteristics: simplicity of operation; high enrichment factor; low organic solvent consumption (generally a few to dozens of microliters); low labor cost and cheap equipment. Besides, it can achieve selective extraction and reduce matrix interfere- ence through the adjustment of solvent extraction of po- larity or acidity and alkalinity [21]. Owing to above unique advantages, DLLME has been applied to the ana- lyses of polycyclic aromatic hydrocarbons [22], organ- ophosphorus pesticides [23],herbicides [24], cadmium [25] and cobalt [20,26] in water samples, cholesterol [27], amitraz [28] and cobalt [20] in food samples, psychotro- pic drugs [29], emodin and its metabolites [30] in urine samples. But so far, the method has been rarely applied in the extraction and concentration of active components in complex CMH samples [31],and there is no report that DLLME was used in determination of OA and UA.
In the present work, a DLLME prior to direct HPLC- UV method was proposed for simultaneous extraction and determination of trace amounts of OA and UA in
Hedyotis diffusa and Eriobotrya japonica samples. All variables affecting the enrichment were investigated and optimized. Under the optimum conditions, the advan- tages and disadvantages of the developed method and those of other methods for the extraction and determina- tion of OA and UA were compared. It is found that DLLME coupled with HPLC is a simple, fast, sensitive, efficient and green method for the simultaneous analysis of OA and UA in CMH samples.
2. Experimental
2.1. ReagentsStandards of OA and UA were purchased from Chengdu must bio-technology Co. Ltd. (Purity ≥ 98%, Chengdu, China). Chloroform (CHCl3), carbon tetrachloride (CCl4),
dichloromethane (CH2Cl2), 1, 2-dichloroethane (ClCH2
CH2Cl), chlorobenzene (C6H5Cl) were acquired from Sino-
pharm Chemical Reagent Co. Ltd. (Shanghai, China). Methanol of HPLC grade, ethanol, hydrochloric acid and phosphoric acid were purchased from Tianjin Chemical Reagent Factory (Tianjin, China). Other chemicals used were at least of analytical-reagent grade. Doubly distilled water was used throughout.
2.2. Preparation of Standard Solution and Real Samples
The mixture of stock solution of OA (0.20 mg·mL–1) and
UA (0.26 mg·mL–1) was prepared in methanol and stored
at 4˚C. 2 mL of stock solution was diluted to 5 mL with methanol as working solution before used.
CMHs of Hedyotis diffusa and Eriobotrya japonica were purchased from a local pharmacy (Taiyuan, China) and pulverized. 0.5 g of dry powder were accurately weighed and dissolved with 20 mL methanol, respec- tively. The obtained solutions were put in the ultrasonic bath for 40 min, and then filtered off the precipitate. The filtrates were diluted with methanol up to a volume of 50 mL. The solutions were stored around 4˚C for use.
2.3. Instrumentation
Chromatographic analysis was carried out on Agilent 1200 HPLC system equipped with two G1181A pumps, a G1186A thermostat and a VWD UV-detector (Agilent Technologies, California, USA). The chromatographic separation of the analytes was carried out on a Zorbax Eclipse XDB-C18 column (250 mm × 4.6 mm, 5 μm particle size). The mobile phase consisted of 13% water containing 0.2% phosphoric acid for adjusting to a suit- able pH and 87% methanol. The flow-rate of 0.8 mL·min–1 was used in isocratic elution mode. The column
was kept at 25˚C with detection wavelength at 210 nm. The total chromatographic run time was 32 min.
A centrifuge model 0406-1 (Shanghai, China) was used to accelerate the separation of sediment phase.
50 60 70 80 90
200 400 600 800 1000 1200
Oleanolic acid Ursolic acid
2.4. Dispersive Liquid-Liquid Microextraction Procedure
Pe
ak
are
a
Volume of CHCl3 (μL) Into the 5.0 mL aqueous solution (acidified with 0.1 M
HCl) containing the target analytes (100 μL working solution) and 10% (w/v) sodium chloride (NaCl), 300 μL of methanol (dispersive solvent) and 70 μL of chloroform (extraction solvent) were rapidly injected. Immediately, a cloudy solution was formed in the conical tube and then the mixture was gently hand-shaken for 30 s. The cloudy solution was kept at rest for 2 min until the distribution of analytes in both aqueous solution and extraction solvent reached equilibrium. In order to separate the extractant phase from the aqueous phase better, the above mixture was centrifuged for 4 min at 1500 rpm. After this process, the dispersed fine droplets of CHCl3 were
deposited as sediment on the bottom of the test tube. The 30 μL of aggregation phase was withdrawn and trans- ferred into a 2 mL small beaker, then evaporated to dryness in water bath. The residue was dissolved in 50
μL of HPLC-grade methanol and 20 μL was injected into HPLC system. All the experiments were performed in triplicate.
3. Results and Discussion
3.1. Optimization of the DLLME Procedure
3.1.1.Type and Volume of the Extraction Solvent
The selection of a suitable extraction solvent is critical for the DLLME process. In the DLLME, the extraction solvent should have following characteristics: 1) higher density than that of water, 2) low solubility in water, 3) the ability to extract interest analytes, and 4) good chro- matographic behavior. In other words, the solvent peak should have no interference with the analyte peaks under the selected HPLC conditions. Based on these require- ments, five organic solvent candidates, including C6H5Cl,
CCl4, CH2Cl2, ClCH2CH2Cl and CHCl3 were investigated.
The average peak areas (in triplicate) and the standard deviation for the different extraction solvents were tested. The results revealed that the peak areas obtained for the analytes using CHCl3 were higher than those with other
solvents. In the case of CH2Cl2 as extraction solvent, the
sedimented phase was hardly formed. Therefore, CHCl3
was selected as the extraction solvent for the study. The volume of extraction solvent usually has great in- fluence on the extraction efficiency in DLLME. In this test, different volumes of CHCl3 (50, 60, 70, 80 and 90
[image:3.595.323.524.84.238.2]μL) were evaluated. Figure 2 clearly showed that the peak areas of the analytes rose obviously with increasing of CHCl3 volume until 70 μL. When the volume of
Figure 2. Effect of volume of CHCl3 (n = 3). Extraction con- ditions: [OA] = 1.60 µg·mL−1, [UA] = 2.08 µg·mL−1; sample volume, 5 mL; spiked working solution, 100 μL; 0.1 M HCl, 0.5 mL; NaCl concentration, 10%; methanol volume, 300 μL; shaking time, 50 s; stalling time, 2 min; centrifugation speed, 1500 rpm; centrifugation time, 4 min.
CHCl3 continued to increase, the peak areas of both ana-
lytes decreased slightly. So, 70 μL was chosen as opti- mum extraction solvent volume for further experiments.
3.1.2. Effect of Disperser Solvent Volume
The disperser solvent must be miscible with both the extraction solvent and aqueous sample in order to form a distinct cloudy solution. Methanol is one of commonly used dispersants and was used for the solvent of stock solutions in the study, so we chose methanol as disperser solvent. The different volumes of methanol (0, 100, 200, 300, 400 and 500 μL) was tested. The results demon- strated that peak areas of OA and UA improved with the increasing of methanol volume up to 300 μL, and then the peak areas no longer had changes almost. Therefore, 300 μL of methanol was selected as the optimal disperser solvent volume for the subsequent experiments.
3.1.3. Effect of Sample pH
The pH value of sample solution determines the existing forms of the analytes (as ions or neutral molecules) be- cause of the dissociation equilibrium, which could affect extraction efficiency. In this step, the effect of sample pH was evaluated within the pH range of 1 - 7 by adding equal volume (0.5 mL) of various concentrations of hy- drochloric acid (1, 10–1, 10–2, 10–3, 10–4, 10–5 and 10–6 M)
to aqueous samples. It can be observed from Figure 3
1 2 3 4 500
600 700 800 900 1000 1100
0 5 10 15 20
300 400 500 600 700 800 900 1000 1100
5 6 7
Pe
ak area
pH
Oleanolic a
Peak
are
a
Salt concentration (%)
cid Ursolic acid
Oleanolic acid Ursonic acid
(
2)
224.51 184.4 0.9963
y= c+ r =
(
2)
246.62 185.2 0.9963
[image:4.595.82.265.83.224.2]y= c+ r =
Figure 3. Effect of sample pH (n = 3). Extraction conditions: [OA] =1.44 μg·mL–1, [UA] =1.84 μg·mL–1. Sample volume, 5 mL; spiked working solution, 100 μL; NaCl concentration, 10 %; chloroform volume, 70 μL; methanol volume, 300 μL; shaking time, 50 s; stalling time, 2 min; centrifugation speed, 1500 rpm; centrifugation time, 4 min.
3.1.4. Effect of Ionic Strength
The influence of the ionic strength of the solution was evaluated by adding NaCl amounts from 0 to 20% (w/v) into the sample solution. The results (see Figure 4) showed that the ionic strength had an obvious effect on extraction efficiency. When salt concentration was below 10%, peak areas increased with the increasing of the salt concentration. However, higher than 10% of salt amount, peak areas greatly reduced. Maximum peak areas were obtained when 10% of salt was added. So, 10% of NaCl was used to the following experiments.
3.1.5. Effect of Extraction Time
In the DLLME, the extraction time is referred to as the time interval between injection the mixture of disperser solvent and extraction solvent and the start of centrifugation. Therefore, we examined the effect of hand-shaking time (5, 15, 25, 35 and 45 s) and resting time from 0 min to 4 min with fixed other experimental conditions. The results showed that the analytes had the best enrichments when the hand-shaking was performed for 50 times (about 25 s) before resting 2 min.
3.1.6. Effect of Centrifugation Speed and Time
Centrifugation is essential to separate extraction solvent from aqueous solution in DLLME, because centrifuga- tion speed and time may affect the volume of settled phase. The effect of the centrifugation speed and time on the extraction efficiencies of these two triterpenic acids was examined from 500 to 3500 rpm and from 2 to 6 min. The experimental results showed that the best perfor- mance was obtained at 1500 rpm for 4 min.
3.1.7. Effect of Volume of Sample Phase
[image:4.595.330.517.86.231.2]The volume of sample phase has a great influence on the ex- traction efficiency of the analytes. In this study, different
Figure 4. Effect of concentration of NaCl (n=3). Extraction conditions: [OA] = 1.44 μg·mL–1, [UA]=1.84 μg·mL–1. Sam- ple volume, 5 mL; spiked working solu- tion, 100 μL; 0.1 M HCl, 0.5 mL; chloroform volume, 70 μL; methanol volume, 300 μL; shaking time, 50 s; stalling time, 2 min; centrifuga-tion speed, 1500 rpm; centrifugacentrifuga-tion time, 4 min.
volumes of sample phase (2, 4, 5, 6 and 8 mL) were in-vestigated. Results indicated that the peak areas of OA and UA increased with increasing of sample phase vol-ume up to 5 mL, then decreased remarkably with the volume of sample phase from 5 to 8 mL. Finally, 5 mL of the sample phase was chosen for the study.
3.2. Analytical Performance
3.2.1. Linearity and Limits of Detection
The method of DLLME coupled with HPLC for the de- termination of OA and UA was evaluated under the op- timized conditions. The 7-point calibration curves were observed linear over the range of 0.07 - 30.4 μg·mL–1 for
OA and 0.08 - 33.6 μg·mL–1 for UA, respectively. The
regression equations between the peak area (y) and con-centration (c) and square correlation coefficients (r2) were got as follows:
OA:
UA:
The limits of detection (LODs, at the signal to noise ratio of 3) were found to be both 0.02 μg·mL–1. The li-
mits of quantitation (LOQs, at the signal to noise ratio of 10) were 0.07 μg·mL–1 for OA and 0.08 μg·mL–1 for UA,
respectively.
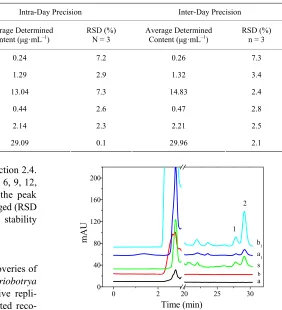
3.2.2. Precision
Precision of the method was examined based on nine replicates of three levels. The RSDs for the intra-day and inter-day precision were displayed in Table 1.
3.2.3. Stability
At the optimum conditions, the stability of two CMH samples was performed by preparing a group of real
Table 1. Results of intra-day and inter-day precision test of analytes (n = 3).
Intra-Day Precision Inter-Day Precision
Analytes Standard Content (μg·mL–1) Average Determined
Content (μg·mL–1) RSD (%) N = 3 Average Determined Content (μg·mL–1) RSD (%) n = 3
0.30 0.24 7.2 0.26 7.3
1.52 1.29 2.9 1.32 3.4
OA
15.2 13.04 7.3 14.83 2.4
0.52 0.44 2.6 0.47 2.8
2.60 2.14 2.3 2.21 2.5
UA
26.0 29.09 0.1 29.96 2.1
samples according to DLLME procedures in Section 2.4. In the study, the samples were analyzed at 0, 3, 6, 9, 12, 18 and 24 h, respectively. It was found that the peak areas of the two target analytes remained unchanged (RSD < 8.5%). It means that the samples were in stability within 24 h.
3.2.4. Recoveries
Accuracy was assessed by investigating the recoveries of the target analytes in Hedyotis diffusa and Eriobotrya japonica samples spiked with OA and UA (five repli- cates for each sample), respectively. The resulted reco- veries were shown in Table 2. The average recoveries of the both target analytes indicated that the method had a good accuracy.
3.3. Calibration of Enrichment Factor
In order to evaluate the performance of the proposed method, Enrichment Factor (EF) was applied and cal- culated by following equation.
sed
0 C EF
C
=
0 2 20 25 30
0 40 80 120 160 200
mAU
Time (min)
ab s a1 b1 1
[image:5.595.56.534.106.306.2]2
Figure 5. Typical chromatograms for analytes in Hedyotis diffusa and Eriobotrya japonica. 1: Oleanolic acid; 2: Ursolic acid. a: before DLLME of Hedyotis diffusa; a1: after DLL- ME of Hedyotis diffusa; b: before DLLME of Eriobotrya japonica; b1: after DLLME of Eriobotrya japonica; s: stan-dard analytes.
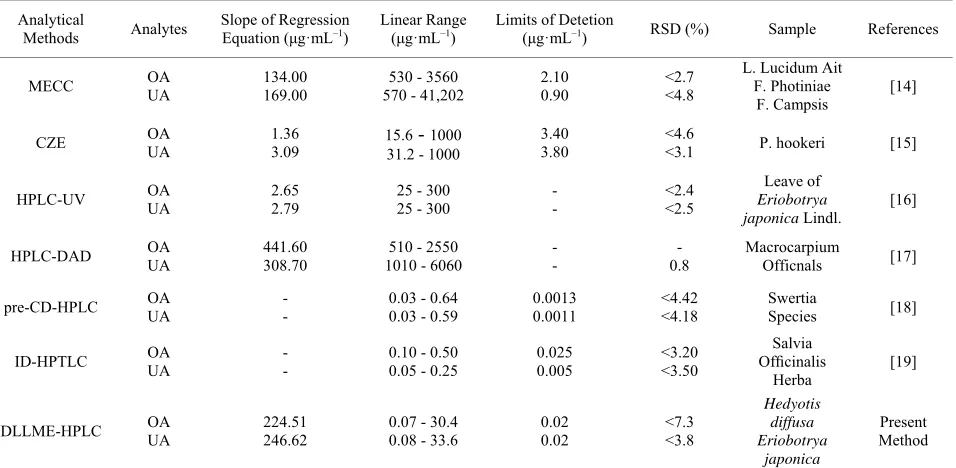
3.5. Comparison of DLLME-HPLC with Other Analysis Method
As listed in Table 4, comparing to the other analysis methods encompassing chromatographic separation tech- niques [14-19] for the determination of OA and UA, the proposed method attained a higher sensitivities (see slopes of regression equation in Table 4) and better li- near dynamic ranges, for which major reason is that the DLLME-based work involves high enrichment factors for the OA and UA. HPLC-DAD [17] obtained higher sensitivities but with poor LODs and linear ranges. Though the lower LODs were obtained by derivatization- HPLC [18]and ID-HPTLC [19], the derived reaction conditions were relatively strict and not easy to control. where Csed and C0 were the concentration of analyte in
sedimented phase and the initial concentration of analyte in sample solution, respectively. Based on the equation, the average EFs of OA and UA were 1378 and 933, re- spectively.
3.4. Application
To investigate the applicability of the developed method to real samples, OA and UA in Hedyotis diffusa and Eriobotrya japonica were concentrated and assayed by DLLME–HPLC, and the analytical results were listed in
Table 3. The chromatograms in Figure 5 showed that the target analytes had excellent enrichment after the process of DLLME.
4. Conclusion
Table 2. Recovery experiments of two analytes in Hedyotis diffusa and Eriobotrya japonica samples by the DLLME-HPLC method (n = 5).
Traditional Chinese
Herbs Analytes
Content (μg)
Added Standards
(μg)
Average Measured Value (X±SD)
(μg)
Average Recovery
(%) RSD (%)
OA 0.73 0.76 0.78 ± 0.07 102.6 8.6
Hedyotis diffusa
UA 6.32 6.50 5.93 ± 0.62 91.3 3.9
OA 19.96 20.52 22.67 ± 0.92 111.6 2.7
Eriobotrya japonica
[image:6.595.56.538.113.244.2]UA 58.60 59.80 62.64 ± 1.83 105.0 2.4
Table 3. Analytical results of OA and UA in CMHs real samples by DLLME-HPLC (n = 3).
Content (mg·g–1)
Traditional
Chinese Medicine Analytes
Ⅰ Ⅱ Ⅲ Average
RSD (%)
Hedyotis diffusa OA UA 0.37 3.06 0.34 3.16 0.35 3.21 0. 36 3.14 3.5 2.0
[image:6.595.62.540.391.625.2]Eriobotrya japonica OA UA 29.12 9.86 10.11 29.78 10.21 30.02 10.06 29.64 1.5 1.3
Table 4. Comparison of performance of the proposed method with that of other analytical methods.
Analytical
Methods Analytes
Slope of Regression
Equation (μg·mL–1) Linear Range(μg·mL–1) Limits of Detetion(μg·mL–1) RSD (%) Sample References
MECC OA UA 134.00 169.00 570 - 41,202 530 - 3560 2.10 0.90 <2.7 <4.8
L. Lucidum Ait F. Photiniae
F. Campsis
[14]
CZE OA UA 1.36 3.09 15.6 - 1000
31.2 - 1000
3.40 3.80
<4.6
<3.1 P. hookeri [15]
HPLC-UV OA UA 2.65 2.79 25 - 300 25 - 300 - - <2.4 <2.5
Leave of Eriobotrya japonica Lindl.
[16]
HPLC-DAD OA UA 441.60 308.70 1010 - 6060 510 - 2550 - - 0.8 - Macrocarpium Officnals [17]
pre-CD-HPLC OA UA - - 0.03 - 0.64 0.03 - 0.59 0.0013 0.0011 <4.42 <4.18 Swertia Species [18]
ID-HPTLC OA UA - - 0.10 - 0.50 0.05 - 0.25 0.025 0.005 <3.20 <3.50
Salvia Officinalis
Herba
[19]
DLLME-HPLC OA UA 224.51 246.62 0.07 - 30.4 0.08 - 33.6 0.02 0.02 <7.3 <3.8
Hedyotis diffusa Eriobotrya
japonica
Present Method
conditions, both OA and UA attained favorable extrac- tion efficiencies, high enrichment factor, wide linear range, and low detection limit. Furthermore, the method successfully applied to simultaneous quantification of both triterpenes acids in Hedyotis diffusa and Eriobotrya japonica. Comparing to the other analysis methods, DLLME-HPLC is a feasible technique used for the sepa- ration, enrichment and determination of trace analytes in
complex CMH samples.
5. Acknowledgements
This research was supported by the National Nature Sci- ence Foundation of China (No.81041084), the Nature Science Foundation of Shanxi Province, China (No. 2011011035-2), the Innovation Foundation of University Student of Shanxi Province for the financial support and
the Foundation of Shanxi Medical University, China.
REFERENCES
[1] J. Liu, “Pharmacology of Oleanolic Acid and Ursolic Acid,” Journal of Ethnopharmacology, Vol. 49, No. 2, 1995, pp. 57-68. doi:10.1016/0378-8741(95)90032-2 [2] V. Mandal and S. C. Mandal, “Design and Performance
Evaluation of a Microwave Based Low Carbon Yielding Extraction Technique for Naturally Occurring Bioactive Triterpenoid: Oleanolic Acid,” Biochemical Engineering Journal, Vol. 50, No. 1-2, 2010, pp. 63-70.
doi:10.1016/j.bej.2010.03.005
[3] A. T. Dinkova-Kostova, K. T. Liby, K. K. Stephenson, W. D. Holtzclaw, X. Q. Gao, N. Suh, C. Williarrli, R. Ri- singsong, T. Honda, G. W. Gribble, M. B. Sporn and P. Talalay, “Extremely Potent Triterpenoid Inducers of the Phase 2 Response: Correlations of Protection against Oxi- dant and Inflammatory Stress,” Proceedings of the Na- tional Academy of Sciences of the United States of Ame- rica, Vol. 102, No. 12, 2005, pp. 4584-4589.
doi:10.1073/pnas.0500815102
[4] S. Schwaiger, I. Zeller, P. Pölzelbauer, S. Frotschnig, G. Laufer, B. Messner, V. Pieri, H. Stuppner and D. Bernhard, “Identification and Pharmacological Characterization of the Anti-Inflammatory Principal of the Leaves of Dwarf Elder (Sambucus ebulus L.),” Journal of Ethnopharma-cology, Vol. 133, No. 2, 2011, pp. 704-709.
doi:10.1016/j.jep.2010.10.049
[5] J. P. Benincá, J. B. Dalmarco, M. G. Pizzolatti and T. S. Fröde, “Analysis of the Anti-Inflammatory Properties of Rosmarinus Officinalis L. in Mice,” Food Chemistry, Vol. 124, No. 2, 2011, pp. 468-475.
[6] K. Mazumder, E. Siwu, S. Nozaki, Y. Watanabe and K. Tanaka, “Ursolic Acid Derivatives from Bangladeshi Me- dicinal Plant, Saurauja Roxburghii: Isolation and Cyto- toxic Activity against A431 and C6 Glioma Cell Lines,” Phytochemistry Letters, Vol. 4, No. 3, 2011, pp. 287-291. doi:10.1016/j.phytol.2011.04.019
[7] S. L. Yan, C. Y. Huang, S. T. Wu and M. C. Yin, “Oleano- lic acid and Ursolic Acid Induce Apoptosis in Four Hu- man Liver Cancer Cell Lines,” Toxicology in Vitro, Vol. 24, No. 3, 2010, pp. 842-848. doi:1016/j.tiv.2009.12.008 [8] Y. Kashiwada, H. K. Wang, T. Nagao, S. Kitanaka, I.
Yasuda, T. Fujioka, T. Yamagishi, L. M. Cosentino, M. Kozuka, H. Okabe, Y. Ikeshiro, C. Q. Hu, E. Yeh and K. H. Lee, “Anti-AIDS Agents. 30 Anti-HIV Activity of Oleanolic Acid, Pomolic Acid, and Structurally Related Triterpenoids,” The Journal of Natural Products, Vol. 61, No. 9, 1998, pp. 1090-1095. doi:10.1021/np9800710 [9] J. F. Rivero-Cruz, M. Zhu, A. D. Kinghorn and C. D. Wu,
“Antimicrobial Constituents of Thompson Seedless Rai- sins (Vitis vinifera) against Selected Oral Pathogens,” Phytochemistry Letters, Vol. 1, No. 3, 2008, pp. 151-154. doi:10.1016/j.phytol.2008.07.007
[10] K. Horiuchi, S. Shiota, T. Hatano, T. Toshita, T. Kuroda and T. Tsuchiya, “Antimicrobial Activity of Oleanolic acid from Salvia Officinalis and Related Compounds on Vancomycin-Resistant Enterococci (VRE),” Biological
and Pharmaceutical Bulletin, Vol. 30, No. 6, 2007, pp. 1147-1149. doi:10.1248/bpb.30.1147
[11] J. A. Rodriguez, L. Astudillo and G. Schmeda-Hirsch- mann, “Oleanolic Acid Promotes Healing of Acetic Acid- Induced Chronic Gastric Lesions in Rats,” Pharmaco- logical Research, Vol. 48, No. 3, 2003, pp. 291-294. doi:10.1016/S1043-6618(03)00155-5
[12] C. L. Meloa, M. Queiroza, S. Fonsecaa, A. Bizerrab, T. Lemosb, T. Meloc, F. Santosc and V. Raoc, “Oleanolic Acid, a Natural Triterpenoid Improves Blood Glucose Tolerance in Norma Mice and Ameliorates Visceral Obe- sity in Mice Fed a High-Fat Diet,” Chemico-Biological Interactions, Vol. 185, No. 1, 2010, pp. 59-65.
doi:10.1016/j.cbi.2010.02.028
[13] I. Kazmi, M. Rahman, M. Afzal, A. G. Gupta, S. Saleem, O. Afzal, M. A. Shaharyar, U. Nautiyal, S. Ahmed and F. Anwar, “Anti-Diabetic Potential of Ursolic Acid Stearoyl Glucoside: A New Triterpenic Gycosidic Ester from Lan-tana Camara,” Fitoterapia, Vol. 83, No. 1, 2012, pp. 142- 146.
[14] H. X. Liu, Y. H. Shi, D. X. Wang, G. L. Yang, A. M. Yu and H. Q. Zhang, “MECC Determination of Oleanolic Acid and Ursolic Acid Isomers in Ligustrum lucidum Ait,” Journal of Pharmaceutical and Biomedical Analysis, Vol. 32, No. 3, 2003, pp. 479-485.
[15] P. Yang, Y. Q. Li, X. Liu and S. X. Jiang, “Determination of Free Isomeric Oleanolic Acid and Ursolic Acid in Pterocephalus Hookeri by Capillary Zone Electrophore-sis,” Journal of Pharmaceutical and Biomedical Analysis, Vol. 43, No. 4, 2007, pp. 1331-1334.
[16] X. H. Xu, Q. Su and Z. H. Zang, “Simultaneous Deter- mination of Oleanolic Acid and Ursolic Acid by RP- HPLC in the Leave of Eriobotrya japonica Lindl,” Jour- nal of Pharmaceutical Analysis, Vol. 2, 2012, pp. 238- 240. doi:10.1016/j.jpha.2012.01.006
[17] H. H. Wang, Z. Z. Wang and W. B. Guo, “Comparative Determination of Ursolic Acid and Oleanolic Acid of Macrocarpium officinalis (Sieb. et Zucc.) Nakai by RP- HPLC,” Industrial Crops and Products, Vol. 28, No. 3, 2008, pp. 328-332. doi:10.1016/j.indcrop.2008.03.004 [18] G. L. Li, X. L. Zhang, J. M. You, C. H. Song, Z. W. Sun,
L. Xia and Y. R. Suo, “Highly Sensitive and Selective Pre-Column Derivatization High Performance Liquid Chromatography Approach for Rapid Determination of Triterpenes Oleanolic and Ursolic Acids and Application to Swertia Species: Optimization of Triterpenic Acids Extraction and Pre-Column Derivatization Using Re-sponse Surface Methodology,” Analytica Chimica Acta, Vol. 688, No. 2, 2011, pp. 208-218.
doi:10.1016/j.aca.2011.01.010
[19] M. Wójciak-Kosior, “Separation and Determination of Closely Related Triterpenic Acids by High Performance Thin-Layer Chromatography after Iodine Derivatization,” Journal of Pharmaceutical and Biomedical Analysis, Vol. 45, No. 2, 2007, pp. 337-340.
Copyright © 2012 SciRes. AJAC mistry, Vol. 3, 2012, pp. 125-130.
doi:10.4236/ajac.2012.32018
[21] S. Berijani, Y. Assadi, M. Anbia, M. R. M. Hosseini and E. Aghaee, “Dispersive Liquid-Liquid Microextraction Combined with Gas Chromatography-Flame Photometric Detection: Very Simple, Rapid and Sensitive Method for the Determination of Organ Phosphorus Pesticides in Water,” Journal of Chromatography A, Vol. 1123, No. 1, 2006, pp. 1-9.
[22] M. I. Leong, C. C. Chang, M. R. Fuh and S. D. Huanga, “Low Toxic Dispersive Liquid-Liquid Microextraction Using Halosolvents for Extraction of Polycyclic Aromatic Hydrocarbons in Water Samples,” Journal of Chroma- tography A, Vol. 1217, No. 34, 2010, pp. 5455-5461. doi:10.1016/j.chroma.2010.06.056
[23] L. J. He, X. L. Luo, H. X. Xie, C. J. Wang, X. Jiang and K. Lu, “Ionic Liquid-Based Dispersive Liquid-Liquid Microextraction Followed High-Performance Liquid Chro- matography for the Determination of Organophosphorus Pesticides in Water Sample,” Analytica Chimica Acta, Vol. 655, No. 1-2, 2009, pp. 52-59.
[24] S. Q. Gao, J. Y. You, X. Zheng, Y. Wang, R. B. Ren, R. Zhang, Y. P. Bai and H. Q. Zhang, “Determination of Phenylurea and Triazine Herbicides in Milk by Micro- wave Assisted Ionic Liquid Microextraction High-Per- formance Liquid Chromatography,” Talanta, Vol. 82, No. 4, 2010, pp. 1371-1377.
[25] E. Z. Jahromi, A. Bidari, Y. Assadi, M. R. M. Hosseini and M. R. Jamali, “Dispersive Liquid-Liquid Microex- traction Combined with Graphite Furnace Atomic Ab- sorption Spectrometry: Ultra Trace Determination of Cad- mium in Water Samples,” Analytica Chimica Acta, Vol. 585, No. 2, 2007, pp. 305-311.
[26] H. F. Zhang and Y. P. Shi, “Temperature-Assisted Ionic Liquid Dispersive Liquid-Liquid Microextraction Com-
bined with High Performance Liquid Chromatography for the Determination of Anthraquinones in Radix et Rhi- zoma Rhei Samples,” Talanta, Vol. 82, No. 3, 2010, pp. 1010-1016. doi:10.1016/j.talanta.2010.06.008
[27] A. Daneshfar, T. Khezeli and H. J. Lotfi, “Determination of Cholesterol in Food Samples Using Dispersive Li- quid-Liquid Microextraction followed by HPLC-UV,” Journal of Chromatography B, Vol. 877, No. 4, 2009, pp. 456-460. doi:10.1016/j.jchromb.2008.12.050
[28] M. Bashiri-Juybari, A. Mehdinia, A. Jabbari and Y. Ya- mini, “Determination of Amitraz in the Honey Samples by Dispersive Liquid-Liquid Microextraction Followed by Gas Chromatography-Flame Ionization Detection C,” American Journal of Analytical Chemistry, Vol. 2, 2011, pp. 632-637.
[29] M. Xiong, J. L. Ruan, Y. L. Cai and Y. Tang, “Extraction and Determination of Some Psychotropic Drugs in Urine Samples using Dispersive Liquid-Liquid Microextraction Followed by High-Performance Liquid Chromatogra- phy,” Journal of Pharmaceutical and Biomedical Analy- sis, Vol. 49, No. 2, 2009, pp. 572-578.
[30] J. Tian, X. Chen and X. H. Bai, “Comparison of Disper-sive Liquid-Liquid Microextraction Based on Organic Solvent and Ionic Liquid Combined with High-Perfor- mance Liquid Chromatography for Analysis of Emodin and Its Metabolites in Urine Samples,” Journal of Sepa- ration Science, Vol. 35, No. 1, 2012, pp. 145-152. [31] L. H. Li, H. F. Zhang, S. Hu and X. H. Bai, “Dispersive
![Figure 2. Effect of volume of CHCl3 (n = 3). Extraction con- ditions: [OA] = 1.60 µg·mL−1, [UA] = 2.08 µg·mL−1; sample volume, 5 mL; spiked working solution, 100 μL; 0.1 M HCl, 0.5 mL; NaCl concentration, 10%; methanol volume, 300 μL; shaking time, 50 s; s](https://thumb-us.123doks.com/thumbv2/123dok_us/9973072.498067/3.595.323.524.84.238/figure-extraction-ditions-working-solution-concentration-methanol-shaking.webp)
![Figure 4. Effect of concentration of NaCl (n=3). Extraction conditions: [OA] = 1.44 μg·mL–1, [UA]=1.84 μg·mL–1](https://thumb-us.123doks.com/thumbv2/123dok_us/9973072.498067/4.595.330.517.86.231/figure-effect-concentration-nacl-extraction-conditions-oa-mg.webp)