Developing a feedback tool to gain
insights into the professional identity of
STEM students
Marjolein de Vos Master Thesis
Educational Science & Technology Human Resource Development
SUPERVISION DR. M.D. ENDEDIJK R.A. MÖWES MSc University of Twente
2 Title of the final project
Developing a feedback tool to gain insights into the professional identity of STEM students
Researcher
Marjolein de Vos, s0138665, [email protected]
Supervisor 1
M.D. Endedijk, [email protected] Supervisor 2
R.A. Möwes, r.a.mö[email protected]
Keywords
3
Abstract
4
Acknowledgement
Voor u ligt mijn Master Thesis met de titel ‘Developing a feedback tool to gain insights into the professional identity of STEM students’ ter afronding van de Master Educational Science and Technology aan de Universiteit van Twente.
Het studeren in combinatie met werken was op sommige momenten een pittige uitdaging, helemaal naarmate het einde steeds dichterbij kwam. Ik had de thesis niet kunnen afronden zonder de steun van mijn omgeving. Daarom wil ik graag een paar mensen bedanken. Allereerst Maaike Endedijk en Randy Möwes, mijn begeleiders bij het afstuderen. Regelmatig kwamen we samen om een deel van mijn onderzoek te bespreken en de mogelijkheden voor het vervolg te bekijken. Maaike, je zorgde voor veel stof om over na te denken en zorgde voor inzicht in mijn blinde vlek tijdens het schrijven. Hierdoor heb je mijn kennis, vaardigheden en uiteindelijk mijn Master Thesis naar een hoger level getild. Randy, jouw deur stond altijd voor mij open wanneer ik vast liep in mijn onderzoek. Jouw gerichte feedback heeft mij veel stof tot nadenken gegeven en jouw kennis over het project heeft mij vaak geholpen.
Daarnaast wil ik graag mijn studiegenoten bedanken die zich in dezelfde situatie bevonden: Jaella en Marjon. Hoe fijn was het om soms even te uiten waar ik tegen aan liep en te horen dat dit niet alleen bij mij het geval was. Jullie waren altijd bereid om mijn verhaal aan te horen en begrepen waar ik tegen aan liep.
Daarnaast mijn lieve vriendin Marieke die altijd bereid was om even met mij te lunchen op de UT wanneer ik een dip had op het gebied van mijn onderzoek. Vanuit jouw wetenschappelijke
ervaring en jouw afstand tot mijn project kwam je vaak met ideeën en inzichten waardoor ik weer vanuit een andere invalshoek verder kon. Daarnaast vond je het geen probleem om mijn verslag door te lezen wanneer ik vast liep; iets wat ik erg gewaardeerd heb.
Natuurlijk wil ik ook mijn locatieleider Anouck Haven bedanken voor haar steun. Vooral tijdens de laatste weken van mijn scriptie waarbij ik toch regelmatig gestrest op mijn werk rond liep. Je dacht met mij mee hoe ik werk en studie kon combineren en vond het geen probleem wanneer ik af en toe iets eerder van mijn werk weg ging, waardoor ik weer vol goede moed verder kon.
Ten slotte wil ik graag mijn familie en vrienden bedankten en in het bijzonder mijn moeder en Wouter bij wie ik altijd terecht kon voor een luisterend oor, avondeten of gewoon een
5
Table of contents
Abstract ... 3
Acknowledgement ... 4
1. Problem statement ... 7
2. Theoretical Framework ... 8
2.1 Career Choice ... 8
2.2 Professional identity ... 8
2.3 Career Guidance ... 9
2.4 Designing feedback on professional identity ... 10
2.4.1 Requirements of effective feedback ... 10
2.4.2 Design feedback tool through multimedia principles ... 10
2.5 The current study ... 12
3. Research question ... 12
4. Method ... 13
4.1 Research design ... 13
4.2 Respondents ... 14
Phase 1, step 2 – Analysis ... 14
Phase 2 – Design ... 14
Phase 3 - Evaluation ... 14
4.3 Instrumentation ... 15
Phase 1 - Analysis ... 15
Phase 2 – Design ... 15
Phase 3 - Evaluation ... 15
4.4 Procedure ... 16
Phase 1 - Analysis ... 16
Phase 2 - Design ... 17
Phase 3 - Evaluation ... 17
4.5 Data analysis ... 18
Phase 1 - Analysis ... 18
Phase 2 – Design ... 18
Phase 3 – Evaluation ... 19
5. Results ... 20
5.1 Phase 1 ... 20
5.1.1 Professional identity ... 21
6
5. 1.3 The presentation of the feedback tool ... 23
5.1.4 Summary phase 1 towards design requirements ... 25
Phase 2 – Design ... 26
Phase 3 - Evaluation ... 27
Results questionnaire ... 27
Feedback tool version 2.0 ... 28
6. Discussion ... 30
The feedback tool ... 30
Limitations ... 31
Practical implications ... 32
Further research ... 32
Final conclusion ... 33
Reference list ... 34
Appendices ... 37
Appendix A – Focus group guide ... 37
Appendix B – Questionnaire ... 41
7
1.
Problem statement
Technical companies represent a quarter of all companies in the Netherlands and yield a fifth of the Dutch job market (Volkerink, Berkhout, Bisschop & Heyma, 2013). It is expected that the number of jobs in the technical sector will grow with 300.000 jobs between 2015 and 2020. Yet, technical companies deal with a shortage of technical employees. At the moment, 31% of all technical students under the age of 35 decide to work outside the technical sector (van der Kaaden & van der Schier, 2016). In current literature, no apparent reasons are identified which could explain the large numbers of technical students leaving the technical field.
The Dutch Government has stated that more science, technology, engineering, and mathematics (STEM) students will have to work in the technical sector to reduce the shortage of technical staff (Ministerie van Onderwijs, 2016). Gelderblom and de Hek (2014) state that technical students who have received guidance from educational institutes in their search for a job work more often in the technical sector compared to students who have not received this guidance. Nevertheless, career guidance in most educational institutes often focuses on the educational program instead of the future career (Mittendorff, 2014). It can be concluded that too little attention is given to the future work field and future career of the student after completion of the educational program (Luken, 2011).
A few years ago, the Dutch government has determined career guidance as a tool to help students to make considered career decisions (Deursen & Jansen, 2006). To come to well-considered career decisions, students need to explore who they are and what they want. The focus of career guidance should be on the students themselves and their personality and interests. In essence, students have to develop and think about their own professional identity.
A professional identity is the interpretation of a person about himself in his professional role (Molinero & Pereira, 2013). Beijaard, Meijer & Verloop (2004) have pointed out that professional identity starts with self-knowledge about who you are at this moment and who you want to become. A strong professional identity increases students’ motivation for their educational program and stimulates stable career choices (Meijers, Kuijpers & Gundy, 2013). Furthermore, it also reduces the number of switched between professions and reduces the chance of leaving the technical sector (Canrinus, Helms-Lorenz, Beijaard, Buitink & Hofman, 2012).
8
2.
Theoretical Framework
In the next sections, the concepts career choice, professional identity, career guidance, and designing feedback on professional identity will be discussed. First, difficulties in making career choices will be introduced. Second, the importance of professional identity will be discussed. Third, the role of career guidance for STEM students will be examined. Last, requirements for effective feedback will be discussed and it will be considered how feedback on professional identity can be designed.
2.1 Career Choice
One of the most difficult decisions that people need to make in their life is their choice of career (Fabio, Palazzeschi, Asulin-Perets & Gati, 2013). Once people have chosen a career direction there is a high probability that they continue working in this field for the rest of their life. Therefore, career choice has a major impact on someone’s life (Meng, 2016; Olamide & Oluwaseun, 2013). To achieve a career choice students must know themselves and use this self-knowledge to make good career decisions (Olamide & Oluwaseun, 2013). In addition, the process of making choices about a future career is a complex, dynamic and individual process which demands attention and serious thoughts (Mutha, Takayama & O’neil, 1997).
Gati, Krausz & Osipow (1996) distinguish three main difficulties that can occur during the process of attaining a career choice: lack of readiness, lack of information and inconsistent information. First, there are students who may have a lack of motivation to participate in the career decision process (lack of readiness). Second, students may receive unreliable information or have conflicts with themselves or other people, for example incompatible preferences (inconsistent information). Lastly, lack of information includes self-knowledge, lack of knowledge about opportunities that exist after completing the educational program and ignorance about ways to obtain information to come to a career choice (Gati et al., 1996).
Several difficulties can arise during the complex process of making a career choice. For this reason, students need information about themselves in order to develop self-knowledge and information about opportunities for a future career.
2.2 Professional identity
People are constantly trying to find out who they are and where they want to be in a few years. This is a continuing process of interpretation and re-interpretation of experiences, called identity (Beijaard at al., 2004). Identity can be described as a personal answer on the question ‘Who am I at this moment?’ (Beijaard et al., 2004; Crocetti, Avanzi, Hawk, Fraccaroli & Meeus, 2014). Identity is formed in relationship with others and consists of sub identities. Identity also includes social aspects, cultural sights, and emotions (Rodgers & Scott, 2008).
Professional identity is the interpretation of people about themselves in their professional role (Molinero & Pereira, 2013). It provides answers to the questions ‘Who am I as a professional?’ and ‘Who do I want to become?’ (Beijaard et al., 2004). In addition, professional identity is often defined as people’s perception of themselves in their profession and the employee they wish to become (Canrinus, 2011).
9 students’ ideas about themselves in their professional role (Ashforth, Harrison & Coley 2008). There are five components to measure the content of students’ professional identity: personality traits, values, goals, interests, and competences (Ashforth et al., 2008). The focus of this research will be on the content of professional identity and the corresponding components.
Professional identity will not arise at a specific moment, but is a continuous and lifelong process which continues until someone’s retirement (Moss, Gibson & Dollarhide, 2014). New experiences and someone’s personal interpretations can adjust ones professional identity (Crocetti et al., 2014).
A strong professional identity is mostly seen when people are working, but the development of professional identity starts even before someone gets to work. Therefore research on professional identity development is often focused on students (e.g. Canrinus, 2011). During their study, students already focus on a career direction e.g. by selecting a company for their internship. Some students already have a detailed career direction in mind whereas other students have no ideas about their future career. Yet, it is important because a strong professional identity contributes to well-considered career choices (Meijers et al., 2013).
Many factors play a role in defining students’ professional identity. For this reason, it is important to guide students during this process for example by specific career guidance.
2.3 Career Guidance
Career guidance can be seen as a helpful instrument to support students in taking thoughtful decisions with regard to their career (Deursen & Jansen, 2006). The main objective of career guidance is to make students pro-active and responsible for their own learning and career path (Kuijpers & Meijers, 2009; Mittendorff, Jochems, Meijers & den Brok, 2008). According to Mittendorff (2014) career guidance should specifically focus on students’ motivation for a particular occupation, student’s view on a particular profession, the type of work that suits the student, and the qualities of the student.
Students’ expectations about a future profession can be identified through reflective conversations. Reflection on experiences in the technical field of work combined with personal questions and goals leads to awareness of students’ interests and abilities. Vos and Vlas (2000) state that these reflections can stimulate the development of students’ skills and professional identity. Furthermore, reflection leads to a better understanding of previous actions and connects knowledge with professional practice (Bolton, 2014). Reflection involves more than just talking about experiences of professionals and discussing the experiences of students in the field. There must be attention for students’ own actions and creating knowledge about the consequences of these actions. Overall, career guidance should include reflection to develop skills that lead to involved, curious and enterprising students (Kuijpers, 2015).
10 on themselves and their actions. Students experience difficulties with making establish links between the curriculum and their future career. Instead of a contribution to their own career development, students think of reflection as a mandatory component (Kuijpers & Meijers, 2009).
2.4 Designing feedback on professional identity
Two concepts that play an important role in the development of the feedback tool are the content and the presentation of the feedback. The first paragraph identifies requirements for effective feedback which should be included in the feedback tool. The second paragraph focusses on the design of the feedback tool and its presentation. In both paragraphs, important concepts are being explained and the available literature is being summarized.
2.4.1 Requirements of effective feedback
Feedback can be seen as information provided by an agent (e.g. person, book) that contains characteristics of one’s performance. The aim of feedback is to reduce discrepancies between the current performance and the intended performance (Hattie & Timperley, 2007). Empirical research shows that students are often incapable of understanding feedback and interpreting the information correctly (Quinton & Smallbone, 2010). Furthermore, students sometimes refuse to read feedback, they reject received feedback or hesitate to take actions as a consequence of the feedback.
Effective feedback answers three questions: ‘Where am I going?’, ‘How am I going?’, and ‘Where to next?’ (Hattie & Timperley, 2007). In other words, feedback should contain goals to stimulate goal-directed actions, information about progress, and information that challenges students to greater possibilities for learning. Furthermore, students prefer clear feedback that can be interpreted easily to avoid confusion about the content (Rae & Cochrane, 2008; Weaver, 2006). The provided information of the feedback should be understandable for students so they can act upon it (Brookhart, 2017; Omer & Abdularhim, 2017). Therefore, feedback should contain language that students can understand (Weaver, 2006).
Feedback requires a balance between positive and critical feedback (Weaver, 2006). Positive feedback, described in non-evaluative language, increases students’ confidence, motivation, and the expectation to successful goal attainment (Fishbach, Eyal & Finkelstein, 2010; Omer & Abdularhim, 2017; Weaver, 2006). To be effective, the positive formulated feedback needs to be purposeful and a goal setting plan needs to be included (Evans, 2013; Hattie & Timperley, 2007). Furthermore, effective feedback should be informative and meaningful to students to stimulate motivation and involvement (Evans, 2013; Hattie & Timperley, 2007). Lastly, the individual student should be at the center of the feedback (Weaver, 2006).
The discussion above shows that feedback needs to be understandable, informative, clear, positive, and goal-oriented. Such feedback could be assigned as effective feedback that gains insights into students’ performance. In the current study, the feedback needs to gain insights into students’ professional identity instead of their performance. Professional identity will not be improved after a certain period, but students’ professional identity can become stronger. Therefore, the objective of the feedback is to gain insights into students’ professional identity and into a career direction that suits the student, e.g. by the use of profiles to provide an image of a future career to stimulate further development of students. For the development of the feedback tool in this research we will take the above-listed requirements into consideration.
2.4.2 Design feedback tool through multimedia principles
11 learning can be defined as learning from materials whereby words and pictures are used (Mayer, 2002). Words could be presented as printed text or as spoken narration and pictures can include illustrations, photographs, charts, animations or videos (Issa et al., 2011; Mayer, 2002; Mayer & Moreno, 2003). Multimedia learning has shown to lead to better learning results (e.g. Issa et al., 2011). Therefore, multimedia presentation can be useful for the design of the feedback tool.
During the last decade, it has been investigated how people learn and how information can be presented in a way that supports people to learn (Mayer, 2002). People have two separate information channels; one channel for auditory/verbal materials and one channel for visual/pictorial materials. It can be concluded that people benefit the most from combining both channels and using both words and pictures in learning materials (Mayer & Moreno, 2003).
Mayer (2009) composed 12 principles for the design of learning materials to reach a maximal learning result by using both channels and combining different forms of multimedia in one lesson. For the design of the feedback of professional identity, not all principles can be used because the feedback will not include narration. This decision is made because the effect of the multimedia principle has been proven in research and research on narration varied in outcomes (e.g. Tabbers, Martens & Merriënboer, 2004). Therefore the remaining 6 principles of Mayer (2009) will be taken into account in this research.
Multimedia principle: students learn better from words and pictures than from words alone. When words and pictures are both presented in learning materials, students can construct verbal and pictorial models and build connections between them.
Spatial contiguity principle: students learn better when corresponding words and pictures are presented near rather than far from each other on the page or screen. When corresponding words and pictures are presented near each other, students do not need to visually search the page or screen and thereby using cognitive sources. Consequently, students seem more able to hold representations of both in working memory at the same time.
Temporal contiguity principle: students learn better when corresponding words and pictures are presented simultaneously rather that successively. When corresponding words and pictures are presented simultaneously, students seem more able to build mental connections between verbal and pictorial representations while representations of both will be in working memory at the same time. Signaling principle: students learn better when cues that highlight the organization of essential material are added. When signaling is used, students seem more able to pay attention to relevant materials whereby cognitive load will be reduced.
Segmenting principle: students learn better from a multimedia lesson when it is presented in user-paced segments rather than as a continuous unit. The use of user-user-paced segments by using a continue button will result in greater learning while students have the opportunity to reduce the load of information.
Personalization principle: students learn better from a multimedia lesson when words are in conversational style rather than formal style. When students receive learning materials in conversational style, the computer will be recognized as a social partner. For this reason students will focus more on the comprehension of the message.
12
2.5
The current study
Overall, the review of literature demonstrates that professional identity gained more attention over the last decennium. The importance of insight in professional identity to make well-developed career decisions and the professional identity of STEM students is examined in previous research (Möwes, 2016). However, still little is known about how information about STEM students’ professional identity can be provided and how this feedback can be presented in the best way to enhance well-considered career choices. Therefore, the current study will examine which information students need to gain insights into their professional identity and how a feedback tool can be designed to provide STEM students the needed information in a personalized manner. The review of literature about feedback identified five elements to provide effective feedback; feedback should be understandable, informative, clear, positive, and goal- oriented. Furthermore, the feedback should include a combination of images and texts. For that reason, the multimedia principles of Mayer (2009) should be taken into consideration when designing the feedback tool.
3.
Research question
In this research, the focus will be on gaining insight in professional identity. It will be investigated which information about professional identity is needed for STEM students to make well-considered career choices. Furthermore, it will be examined how a feedback tool can be designed to provide STEM students the needed information in a personalized manner.
This research is split into several steps. All steps are conducted to design a feedback tool that provides information about STEM students’ professional identity. Therefore the following research question is designed:
13
4.
Method
In this chapter, the several steps of this research will be discussed. First, the overall research design, followed by the respondents and instrumentation were described in detail. Lastly, the procedure and the analysis of the data were explained.
4.1
Research design
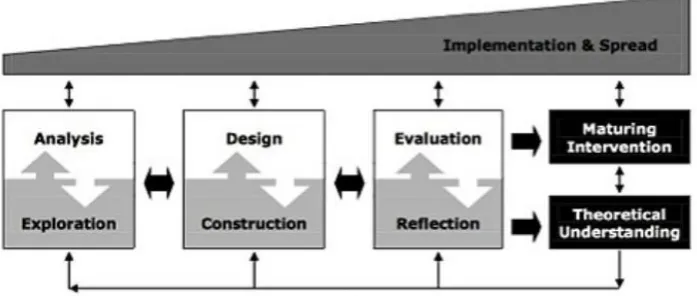
This study executed an educational design based research as described by McKenney and Reeves (2012) to answer the research question. An educational designed based research is defined as research in which iterative development of solutions to practical and intricate problems provides the circumstances for scientific inquiry (McKenney & Reeves, 2012). This study included three phases in line with the model of educational design based research (see Figure 1).
[image:13.595.83.432.374.522.2]During this study, a feedback tool to provide STEM students information to gain insights into their professional identity was developed. At the same time, the goal of educational design research was to develop usable knowledge that gains insights among participants and can be shared with other researchers (McKenney & Reeves, 2012). Therefore, the importance of STEM students opinions about the needed information to motivate them to read all information about their professional identity and their opinion about how the information could be presented were taken into account.
Figure 1. Model of Educational Design Research (McKenney & Reeves, 2012)
In the first phase (analysis), literature was used to analyze the concepts of career choice, professional identity, career guidance, and feedback. The first step was the performance of a literature review that resulted in the theoretical framework of this research. The second step included focus groups with STEM students to discuss design criteria for the feedback tool. The aim of the focus groups was to receive as much information as possible about the information STEM students needed to gain insight in their professional identity and how this information should be presented. The final aim of the first phase was to come up with design requirements for the feedback tool.
The second phase (design) consisted of the development of the feedback tool. The input of the STEM students during the focus groups was combined with the design criteria that arose out of the literature and focus groups. The feedback tool was developed in collaboration with a project team, consisting of a junior researcher, two master students and two senior researchers.
14 were approached by email (step 1) and a workshop for STEM students was given (step 2). STEM students were asked to evaluate the feedback tool and to discuss ways to improve the feedback. Furthermore, adjustments for the next version of the feedback tool will be discussed. The chronology of each iterative phase including the steps and the outcomes can be found in Table 1.
Table 1.
Chronology of the research design.
Phase 1 – analysis
Step Outcomes
Step 1: literature review Design requirements feedback
Step 2: focus groups Design requirements feedback
Overview needed information about the content of professional identity
Requirements for the presentation of the feedback
Phase 2- design Step Outcomes
The design of the feedback tool Web page that provides feedback about professional identity
Phase 3 – evaluation
Step Outcomes
Step 1: questionnaire Evaluation of the feedback tool Step 2: workshop students Applied Physics
Output: recommendations revised version of the feedback tool
4.2
Respondents
Phase 1, step 2 – Analysis
During the first phase of this research, STEM students were invited to discuss the needed information to gain insight in their professional identity during a focus group. Normally 3-5 focus groups are sufficient to reach saturation in the information (Morgan, 1997). A total of 36 STEM students participated voluntarily in the 6 focus groups; 14 STEM students of the University of Twente and 22 STEM students of Saxion University of Applied Sciences (6 female, 30 male). The size of the focus groups ranged from 4 to 11 STEM students. Krueger and Casey (2014) state that a focus group must be composed of 4 to 12 people to be small enough for all participants to share their ideas and to provide diversity of perceptions. Bachelor’s and Master’s students were contacted personally to participate in the focus groups and homogeneous sampling was used to form a group of students of the same educational program. Homogeneous sampling is often used to select focus groups and can be defined as sampling groups of participants because they have specific characteristics (Onwuegbuzie & Leech, 2007). In this study, all participants were selected because they were enrolled in a technical study program in Enschede.
Phase 2 – Design
No respondents were needed for the execution of phase 2.
Phase 3 - Evaluation
15 Qualtrics. All 36 STEM students were approached, whereby 5 students participated in the evaluation. Furthermore, a workshop was organized for a new group of STEM students. A total of 11 STEM students of the University of Twente participated voluntarily in this workshop; 9 male, 2 female. All students were in the final year of their bachelor’s program Applied Physics and were selected by convenience sampling. Convenience sampling (Onwuegbuzie & Leech, 2007) was chosen, because a researcher of the project team had connections with the study advisor of Applied Physics. For the workshop, the same questionnaire as for previous participants was used to evaluate the feedback tool. Furthermore, the questionnaire was used as a starting point for the discussion at the end of the workshop and the open questions were used as a common thread in this discussion.
4.3
Instrumentation
Phase 1 - Analysis
The goal of the focus groups with STEM students was to determine the design requirements of the feedback tool and to map the information that STEM students would like to receive about their professional identity. The objective of a focus group is to obtain perceptions of people about a specific topic and is used to collect opinions and ideas (Krueger & Casey, 2014). Previously, a focus group guide was developed based on the design requirements of the literature review. The script of the focus group guide can be found in Appendix A.
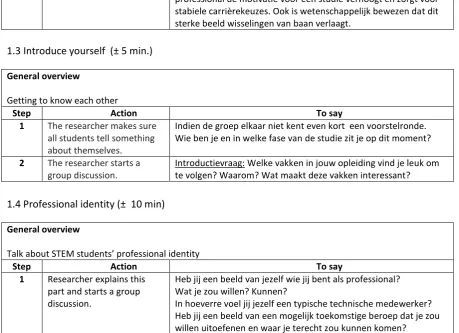
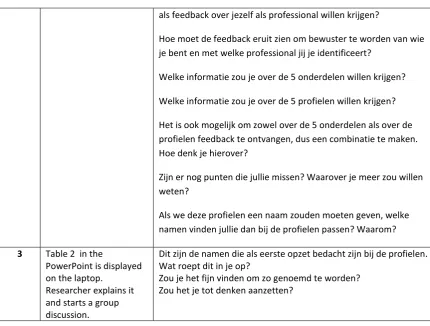
The introduction of the focus group guide existed of three questions focused on professional identity. The first question during the focus group discussion was: ‘’Do you already have a clear picture of yourself in your professional role?’’. The aim of this introduction was to turn the STEM students in the right direction of professional identity. Next, the focus group discussion was split into two parts: the content of the feedback and the presentation of the feedback. The first part included ten key questions about the content of professional identity, such as ‘’What kind of information would you like to receive about yourself as a professional after filling in the Career Compass?’’. The second part comprised eight key questions about the design of the feedback. Meanwhile, a PowerPoint presentation was used to show visual feasible possibilities for the design of the feedback. The PowerPoint slides were shown after the discussion of the first open question ‘’Do you already have ideas about the presentation and visualization of the information about professional identity?’’.
Phase 2 – Design
No instruments were needed for the execution of phase 2.
Phase 3 - Evaluation
16 profiles capture who I am as a professional’’ and ‘’The texts about the profiles are useful for study-related choices’’ for the profile texts and dimension texts and existed of 4 items.
A seven-point Likert scale was used in which 1 = strongly agree and 7= strongly disagree. The questionnaire included 68 questions to evaluate the feedback tool; 50 Likert scale statements for the measurement of the variables and to check the clarity of all images and texts, 16 open questions with a text box to come up with more ideas or to substantiate the preference, and 2 multiple answer questions to get an overview of the texts and pictures that should be included in the feedback tool according to the students. The order of questions corresponded with the order of information provided by the feedback tool. The questionnaire can be found in Appendix B.
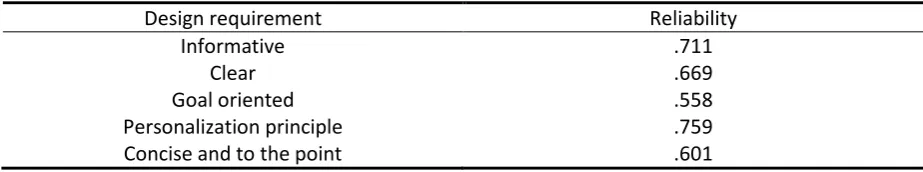
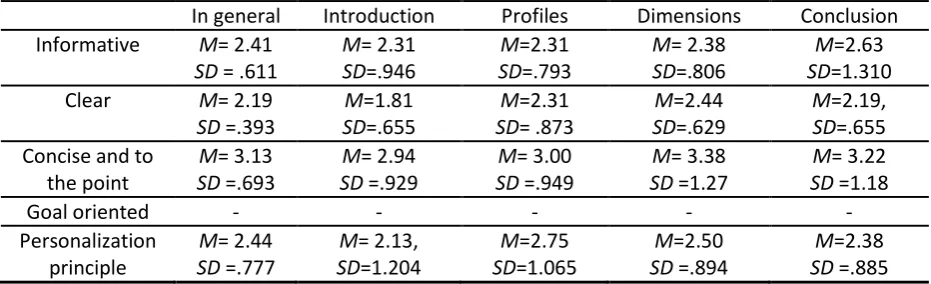
[image:16.595.64.526.375.461.2]The questionnaire was tested on its reliability. Therefore, Cronbach’s Alpha (α) was used to measure the extent to which all items measured the same variable. Cronbach’s Alpha (α) ranged from .558 to .759 which can be found in Table 2. The variables informative and the personalization principle showed a Cronbach’s Alpha above .70 which is sufficient in the initial level of development of the instrument (Tavakol & Dennick, 2011). The variables concise and to the point and clear had a Cronbach’s Alpha between .60 and .70 which can be presumed as acceptable given the limited number of test items in the instrument (Berger and Hänze, 2015). Unfortunately, the variable goal oriented turned out to be insufficient.
Table 2.
Reliability design requirements
Design requirement Reliability
Informative .711
Clear Goal oriented
.669 .558
Personalization principle .759
Concise and to the point .601
4.4
Procedure
Phase 1 - Analysis
17 Phase 2 - Design
The feedback tool was developed at the University of Twente. The findings of phase one formed the starting point for the design. Furthermore, the Career Compass and the existing profiles and dimensions of Möwes (2016) were taken into account.
The first step of the development of the feedback tool consisted of writing the texts. The texts existed of four parts: introduction, profiles, dimensions, and the conclusion. In the introduction, the purpose of the web page was explained. Next, a general profile was provided with dimensions that suits the student. These dimensions were explained for each element and finally the step from professional identity to a specific profession was described in the conclusion. We aimed to use as little text as possible, but at the same time provide the STEM students with valuable information on professional identity, the profiles, the dimensions, and the next steps (informative, concise and to the point). To ensure comprehension of all texts, complex words and specific terms were avoided and all terms that belong to a dimension were explained in terms of a future career (understandable, clear, goal oriented). The texts needed to stimulate STEM students to reflect on themselves and to take their own personality, interests etc. as a starting point. Therefore open questions were used in the written texts and the texts were formulated positively (positive). Lastly, the focus of the design of the texts should be responded to the signaling principle, segmenting principle, and personalization principle of Mayer (2009) (use of multimedia principles). Texts were written in a personalized style whereby the individual students must be able to identify themselves to correspond with the personalization principle. Furthermore, on each page paragraphs were used to offer the students segments and to ensure that students understood where they could find specific information.
The second step in the development of the feedback tool was the design of images to give students the opportunity to combine visual materials with texts which suits the multimedia principle. The aim of the images was to provide visual information that should be clear to students in a glance without textual explanation. Furthermore, the images should be informative and understandable, and the multimedia principles should be taken into account. The first draft of the feedback tool was developed during the iterative process within the project team consisting of a junior researcher, two master students and two senior researchers.
The last step in the development of the feedback tool was the presentation of the texts and images on a web page.
Phase 3 - Evaluation
STEM students who participated in the focus groups received an email with the URL to the questionnaire. The questionnaire in Qualtrics included an introduction that briefly explained the purpose of the questionnaire and asked students to evaluate the feedback tool that included their input. The feedback was provided to students by the use of a webpage. On this webpage, they could find general feedback that was concentrated on a fictive STEM student. In fact, students received feedback that did not concerned themselves and they needed to judge if the feedback gains insights into their professional identity. In line with the ethical guidelines participants were informed of their voluntary participation, the possibility to stop at any moment and the anonymous processing of their data. One key user was asked for the pilot of the questionnaire. Afterwards, small adjustments, such as adding a blank line after five questions were made.
18 professional identity and the Career Compass. Then students were asked to fill in the Career Compass themselves. They received general outcomes within a week. After filling in the Career Compass, students were asked to evaluate the feedback tool by using the same questionnaire and webpage as the first group of participants. Lastly, a group discussion was started to gain more insights into advantages of the feedback tool and adjustments that can be made according to this group of STEM students.
4.5
Data analysis
Phase 1 - Analysis
The voice records of the focus group discussions were transcribed afterwards and analyzed within Atlas.ti. The analysis was done by the use of a codebook which can be found in Appendix C. After the development of the first draft version one focus group was coded by the researcher and inter-rater reliability was calculated to account for variation between coders. Next, small adjustments were made and the codebook was finalized.
The final codebook existed of 26 codes; 11 codes for the introduction of professional identity, 6 codes for the content of professional identity, and 9 codes for the presentation of the feedback. The introduction part included sub codes such as ‘’Students show insight in their own competences’’ and ‘’Making appropriate study-related choices’’. Sub codes for the content of professional identity were for example ‘’Students described their preferences for the content of the feedback about the five dimensions’’ and ‘’Students’ opinions about the current profile names’’. For the presentation of the feedback sub codes such as ‘’Students opinions about comparing their outcomes with the average scores of employees’’ and ‘’Provide texts and images that match each other simultaneously’’ were used. Useful statements of students were coded and received one or more sub codes, depending on the statements. For example, the statement ‘’Suppose you select profile 2 and when you click on this profile the image emerges and another click will show the profile text next to the image’’ received the sub codes 3a1: ‘’A description of the design of the feedback’’, 3c1: ‘’Multimedia principle: Combine texts and images’’ and 3f1: ‘’Segmenting principle: present the information in user-paced segments rather than as a continuous unit’’ . As a second step, statements from the same sub codes were compared to find differences and similarities. Last, the cohesion between the codes was analyzed.
At the end of each focus group discussion, the most important aspects were summarized by the researcher to ensure a correct interpretation of the input. Important aspects that were indicated by the majority of the students in the focus group discussions were taken into consideration for the design of the feedback tool.
From the total of 6 transcripts of the focus groups, 16,67% of the data (one full transcript of a focus group) was coded by an independent second researcher to compute inter-rater reliability. The Cohen’s Kappa κ varied from 0.656 to 0.937 with an overall Cohen’s κ of 0.802. As 0.656 was a moderate score (McHugh, 2012), part 3 of the codebook was described more clearly. For example, the definition of ‘suggestions’ did not describe clearly enough that this was specifically related to the suggestions of the students about the presentation. As a consequence, fragments of suggestions about profiles and dimensions were frequently coded as suggestions about the presentation. The second coding resulted in an inter-rater agreement of 0.709 for part 3 and an overall Cohen’s κ of 0.824 which could be described as ‘almost perfect’ (McHugh, 2012).
Phase 2 – Design
19 Phase 3 – Evaluation
The data from the questionnaire was analyzed in IBM SPSS Statistics 23 for descriptive statistics to analyze the mean and standard deviation for each design requirement. Furthermore, the mean and standard deviation were measured for the design requirements for each separate text. Data from the open questions was summarized to gain more insights into advantages of the feedback tool and adjustments that can be made. Last, the next version of the feedback tool was described.
20
5.
Results
In this chapter the results of the three phases of this study will be discussed. The current research aimed to examine how feedback about professional identity can be presented to STEM students to support them in making well-considered career choices. The first goal of this study, phase 1, was to establish design requirements for the feedback tool. Furthermore, it was investigated which information about professional identity STEM students find important and how this information could be presented attractively. Next, during phase 2, the first draft of the feedback tool was created. Lastly, STEM students were invited to evaluate the feedback tool in phase 3.
5.1 Phase 1
The literature review resulted in a list of four design requirements which the feedback in the tool must comply: informative, clear, goal oriented, and the use of multimedia principles. Subsequently, the focus group guide for the focus group discussions of step 2 was based on these design requirements.
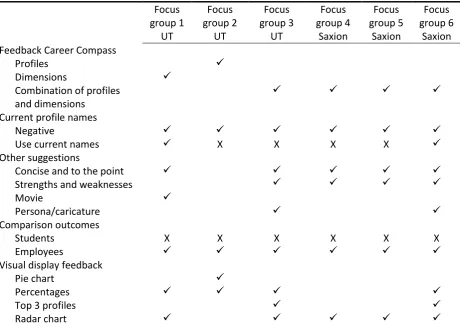
[image:20.595.63.524.452.782.2]The aim of the feedback tool was to provide STEM students insights into their professional identity and to encourage them to orientate themselves towards their future career. These results show opinions about the content and the presentation of the feedback tool which are mostly shared by the majority of the group. However, also individual opinions are shown to illustrate interesting thoughts of students. The checkmarks in Table 3 represent important aspects for the feedback tool and the crosses represent unimportant aspects for the feedback tool according to the STEM students. Furthermore, an empty box in the figure represents an aspect that is not discussed during the focus group. The different aspects will be explained further on in the results.
Table 3.
Most and least important aspects for the feedback tool. Focus group 1 UT Focus group 2 UT Focus group 3 UT Focus group 4 Saxion Focus group 5 Saxion Focus group 6 Saxion Feedback Career Compass
Profiles
Dimensions
Combination of profiles and dimensions
Current profile names
Negative
Use current names X X X X
Other suggestions
Concise and to the point Strengths and weaknesses
Movie
Persona/caricature
Comparison outcomes
Students X X X X X X
Employees
Visual display feedback
Pie chart
Percentages
Top 3 profiles
21
The compass
Combination of the radar chart and the compass
Multimedia principles
Spatial contiguity principle Temporal contiguity principle
Signaling Principle
Segmenting principle
Multimedia principle
Personalization principle
5.1.1 Professional identity
As an introduction, students were asked about their knowledge and ideas about their own professional identity.
In general, the majority of the students are enthusiastic and curious about getting insight in their professional identity and the development of the feedback tool. One student indicated: ‘’I believe it is a useful tool that supports you to get to know yourself better’’. Furthermore another student mentioned: ‘’I think you will get more aware of your own personality if the outcome is in line with your own thoughts.’’. In addition, insight in professional identity was considered positive in all focus groups. The following excerpts showed this: "I really want to know my strengths, my weaknesses, and towards what kind of career I am working.", ’’I believe it is always important to have an idea about the possible options for your future career.’’. Most students did not have a clear picture of their professional identity yet. A student indicated: ‘’I made the decision for a technical study. At least, that is a direction, but my focus was not on a future career already.’’ On the other hand, there were also students who already had a clear picture of themselves, what they wanted, and what they could do in their future career. One student indicated: ‘’For the research project I am looking for a career in the security direction, because I would like to choose that direction for a master education. So I am going to see if the master fits my ideas’’.
Students saw potential in the feedback tool and argued that feedback could help to raise awareness of themselves: "What you want is students to come home and talk about their professional identity with their parents or other students". This excerpt demonstrated that students were interested in their future career and that the feedback tool could ensure students are encouraged to talk to others about their personal feedback. Furthermore, the outcomes of the feedback tool could stimulate students to conversations about the future career.
Situations for the usage of the feedback
In most focus groups, students indicated that it brings added value when you get to know yourself during the educational program. The students believed this information has a positive impact on making study-related choices. One student indicated: ‘’Once you know yourself, you can make better choices, such as what specific master you want to choose’’. Another student presented a practical example: ‘’At the moment, it might be useful for me, since I still have doubts about what I would like to do for my internship’’.
22 students mentioned that it is important to choose a direction that suits you to get a better idea of a profession for the future career.
5.1.2 Content of the feedback of the Career Compass
The design of the feedback tool can be divided in the content and the presentation of professional identity. In this paragraph, the content of the feedback will be discussed to clarify which information about professional identity should be presented to STEM students.
Profiles and dimensions
After completion of the career compass the feedback about professional identity could be presented in profiles or dimensions. First, students were asked to brainstorm about obtaining feedback in profiles. Next, students’ opinions about feedback in dimensions were examined. Lastly, the combination of profiles and dimensions was discussed.
In most focus groups, students' first reactions about profiles were quite negative. Students felt being labeled when profiles were used: ‘’I am not quite a fan of profiles’’. Another student mentioned: ‘’As if there are only five kinds of people on this earth’’. Remarkable was that especially students of the University of Twente were negative about the idea of using profiles. However, after the first resistance students in almost all focus groups came up with the positive characteristics of profiles. Advocates of the use of profiles argued that profiles entail a lot of information in their content. One student specified: ‘’This gives more content of what a particular interest or value has to do with a specific profile. It will give you extra information.’’. Opponents of profiles became more enthusiastic of profiles when they heard the idea of presenting more than one profile in the feedback.
Furthermore, during the group discussion they began to see the advantage of getting a general idea of themselves in a profile which will be specified by the personal dimensions.
Students were more enthusiastic about feedback which focused on dimensions. One student indicated: ‘’You definitely want to see the wordsthat characterize you’’. Furthermore, another student argued: ‘’You will receive more information about yourself and not only a standardized profile’’. There is only one point of improvement, pointed out by the students, because in the current version of the feedback tool, only words of the dimensions are mentioned and they would like to know how the current feedback of dimensions can be used towards a future profession. One student illustrated: ‘’Imagine being very emotional according to the test. Than you would like to know in what occupations this characteristic can be useful.’’. These excerpts showed that students would like to get an explanation of the dimensions to encourage them to think about their future career.
Although students seem more interested in dimensions, the majority of the students favored a combination of the two types of feedback where they would see a profile which they align with and the corresponding dimensions. In the first place students criticized the profiles, because they only gave a general idea of a person instead of dimensions which were more specifically describing your personal characteristics. One student indicated: ‘‘Dimensions are a bit more personal than a profile. Then you know what kind of person you are and you also see that you do not fit 100% within such a profile’’.
Profile names
23 did not believe the profile names encouraged students to read all feedback and stimulated students to think about themselves as a professional. The following excerpt showed these thoughts: ‘’It just sounds unfriendly. You are not satisfied with the results and will be discouraged to read all information’’. As a consequence, four groups of students discommend using these profile names in the feedback. According to half of the groups profile names were not necessary for the feedback. Furthermore, they suggested formulating the profile names in a positive way when names will be used. Conversely, when students were asked to think about profile names themselves they come up with negative formulations such as: ‘’shadow, autist, and control freak’’.
Other suggestions about the content
Concise and to the point was mentioned as an important requirement that should be taken into account for the development of the content of the feedback tool. Students of five focus groups specified this aspect as important considering the length of the texts. One student indicated: ‘’I would like to receive feedback that includes a concise, punctual summary of the dimensions that suit me’’. Another student mentioned: ‘’ A concise and to the point overview of typical characteristics of students in that specific profile’’.
Strengths and weaknesses were mentioned by students in four focus groups as an important aspect for the content of the feedback. One student mentioned: ‘’I believe that a list of strengths and weaknesses from a person that fits with a specific profile would be very clear’’. The preference for ‘strengths and weaknesses’ is particularly mentioned by students of Saxion University of Applied Sciences. All groups of Saxion University of Applied Sciences mentioned this aspect as important: ‘’I believe you will become aware of your strengths and the skills that need improvement’’. In addition, all students of Saxion University of Applied Sciences believed the feedback must be positively formulated and presented with few words. They believe this kind of feedback would motivate students to read all information and stimulate them to work towards their future career.
Comparison outcomes
Most students of all focus groups indicated that they were not interested in comparing feedback with other students, because the feedback will suit your personality. One student explained: ‘’You can compare yourself with someone else, but the feedback is about your own skills and qualities. You want to get those things clear’’. Students misinterpreted the idea of comparing feedback with other students. The idea was to find out if students wanted to compare their scores with the average score of all students, but they interpreted it differently. Students thought their feedback would not remain anonymously and would be provided to other students. One student indicated: ‘’I prefer to keep the feedback to myself’’.
In contrast to the comparison with other students, all students were enthusiastic about the possibility to make a comparison with employees: ''I would like to get a better idea between what kind of people and in which sector I would fit''. Students of two focus groups suggested to connect the feedback to the specific educational program they follow. One student argued: ‘’By generating a job profile; this profile fits your outcomes. This fits the education and represents the personal future career opportunities’’.
5. 1.3 The presentation of the feedback tool
24 Images and charts
In almost all focus groups the ‘radar chart’ was mentioned as an important aspect of the visual display of the feedback tool. The radar chart contained all five profiles and students could find to what extent they matched with a specific profile. The chart could be interpreted easily and the message was clear. One student indicated: ‘’With the radar chart you can easily identify in which profile you fit’’. Another student pointed out: ‘’You already receive a lot of information from the radar chart.’’ Furthermore, ‘the compass’ in the current design was mentioned by four focus groups as an important aspect to clarify all dimensions. The compass displayed pictures of all dimensions. Most students were enthusiastic about the design of the compass: ‘’I believe the compass has a good-looking design’’. Combining ‘the radar chart’ and ‘the compass’ in the feedback tool was mentioned by three groups.
Furthermore, ‘using percentages’ was mentioned by students in four groups. Students in these four groups would like to see the distribution of profiles by the use of percentages. One student suggested: ‘’Preferably expressed as a percentage; a match of 60% with that profile’’. Another student explained: ‘’Using percentages is just like filling in a test about a political party; 60% VVD, so 60% profile 1’’. It is remarkable that all groups of UT students mentioned this aspect in contrast to only one group of students of Saxion University of Applied Sciences. In the other two groups of students of Saxion University of Applied Sciences the radar chart instead of percentages was discussed, because the radar chart and the percentages were presented on the same slide. These groups of students talked a lot about the radar chart and the researcher did not focus specifically on their opinion about the use of percentages. Lastly, in two focus groups students talked about making a top three from profiles that fits with student’s preferences. The following excerpt demonstrated this idea: ‘’You would not only want to know everything about the most dominant profile, but also the profile thereafter. A top three.’’. As shown in Table 1, ‘the radar chart’, ‘the compass’, and ‘percentages’ are considered as the most important aspects for the visual display of the feedback.
Multimedia principles
As shown in Table 1, four multimedia principles were mentioned during the focus group discussions. In all focus groups students mentioned the preference for the combination of text and visual data (multimedia principle). One student indicated: ‘’The use of something visual is better than just a written text. It will become more interesting to look at’’. In addition, students already came with concrete ideas: ‘’Using the spider web in combination with a text to explain the outcomes; Why does profile 2 suits me?’’. Furthermore, students talked about presenting words and pictures simultaneously (temporal contiguity principle). One student suggested: ‘’Click on a part of the spider web and then get the extended information about what it means to score high on that profile’’.
25 5.1.4 Summary phase 1 towards design requirements
In this paragraph design requirements, important aspects, and misinterpretations that should be taken into account by the design of the feedback tool are specified. An overview can be found in Table 4.
STEM students were all unanimous that they would like to receive feedback about professional identity. As a result, they came up with a lot of ideas about the feedback tool.
It was examined that students preferred feedback that contains a combination of feedback in profiles and dimensions. Furthermore, students indicated the need for an explanation about the dimensions in the feedback tool to understand how they can benefit from a specific dimension in a future career. Overall, in almost all focus groups students mentioned concise and to the point as a design requirement for the texts of the feedback.
A lot of students highlighted the negatively formulated profile names. Consequently, they were asked to come up with profile names themselves. In all focus groups, only negative formulated profile names were mentioned. Therefore, the current profile names will be used in caution and combined with the radar chart. To find out how students experienced this combination, this topic should be discussed in the evaluation.
During the focus group discussions the idea of comparing outcomes was not obvious for students. They believed their scores would be shared and not remain anonymous instead of being able to compare their own score with the average of all STEM students. Therefore, individual scores of students will be compared with the average score of all students in the first draft of the feedback tool. It will be examined in the evaluation phase how students feel about this solution to compare their feedback in an anonymous way.
Although there are five dimensions specified in the Career Compass it was remarkable that a lot of students only mentioned strengths and weaknesses when discussing the content of the feedback tool. The other dimensions remained underexposed, in particular in the focus groups with students of Saxion University of Applied Sciences. Therefore, the focus of the feedback tool should be on all five dimensions.
Students in most focus groups were interested in outcomes that focused on specific future jobs. The main goal of the feedback tool is presenting information about their own professional identity to stimulate thinking about future career jobs. Therefore, making a step from professional identity to specific professions needs attention in the feedback tool.
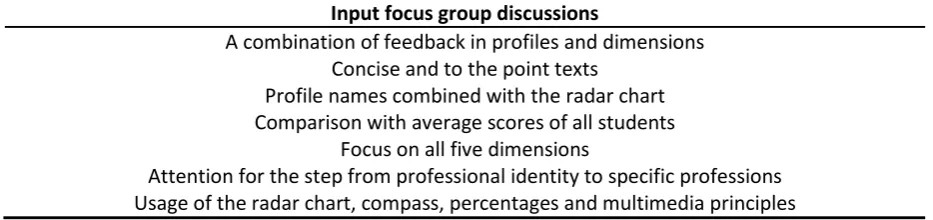
[image:25.595.63.530.665.775.2]Lastly, for the presentation of the feedback students preferred the radar chart, the compass, and percentages. Furthermore, all six multimedia principles need to be taken into account in the development of the web page: spatial contiguity principle, temporal contiguity principal, multimedia principle, signaling principal, segmenting principle, and personalization principle.
Table 4
Input of STEM students in the focus group discussions.
Input focus group discussions
A combination of feedback in profiles and dimensions Concise and to the point texts
Profile names combined with the radar chart Comparison with average scores of all students
Focus on all five dimensions
26
Phase 2 – Design
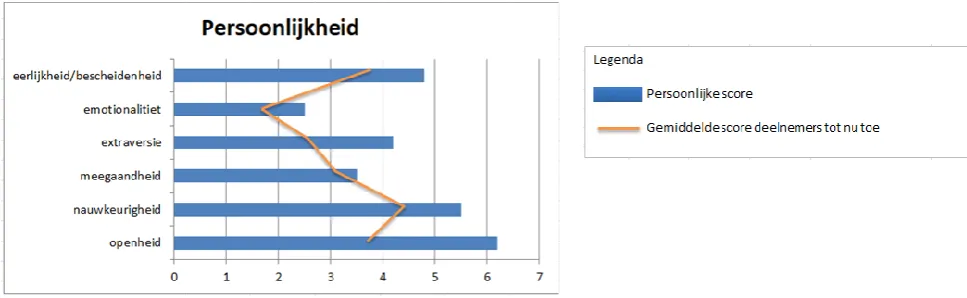
[image:26.595.84.286.283.433.2]The developed web page started with an explanation of professional identity and the goal of the feedback tool. The second page consisted of the profiles. First, a stage with the top 3 of corresponding profiles was shown. At the same time, the radar chart with corresponding percentages for all profiles was presented (see Figure 2). A trendy image and an informative image were both chosen to find out if students were interested in a quick result or in details. On the next pages, the profile texts with the radar chart were presented simultaneously and near each other on the screen. The third part of the web page was focused on the dimensions and started with the image of the compass designed by Möwes (2016). All dimension texts were presented with the image of the compass and a corresponding bar chart of their individual scores and the average scores of all STEM students on that specific dimension (see Figure 3). To conclude, the next steps to gain insight in yourself as a professional and to find out which career fits your professional identity were described on the last part of the web page. The feedback tool can be found at http://feedbackcc.jouwweb.nl.
Figure 2. The top 3 and the radar chart for the profiles
Figure 3. Bar chart ‘personality’
[image:26.595.71.555.474.623.2]27 Figure 4. Profile text and dimension text
Table 5.
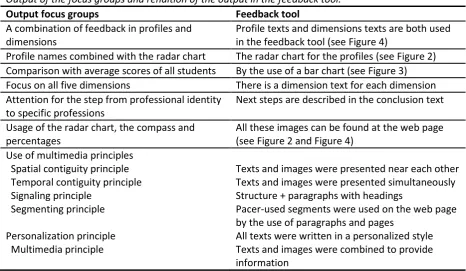
Output of the focus groups and rendition of the output in the feedback tool.
Output focus groups Feedback tool
A combination of feedback in profiles and dimensions
Profile texts and dimensions texts are both used in the feedback tool (see Figure 4)
Profile names combined with the radar chart The radar chart for the profiles (see Figure 2) Comparison with average scores of all students By the use of a bar chart (see Figure 3) Focus on all five dimensions There is a dimension text for each dimension Attention for the step from professional identity
to specific professions
Next steps are described in the conclusion text
Usage of the radar chart, the compass and percentages
All these images can be found at the web page (see Figure 2 and Figure 4)
Use of multimedia principles Spatial contiguity principle Temporal contiguity principle Signaling principle
Segmenting principle
Personalization principle Multimedia principle
Texts and images were presented near each other Texts and images were presented simultaneously Structure + paragraphs with headings
Pacer-used segments were used on the web page by the use of paragraphs and pages
All texts were written in a personalized style Texts and images were combined to provide information
Phase 3 - Evaluation
Two steps can be divided for the evaluation of the feedback tool. The first step included the results of the questionnaire. The second step was to describe the next version of the feedback tool.
Results questionnaire
For the evaluation by the use of a questionnaire a seven-point Likert scale was used in which 1 = strongly agree and 7= strongly disagree. In order to examine the views of STEM students about the five design requirements in the feedback tool, the mean and standard deviation were measured. First, a general mean of the design requirement was determined for all texts of the feedback tool. Next, a closer look was taken for each separate text.
[image:27.595.65.532.285.556.2]28 introduction (Berger and Hänze, 2015). It should be kept in mind that only one item was used in the questionnaire to measure this design requirement. Furthermore, the four texts had different structures, which could explain different opinions between texts. The scale for goal oriented turned out to be unacceptable after the measurement of Cronbach’s Alpha even after deleting one item. Therefore, no statements could be done about the goal oriented view of the texts.
[image:28.595.65.531.300.442.2]Students were able to identify themselves with the texts and to focus on the comprehension of the message in the texts (M= 2.44,SD =.777). Furthermore, students believed the texts were concise and to the point (M= 3.13, SD =.693). This scale turned out to be acceptable after the measurement of Cronbach’s Alpha (Berger and Hänze, 2015). For the same reason as for clearness, the moderate value of Alpha could be explained by the low number of questions that measured the design requirement (Tavakol & Dennick, 2011). The mean and standard deviation for each design requirement and for each component can be found in Table 6.
Table 6.
Mean and standard deviation for the design requirements
In general Introduction Profiles Dimensions Conclusion Informative M= 2.41
SD = .611
M= 2.31 SD=.946
M=2.31 SD=.793
M= 2.38 SD=.806
M=2.63 SD=1.310 Clear M= 2.19
SD =.393
M=1.81 SD=.655
M=2.31 SD= .873
M=2.44 SD=.629
M=2.19, SD=.655 Concise and to
the point
M= 3.13 SD =.693
M= 2.94 SD =.929
M= 3.00 SD =.949
M= 3.38 SD =1.27
M= 3.22 SD =1.18
Goal oriented - - - - -
Personalization principle
M= 2.44 SD =.777
M= 2.13, SD=1.204
M=2.75 SD=1.065
M=2.50 SD =.894
M=2.38 SD =.885
Besides Likert scale statements, the questionnaire included open questions to come up with more ideas or to substantiate the preferences. These open questions also formed the common thread for the discussion at the end of the workshop. In general, the remarks confirmed the outcomes of the questionnaire, e.g. about the informative character of the bar charts. Additional remarks were particularly made on the image of the top 3, the profile names, and the amount of the text. Students stated that the image of the top 3 had no added value for the feedback, because the radar chart provided more details and included all needed information. Furthermore, students described the contrast between the profile names. Nerd and Einzelgänger had a negative exposure whereas the Allrounder had a positive exposure according to the students. They preferred names for the profiles, but the profile names needed to be positive formulated. In general, all students would read the information, but they had divided opinions about the amount of text. Some students would scan all information, whereas other students would quit reading when they read information that does not suit them and the last group of students would read all information.
Feedback tool version 2.0