4 fig.
Distribution of the Heavy Minerals in the Downwind Tephra Lobe of the May 1 8 , 1 9 8 0 Eruption of the Mount St. Helens (Washington, USA)
E T I E N N E J U V I G N E & S U S A N S H I P L E Y * )
Correlation, marker bed, volcanic ash, heavy mineral, hornblende, hypersthene, quantitative special distribution, analyse, eruption, Upper Holocene.
Washington, Mount St. Helens
A b s t r a c t : Quantitative analysis of heavy minerals from tephra samples of the May 18 eruption of Mount St. Helens shows variations in the total content of heavy minerals as well as in the ratio hypersthene/hornblende. Both decrease along the lobe with increasing distance from the volcano and from the lobe margins to the axis. The basal dark-grey layer contains more hypersthene than the overlying light-grey layer. The observed sorting is a function of the specific gravity of the minerals, and grain shape. Variation across the lobe is attributed to the relative thicknesses of the dark- and light-colored layers.
[Schwermineralverteilung i m Verbreitungsgebiet der A s c h e n v o m Ausbruch d e s Mount Saint H e l e n s (Washington-U.S.A.) a m 18. 5.1980]
K u r z f a s s u n g : Die stratigraphische Korrelation von vulkanischen Leithorizonten auf
grund ihrer Schwermineralzusammensetzung bringt Probleme mit sich, da die Frage, ob die Zu
sammensetzung im Verbreitungsgebiet konstant oder wechselnd ist, noch nicht eindeutig geklärt werden konnte. In Europa stellt sich dieses Problem im wesentlichen bei unterschiedlichen tuffiti- schen Lagen (Laachersee Tuff, Eltviller Tuff, Tuf de Rocourt). Dieser Beitrag betrifft die Aschen, die vom Mount Saint Helens-Vulkan am 18. 5. 1980 gefördert wurden. Davon wurden quan
titative Analysen von Schwermineralien in der Absicht durchgeführt, tephrostratigraphische P r o bleme zu lösen. Es wurde nachgewiesen, daß der Gehalt an Schwermineralen mit der Entfernung vom Vulkan und zum Rand des Verbreitungsgebietes hin abnimmt. Die transparenten Schwer
minerale bestehen im wesentlichen aus Hypersthen und basaltischer Hornblende. Das Verhältnis Hypersthen/Hornblende ändert sich schrittweise mit der Entfernung vom Vulkan und der Ent
fernung von der Hauptachse zum Rand des Verbreitungsgebietes. Die Ursachen liegen in der unterschiedlichen Dichte und Form der einzelnen Minerale. Änderungen innerhalb des Verbrei
tungsgebietes hängen ferner von der wechselnden Dicke der dunklen und hellen Schicht ab. Es ist auch nachgewiesen, daß die Prozentsätze der Schwermineralspektren innerhalb eines kleinen Ge
bietes, unter Berücksichtigung der Fehlergrenzen (95 °/o Niveau), übereinstimmen.
I n t r o d u c t i o n
I n t h e last 30 years t e p h r a layers, a n d especially their c o n t e n t of h e a v y m i n e r a l s , h a v e been used as a basis for c o r r e l a t i o n of Q u a t e r n a r y deposits. I n s o m e cases, differences in t h e m i n e r a l o g i c a l content a d d t o difficulties of c o r r e l a t i n g ash l a y e r s such as "Laachersee Tuff" ( J U V I G N E 1977, 1983), "Eltviller Tuff" (BIBUS 1 9 7 3 ; J U V I G N E & SEMMEL 1981),
"tuf de R o c o u r t " ( J U V I G N E 1977b) a n d " r e t o m b e superieure" ( M A R T I N I 1971). H e n c e a n i m p o r t a n t question is t h e v a r i a t i o n in c o m p o s i t i o n of a single ash-fall w i t h d i s t a n c e f r o m t h e source v e n t .
::
") Addresses of the authors: D r . E. J u v i g n e , University de Liege, Laboratoire de Geomor
phologie et de Geologie du Quaternaire, Place du X X Aoüt, 7 - 4000 Liege, Belgium. — S u s a n S h i p l e y , Quaternary Research Center, University of Washington, Seattle, WA 98195.
ISSN-Nr. 0424 - 7116 / 83 / 0 0 3 3 - X X X $ XXX
© 1983 Schweizerbart'sche Verlagsbuchhandlung, D-7000 Stuttgart 1
d e m o n s t r a t e t h e possibility of c o r r e l a t i n g ash l a y e r s w h o s e h e a v y m i n e r a l c o n t e n t s a r e q u a n t i t a t i v e l y different.
T r a n s p a r e n t h e a v y m i n e r a l s u i t e s o f t h e d a r k a n d t h e l i g h t l a y e r s P r e l i m i n a r y analyses of t h e composition of t h e d o w n w i n d b a s a l d a r k - g r e y a n d o v e r l y i n g l i g h t - c o l o r e d ash l a y e r w e r e r e p o r t e d b y S A R N A - W O J C I C K I et al. (1981). Since this w o r k , t w o l a y e r s h a v e been distinguished w i t h i n t h e l i g h t - c o l o r e d l a y e r : a light-grey u n i t o v e r l a i n by a t a n u n i t .
F o r this p a p e r , samples f r o m each layer w e r e collected in J u l y , 1982 at 6 localities a l o n g the axis of t h e lobe (Fig. 2 ) . T h e t a n l a y e r w a s n o t discernible at t h e t w o w e s t e r n m o s t localities, so analyses a r e l i m i t e d here t o b u l k l i g h t - c o l o r e d ash a n d elsewhere t o t h e d a r k - a n d l i g h t - g r e y layers. C a r e w a s t a k e n t o r e m o v e a n y r e w o r k e d or u n d e r l y i n g m a terial from t h e samples.
M e t h o d
All the samples w e r e t r e a t e d b y t h e following m e t h o d :
1. W e t sieve t h r o u g h screens of 500 / i m a n d 63 /urn; a v o i d a b r a s i o n of samples d u r i n g sieving.
2. D r y 6 3 — 5 0 0 jum fraction in o v e n .
3. S e p a r a t e in purified b r o m o f o r m (density: 2.89) using a centrifuge ( J U V I G N E 1979).
4. M o u n t h e a v y m i n e r a l s in C a n a d a balsam.
5. C o u n t 200 t r a n s p a r e n t h e a v y minerals f r o m each slide using t h e ribbon m e t h o d .
R e s u l t s
T h e most c o m m o n h e a v y m i n e r a l s are o r t h o p y r o x e n e s a n d a m p h i b o l e s . I n v e s t i g a t i o n s b y K U N T Z et al. (1981) of deposits of the M a y 18 e r u p t i o n h a v e s h o w n t h a t all a m p h i b o l e c a n be considered t o be h o r n b l e n d e a n d all o r t h o p y r o x e n e t o be h y p e r s t h e n e . A m p h i b o l e s c a n be essentially considered b r o w n h o r n b l e n d e . H y p e r s t h e n e p l u s amphiboles r e p r e s e n t a t least 95 % of t h e t o t a l t r a n s p a r e n t h e a v y m i n e r a l s of o u r samples. T h e o t h e r 5 °/o consists of traces of c l i n o p y r o x e n e s a n d u n k n o w n m i n e r a l s .
T h e p e r c e n t a g e s of a m p h i b o l e s a n d o r t h o p y r o x e n e s from t h e 6 sites are s h o w n i n figure 2. A t 5 of t h e 6 localities ( 1 , 3 , 4, 5, a n d 6) t h e d a r k - c o l o r e d l a y e r contains a h i g h e r a m o u n t of h y p e r s t h e n e a n d a l o w e r a m o u n t of h o r n b l e n d e t h a n t h e light-colored l a y e r . After a p p l i c a t i o n of error at t h e 95.4 level of confidence o n l y 1 of 6 values in each set does n o t o v e r l a p , b o t h w i t h i n t h e d a r k - a n d l i g h t - c o l o r e d layers.
V a r i a t i o n of t r a n s p a r e n t m i n e r a l s u i t e s i n t h e l o b e
Bulk samples of t e p h r a collected w i t h i n 3 d a y s after t h e M a y 18 eruption w e r e a n a l y z e d . These samples w e r e p r e p a r e d using m e t h o d s described earlier.
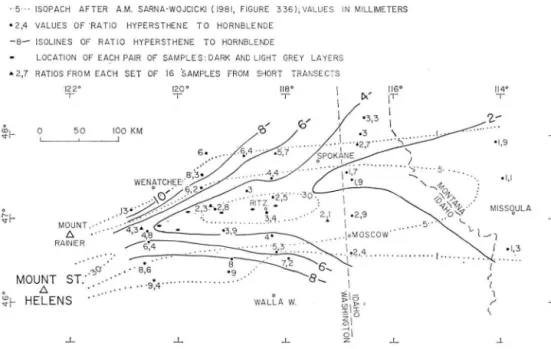
I n figure 1, t h e values of t h e r a t i o h y p e r s t h e n e / h o r n b l e n d e h a v e been p l o t t e d a t t h e
c o r r e s p o n d i n g s a m p l i n g sites. Isolines of this r a t i o h a v e been a d d e d t o suggest t h e m a i n
t r e n d of v a r i a t i o n s . Isopach lines a r e also s h o w n in figure 1 after S A R N A - W O J C I C K I et a l .
( 1 9 8 1 , Fig. 336) t o h e l p position o u r results w i t h i n t h e lobe. T h e r a t i o h y p e r s t h e n e / h o r n
b l e n d e clearly decreases w i t h d i s t a n c e from t h e v o l c a n o as well as f r o m the m a r g i n s of
t h e lobe t o its axis.
EXPLANATION
0 PERCENTAGES RELATING TO THE LIGHT GREY LAYER
» PERCENTAGES R E L A T I N G TO THE DARK L A Y E R
1 ERROR IN PERCENT AT T H E 9 5 , 4 L E V E L OF CONFIDENCE
0
1 1 1 1 1 1
0 5 0 100 150 2 0 0 2 5 0 KM D I S T A N C E F R O M M O U N T ST. H E L E N S
Fig. 1: Percentages of hypersthene and hornblende to all transparent heavy minerals from the dark and the light-grey layers from 6 localities along the axis of the lobe of the May 18 eruption
of Mount St. Helens. Localities are shown in fig. 2.
L o o k i n g a t t h e separate percentages, 9 . 5 % t o 1 7 % h o r n b l e n d e a n d 8 1 . 5 % t o 8 9 % h y p e r s t h e n e a r e present in t h e t r a n s e c t closest t o source ( a b o u t 130 k m from t h e v o l c a n o ) a n d 3 4 % t o 45 % h o r n b l e n d e a n d 5 1 % t o 6 2 . 5 % h y p e r s t h e n e occur in t h e f a r distal t r a n s e c t ( a b o u t 600 k m from t h e v o l c a n o ) . A similar t r e n d can b e recognized in figure 2 w i t h respect t o t h e percentages f r o m t h e 1 2 samples of b o t h t h e d a r k a n d light layers.
O u r o b s e r v a t i o n s indicate s o r t i n g of t h e t r a n s p a r e n t h e a v y m i n e r a l s in t h e p l u m e . S o r t i n g a l o n g t h e lobe axis m a y b e e x p l a i n e d b y a difference in specific g r a v i t y which is l o w e r for h o r n b l e n d e (3 t o 3.3) t h a n for h y p e r s t h e n e (3.3 t o 3.5). Differences in g r a i n s h a p e m a y also influence p a r t i c l e t r a n s p o r t , t h e flatter, t a b u l a r h o r n b l e n d e t r a v e l l i n g f a r t h e r t h a n t h e prismatic h y p e r s t h e n e .
W e a t t r i b u t e t h e s y m m e t r i c a l v a r i a t i o n of t h e h y p e r s t h e n e / h o r n b l e n d e r a t i o s a b o u t t h e lobe axis t o changes in t h e p r o p o r t i o n of l i g h t - c o l o r e d ash t o d a r k t h r o u g h o u t t h e lobe.
T h e thickness of t h e lobe is c o n t r o l l e d l a r g e l y b y v a r i a t i o n in t h e thickness of t h e light-
colored ( l i g h t - g r e y plus t a n ) l a y e r ( S A R N A - W O J C I C K I et al. 1 9 8 1 , Fig. 339). T h e d a r k -
1 9 8 1 , Fig. 3 4 0 ; D . D Z U R I S I N , w r i t t e n c o m m u n . , 1 9 8 0 ; S . SHIPLEY, u n p u b . d a t a ) . C o m p o nents of b o t h d a r k - a n d l i g h t - c o l o r e d layers w e r e p r o b a b l y d e p o s i t e d as a mixed l a y e r a t t h e lobe m a r g i n s . T h e higher p e r c e n t of h o r n b l e n d e r e l a t i v e t o h y p e r s t e n e in t h e l i g h t - colored l a y e r c o r r e s p o n d s well w i t h t h e isopach m a p .
A c o m p a r i s o n of o u r results w i t h those of K U N T Z et al. ( 1 9 8 1 ) t o look for a t r e n d from o u r w e s t e r n m o s t transect t o t h e source v e n t is n o t possible because t h e technical m e t h o d s w e r e n o t t h e same ( J U V I G N E 1 9 8 3 ) a n d t h e t u r b u l e n c e w i t h i n t h e p l u m e in t h e vicinity of t h e v o l c a n o w a s q u i t e different t h a n t h a t d o w n w i n d .
EXPLANATION
" 5 - - I S O P A C H A F T E R A . M . S A R N A - W O J C I C K I 1 1 9 8 1 , F I G U R E 3 3 6 ) ; V A L U E S I N M I L L I M E T E R S
• 2 , 4 V A L U E S O F R A T I O H Y P E R S T H E N E T O H O R N B L E N D E
- 8 — I S O L I N E S O F R A T I O H Y P E R S T H E N E T O H O R N B L E N D E
L O C A T I O N O F E A C H P A I R O F S A M P L E S : D A R K A N D L I G H T G R E Y L A Y E R S
» 2 , 7 R A T I O S F R O M E A C H S E T O F 1 6 S A M P L E S F R O M S H O R T T R A N S E C T S
Fig. 2: Variation of ratio hypersthene/hornblende in the lobe of the May 18 eruption of Mount St. Helens.
V a r i a t i o n of t h e h e a v y m i n e r a l s u i t e s a l o n g s h o r t t r a n s e c t s
This i n v e s t i g a t i o n is of p a r t i c u l a r i m p o r t a n c e t o c u r r e n t E u r o p e a n t e p h r o s t r a t i g r a p h i c research. A t t e m p t s t o c o r r e l a t e t h i n , distal t e p h r a l a y e r s w i t h i n small areas (for e x a m p l e , J U V I G N E 1 9 8 3 ) h a v e been h i n d e r e d b y high v a r i a b i l i t y a m o n g h e a v y m i n e r a l suites.
T h r e e sets of 1 6 b u l k samples w e r e collected i n S e p t e m b e r , 1 9 8 2 t o determine l o c a l v a r i a t i o n w i t h i n t h e h e a v y m i n e r a l suites. Each set w a s collected a l o n g transects a b o u t 1.5 k m l o n g ; s a m p l e s w e r e t a k e n a b o u t 1 0 0 m a p a r t . Set 1 w a s collected a p p r o x i m a t e l y 6 0 k m south of W e n a t c h e e ; set 2 , a b o u t 7 5 k m west of R i t z v i l l e ; a n d set 3 , a b o u t 1 0 0 k m southwest of S p o k a n e (Fig. 2 ) . T h e p r e p a r a t i o n technique described earlier was a p p l i e d t o all samples.
T h e greatest d e v i a t i o n s a r e 1 1 % for h y p e r t h e n e a n d 1 0 % for h o r n b l e n d e , b o t h in
set 3 (Fig. 3 ) . After a p p l i c a t i o n of s t a n d a r d e r r o r a t t h e 9 5 . 4 level of confidence t h e
1 6 values o v e r l a p in each set b o t h for h y p e r s t h e n e a n d h o r n b l e n d e .
SET SET 2 SET 3
X
CL
>- X
o
X
100 2 0 0 3 0 0 4 0 0 KM
DISTANCE FROM MOUNT ST. HELENS
Fig. 3 : Percentages of hypersthene and hornblende to all transparent heavy minerals for 3 sets of 16 bulk samples collected along short transects. D a t a points represent minimum and maximum values at each site; remaining values lie along the dashed lines. Vertical bars represent probable
error at 95.4 confidence level.
I n spite of t h e v a r i a t i o n s a l o n g each s h o r t t r a n s e c t , the m e a n values for each set of 16 samples a r e consistent w i t h t h e general t r e n d of v a r i a t i o n of h e a v y m i n e r a l suites dis
cussed e a r l i e r ; mean values a r e p l o t t e d in figure 1.
V a r i a t i o n of t h e a m o u n t o f h e a v y m i n e r a l s i n t h e l o b e
T h e a b u n d a n c e of h e a v y minerals is h i g h l y v a r i a b l e t h r o u g h o u t t h e lobe. H e n c e q u a n t i t a t i v e analyses w e r e m a d e t o d e t e r m i n e t h e exact a m o u n t of h e a v y m i n e r a l s ( t r a n s p a r e n t plus o p a q u e ) present.
M e t h o d 1. D r y b u l k s a m p l e in o v e n .
2. W e i g h 100 m g from each s a m p l e .
3. S h a k e s a m p l e in 100 m l purified b r o m o f o r m using centrifuge t u b e . T h e d e n s i t y of b r o m o f o r m w a s checked t o be 2.89 w h e n u s e d .
4. C e n t r i f u g e 5 minutes a t 4 0 0 0 r p m .
5. Freeze t h e b o t t o m of t h e centrifuge t u b e i n n i t r o g e n . 6. S h a k e t h e tube.
7. R e p e a t steps 4, 5, a n d 6.
9. R e m o v e t h e floating light f r a c t i o n a n d rinse t u b e w i t h acetone.
10. W a r m f r o z e n b r o m o f o r m , p o u r o n t o p a p e r filter a n d rinse w i t h acetone.
1 1 . Weigh h e a v y minerals w i t h a b a l a n c e precise t o 1 0
— 5g.
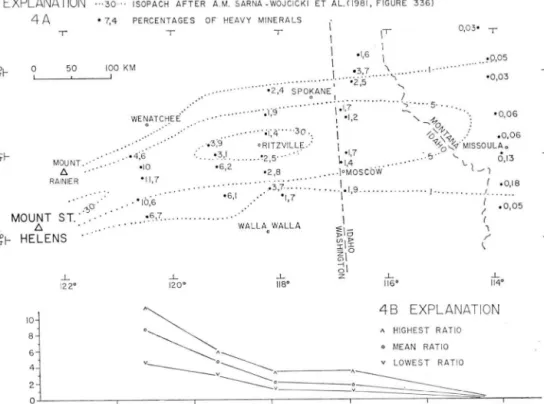
R e s u l t s
T h e results a r e p l o t t e d as percentages in figure 4a. I n figure 4b t h e lowest, t h e m e a n , a n d t h e highest percentages of each transect a r e r e p r e s e n t e d w i t h respect t o distance f r o m t h e volcano in o r d e r t o sketch t h e t r e n d of t h e v a r i a t i o n s . T h e r e is a clear decrease in t h e a m o u n t of h e a v y m i n e r a l s d o w n w i n d in t h e lobe. T h e a m o u n t in t h e Missoula t r a n s e c t is m o r e t h a n 100 times lower t h a n t h a t in t h e w e s t e r n m o s t transect.
V a r i a t i o n a m o n g t h e values a l o n g each t r a n s e c t is n o t as g r e a t ; t h e ratios between t h e highest a n d l o w e s t values v a r y f r o m a b o u t 2 ( t r a n s e c t 75 k m west of Ritzville) t o 6 ( M i s soula transect). M o r e o v e r , t h e highest a m o u n t of h e a v y minerals is n e v e r at the m a r g i n of t h e lobe b u t does n o t c o r r e s p o n d w i t h the lobe axis.
C o n c l u s i o n s
Sorting of h e a v y minerals w i t h i n t h e p l u m e of t h e M a y 18 e r u p t i o n of M o u n t S t . H e l e n s has been s h o w n t o be b a s e d on their specific g r a v i t y a n d g r a i n shape. T h e a m o u n t
EXPLANATION • • • 3 0 • • • I S O P A C H A F T E R A . M . S A R N A - W O J C I C K I E T A L . C 1 9 8 1 , F I G U R E 3 3 6 )
4 A • 7 , 4 PERCENTAGES O F HEAVY MINERALS
1
• 2 , 4 S P O K A N E
• 3 , 7
P• 2 . 5
. 0 , 0 5
• 0 , 0 3
MOUNT.- A
RA NIE R
MOUNT ST.
£ h HELENS
WENATCHEE
• 4 , 6
• 1 0
'.l,"9
" 10,6
• 6 , 7
• . 3 . 9
• 3 , 1 .
• 6 , 2
• • ; i ; 4 3 0 . .
• RITZVILLE.-'
• 2 , 5 - " '
2 , 8 . . . . | ° M 0 S C 0 W
1 , „
, 3 , 7 .1 _ . • • ' - 1 , 7
WALLA WALLA
I ' I S | - !
> l o
• 0 , 0 6
- \ ;
••' . 0 , 0 6
M I S S O U L A ,
V