With 11 text-figures Printed in Great Britain
THE INITIATION AND CONDUCTION OF ACTION
POTENTIALS IN THE OPTIC NERVE OF TRITONIA
BY RONALD CHASE
Department of Biology, McGUl University, P.O. Box 6070, Montreal 101, Quebec, Canada
{Received 11 October 1973)
As noted in the preceding article (Chase, 1974), an optic nerve origin for photo-receptor spikes in the mollusc Tritonia diomedia is indicated by the small size and frequent absence of somatic action potentials. Axonal trigger sites are the rule for in-vertebrate ganglion cells (Tauc, 1962) and most peripheral sensory neurones (Edwards & Ottoson, 1958), but there are exceptions (Mellon & Kennedy, 1964) and the issue has not been well investigated in molluscan sensory neurones. Recently Alkon & Fuortes (1972) found evidence for axonal spike initiation in photoreceptors of the nudibranch Hermissenda. In Tritonia, also a nudibranch, the receptor fibres are several millimetres longer than in Hermissenda, and the optic nerve itself, apparently composed exclusively of these fibres, measures about 2*0 mm. These experiments take advantage of the long optic nerve in Tritonia to examine in detail the origin of photoreceptor spikes.
For a first-order sensory neurone the presence of a spike trigger point in the axon necessarily implies electrotonic conduction of the receptor generator potential into the axon. Decremental conduction of graded potentials has recently been reported for the optic nerves of several invertebrate species including gastropod molluscs (Gillary, 1970; Patton & Kater, 1972). In some of these cases information transfer appears to be by means of the graded potential alone since spikes are neither generated nor con-ducted in the nerves. A striking example of this is found in the barnacle lateral eye, where decremental conduction of the visual signal over a distance of 1 cm has been elegantly described by Shaw (1972). Given that information can be effectively trans-mitted by either active or passive mechanisms alone, why would spike conduction co-exist with substantial electrotonic conduction, as in Tritonia ? It is argued that the
Tritonia optic nerve represents a transitional state between two modes of nervous
communication.
The procedures and apparatus were essentially the same as those described in the preceding article, which should be referred to for details not given here. Intracellular potentials were recorded with glass micropipettes filled with a 3-0 M-KC1 solution and amplified through conventional high-impedance circuitry. For extracellular recording from the optic nerve, close-fitting polyethylene suction electrodes were employed, usually recording en passant from the intact nerve. Extracellular signals were amplified by a Grass P-16 DC preamplifier. All data were monitored on an oscilloscope and recorded either photographically or by the use of a Brush model 440 chart recorder. Illustrations obtained by the latter method sometimes display spikes that are attenu-ated due to the limited frequency response of the recorder, which falls off above 40 Hz at full-scale deflexion; this is of no consequence for the purposes of the study. Visual stimulation consisted of diffuse white light controlled by a shutter and neutral density filters. When electrical stimulation was employed, 0-5 msec biphasic pulses were delivered through suction electrodes of the same type as used for recording.
RESULTS
Optic nerve responses to illumination
In all instances when the optic nerve electrode recorded action potentials in response to light, and in some cases when there were not action potentials, light initiated a DC shift at the electrode. Spikes, when present, were superimposed on the DC wave as illustrated in Fig. 1, and often continued after the DC potential had disappeared. The polarity of the DC potential change was always positive with respect to a reference electrode placed in the sea-water bath distant from the optic nerve. The DC response showed light-adaptation and dark-adaptation which corresponded, in relative magni-tude and time course, with that observed for intrasomatic receptor responses and optic nerve spikes. For a given stimulus, the amplitude of the DC response depended in part on variable features of the nerve-electrode connexion, but amplitudes were consistently smaller the more distant was the electrode from the eye. Moreover, DC responses to light were not recorded in the cerebral nerve branch with which the optic nerve joins approximately 2-0 mm from the eye. The largest recorded response measured 150 /tV. When intracellular receptor records were obtained simultaneously with the optic nerve activity, DC responses on the two channels were usually con-temporaneous, although small amplitudes and slow onsets prohibited precise measure-ments of relative latencies.
723
Fig. 1. DC response of optic nerve to illumination. Bottom trace is photocell monitor of stimulus
timing. Intensity was r i o m W / c m1. In this and all other figures extracellular negativity is
upward. Spikes retouched. Calibration is 50 /*V, 1 sec.
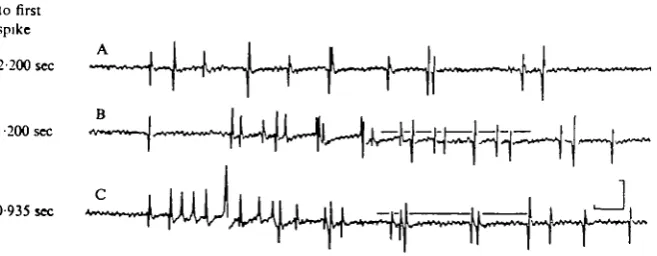
Latency
to first spike
2-200 sec
I-200 sec
0 935 sec
T - > ~ w s J ^ ^ L w ^ v V ^ - i . ^. •• • ••>»i U»-wA.. k.v».JLw»v.M y . . Y J I ^ J ^
[image:3.451.93.352.76.240.2]^~44UlJ
f\A**L*M-yJu-*V-i**J>-'Fig. 2. Optic nerve responses to illumination at different intensities. Stimuli were 1 sec long and terminated prior to the illustrated segment. Horizontal line in B and C indicates level of baseline at the left of the figure, before the response. Suction electrode was placed approximately 700/tm
from the eye. Stimulus intensity in A was 5-60 /iW/cm1; intensity was increased in log unit
steps in B and C. Calibration is 150 ftV, 100 msec.
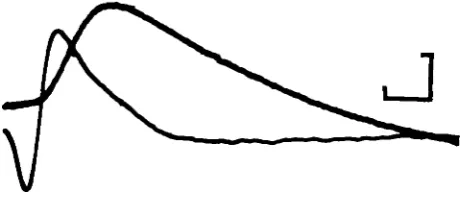
Changes in extracellular spike waveform
[image:3.451.50.379.305.433.2]Fig. 3. Progressive change in spike waveform* during optic nerve response to light. Stimulus
intensity was 0-56 mW/cm1; timing indicated by horizontal line. Electrode was placed
approxi-mately 500 fim from the eye. Calibration is 75 fiV, 500 msec.
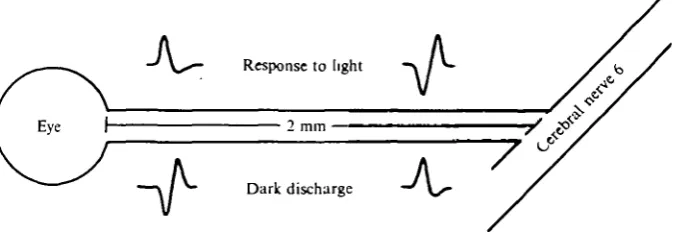
Response to light
[image:4.451.59.397.214.332.2]Dark discharge
Fig. 4. Schematic diagram of optic nerve showing types of extracellular waveforms recorded at two positions on the nerve during light and darkness. Spikes originate in the stippled portion of the nerve (called 'distal') in the dark; spikes originate near the eye during a response to light.
of the spikes are monophasic, negative. At the highest stimulus intensity (Fig. 2 C) most of the spikes in the initial part of the response are monophasic, negative. A similar recording situation is illustrated in Fig. 3 where it can be seen that the positive component sometimes increases progressively following a string of completely negative spikes at the beginning of a response. Note in this figure that the transition from monophasic to biphasic is not accompanied by discontinuities in the train of spikes, and it occurs at a time during which the DC potential is maintained at its greatest excursion from the baseline. Figs. 2 and 3 show results which are typical for electrode placements one half the distance, or less, from the eye to the junction of the optic nerve and the sixth cerebral nerve. If the electrode was placed farther from the eye (1-2 mm or more) spontaneous spikes were initially negative, either biphasic or monophasic. When recording from these sites distant from the eye bright illumination produced biphasic spikes that were strongly positive initially (Fig. 6).
With reference to the diagram of Fig. 4, the above results can be summarized by stating that proximal* electrode placements yielded initially positive spikes that became initially negative under illumination, and distal placements showed comple-mentary waveforms, i.e. initially negative spontaneous spikes that became initially positive under illumination. A spike that approaches and then moves past an extra-cellular electrode should appear positive-negative-positive, as the region of nerve under the electrode acts successively as a current source-sink-source. If an action
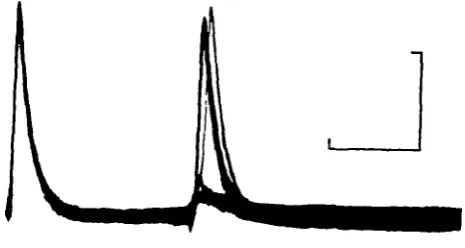
Fig. 5. Timing of a unitary action potential recorded simultaneously in a receptor soma and in the optic nerve. Upper trace, intracellular soma record; bottom trace extracellular optic nerve record. Recorded in the dark. Calibration is 2 mV (soma), 100 /iV (Op N), 5 msec.
potential originates under the recording electrode, the initial positivity will be lost since the fibre at the recording site now acts only as sink, then source. Therefore the experimental observations suggest that, in the dark, optic nerve spikes are generated in the distal half of the nerve, but when the fibres are depolarized by a decrementally conducted generator potential in response to light, membrane regions of higher threshold close to the eye now initiate spike activity. This hypothesis is supported by experiments described below.
Optic nerve origin of photoreceptor spikes
Tritonia conforms to the general rule among gastropods (refs. in Patton & Kater,
1972) in that the axons of the primary visual receptors leave the eye via the optic nerve (Chase, 1974). Action potentials do not actively invade the soma, but appear to be decrementally conducted into the soma from a distal region at which they are blocked (Chase, 1974). An optic nerve origin for these spikes is suggested by results from experiments in which the activity of single receptor cells was monitored simul-taneously in the soma and the optic nerve. In all such cases, as for example in Fig. 5, the optic nerve spike preceded the soma spike, thus indicating a spike trigger closer to the optic nerve electrode than to the soma electrode.
With distal placements of the optic nerve electrode, there was a substantial increase in the interval between the nerve spikes and the soma spikes after a visual response when the nerve spike switched from initially positive to initially negative (Fig. 6). This result would be expected if, during the response, the region of spike initiation moved proximally, away from the nerve electrode and toward the soma electrode, and then after the response returned to a distal site. In the illustrated example, the interval difference after the response amounted to 25 msec, indicating a spike origin near the nerve electrode, whereas the absence of any significant delay at the time of maximal excitation means that the spikes were then initiated at a point approximately equi-distant between the two electrodes (assuming uniform conduction velocities along the nerve), or about 650 /an from the eye.
When time-locked spikes were seen in simultaneous recordings from the optic nerve and the sixth cerebral nerve, the cerebral nerve spike sometimes preceded the optic nerve spike during dark-discharge. Again, these results imply spike initiation in distal segments of the optic nerve during darkness. Such units were not efferent because
J
16 16 25
Fig. 6. Interval changes between a unitary soma and nerve spike recorded simultaneously during a response to light. Stimulus onset was to the left of the illustration; offset is indicated by the arrow; intensity was 0-28 mW/cm1. Numbers give the delay in msec between the negative peak of the nerve spike and the peak of the soma spike. Optic nerve electrode placed approxi-mately 1300 fun from the eye. Calibration is 40 mV (soma), 200 /tV (Op N), 100 msec.
f M
L
—Kf-Fig. 7. Elicitation of an initially positive antidromic spike when orthodromic spikes are pre-dominantly negative. Upper trace is optic nerve record from electrode placed approximately 500 fim from the eye. Lower trace shows artifacts of shocks delivered through a cerebral nerve electrode. Illumination was continuous following onset at arrow. Calibration is 200/iV, 100 msec.
they survived section of the cerebral nerve close to the ganglion. The interval between spikes of an identifiable pair was usually slightly variable, indicating a non-discrete trigger zone, and cerebral nerve leading always disappeared during a response to light, indicating movement of the effective trigger zone closer to the eye.
Assuming that when a suction electrode records monophasic negative spikes they are initiated at or near the electrode site, then if antidromic spikes are triggered distant from the electrode these spikes should be distinguished by an initially positive com-ponent. An experimental test of this prediction is illustrated in Fig. 7. The recording electrode was placed approximately 500/tm from the eye. Spikes evoked by light were predominantly negative, with an initial positive component increasing in size as the response waned. A second suction electrode was placed on the sixth cerebral nerve for the purpose of stimulation. Stimulating voltage was adjusted so that the optic nerve electrode recorded single antidromic spikes following brief current pulses. The figure clearly shows that these antidromic spikes were biphasic, initially positive, at the same time that the orthodromic light-evoked spikes were mostly monophasic, negative. The experiment confirms that spikes elicited in response to light are initiated in the proximal half of the optic nerve.
Lability of spike conduction
of 1 h, 25 optic nerves evidenced no spikes whatsoever; 16 nerves gave both active responses to light and showed a dark-discharge; and in the remaining 17 experiments spikes were present either in the dark or following illumination but absent in the other condition. Individual units could usually be easily distinguished, and they seldom numbered more than two or three per nerve, while five was the maximum encountered. Since histological examination of the eye indicates the presence of five photoreceptors (Chase, 1974), and the optic nerve axons are the processes of these cells, the low number of fibres active in even the responsive optic nerves further suggests failure of spike initiation and/or conduction. As discussed in the preceding article, synaptic inhibition is probably not a significant factor in this regard.
In some experiments one or more spikes were recorded at a proximal location on the optic nerve but could not be detected at more distal sites, nor was antidromic stimulation at the distal location effective. Conduction block of this sort occurred in 9 of 15 experiments with double placement of electrodes. The junction of the optic nerve with the cerebral nerve trunk is not a critical point because failure of conduction was noted even within the length of the optic nerve itself.
The failure to observe spikes may be due to a variety of causes, and it has not been possible to positively identify the reason in each case. However, it is unlikely that spikes yielding small extracellular voltages were lost in noise since the detected spikes were always at least several times the amplitude of the noise. Some of the animals may have been unhealthy or damaged in preparation, but spikes were absent even in experiments that held the most promise on the basis of apparent morphological con-dition. Damage to the eye can be eliminated as a source of optic nerve silence because in several silent preparations depolarizing generator potentials were recorded from photoreceptors, and in addition the light-dependent DC response could be recorded from otherwise silent optic nerves. Spike conduction can be affected by excessive stretch of nerves; however, stretch has not been observed to block conduction in other
Tritonia nerves using the same dissection and recording techniques, and in these
experiments optic nerve activity was not correlated with the amount of stretch which was observed during the procedures. It can be concluded, therefore, that the failure to record spikes in the optic nerve was due to intrinsic properties of the nerve.
Effects of exposure to light on the activity of optic nerve fibres
It has already been noted (cf. Text-fig. 9 in the preceding article) that the optic nerve's 'spontaneous' discharge was typically suppressed following the offset of illumination and the termination of light-evoked activity. The duration of the suppression was correlated with the intensity and duration of the illumination so that, for example, when intense lights were used during the dissection the initial appearance of the dark-discharge was sometimes delayed for up to 1 h after placing the preparation in total darkness. If the greater part of the dissection was accomplished under red lighting, dark-discharge often commenced within 5 min. Similarly, animals that were main-tained prior to the experiment under conditions of dim lighting (73 x io~2/iW/cm2, alternating with equal 12 h periods of darkness) seemed to yield more readily active optic nerves than animals that were kept in more brightly lit rooms (up to 0102 mW/ cm2). The totally silent preparations also seemed to occur more frequently with those animals that had been exposed to the greatest amount of light while in the author's
Fig. 8. Progressive decline in spike amplitudes during maintained illumination. Onset of a bright light is indicated by the arrow. Calibration is 200 ftV, 400 msec.
laboratory, but none of these correlations are perfect since silent nerves were found in animals maintained and dissected under the dimmest lighting, and conversely pre-parations were sometimes very active despite little or no precaution regarding previous light exposure.
The adverse effects of light on spiking activity was also evident in certain atypical responses that were recorded. Bright sustained illumination usually caused a tonic increase in the frequency of optic nerve discharge for the duration of the stimulus (Text-fig. 9, preceding article). Discharge was greatest at the onset of light, corre-sponding in time to the large depolarization transient observed in receptor somata. With especially sensitive preparations, however, or when exceptionally strong stimuli were employed, the optic nerve response was phasic in that spike discharge was not sustained beyond the initial burst. Fig. 8 shows a slightly different case in which spike amplitude declined steadily during a sustained response to a maintained stimulus. Behaviour of this sort can be explained in terms of the light-dependent depolariza-tion which is passively carried into the optic nerve and which, through accommodadepolariza-tion and/or cathodal block, could limit active responses of the nerve. Similar effects were seen when a portion of the nerve was depolarized by extrinsic currents. Depolariza-tion maintained by ambient lighting over a period of hours or days may have more enduring effects and might account for the preparations from which action potentials were never recorded. Since some nerves continued to be totally silent even after more than 12 h of dark-adaptation, presumably the effects sometimes exceed the limits of recovery.
Optic nerve excitability
729
[image:9.451.109.342.316.440.2]D
Fig. 9. Recovery of the optic nerve compound action potential in a double-shock experiment. Stimulus was a o-s msec biphasic pulse at twice the minimal voltage for the full compound response. Interstimulus intervals from A to D are 50, 30, 20 and 17 msec. Calibration is 2 mV,
Fig. 10. Recovery of a receptor soma spike in a double-shock experiment. 10 superimposed traces. Pairs of shocks were delivered to the optic nerve at an interstimulus interval of 190 msec. Stimulus was a o-1 msec biphasic pulse which was just-suprathreshold. There was no response to the second stimulus in about half of the trials; response failure is marked by a small electro-tonic potential (see text). Calibration is 4 raV, 100 msec.
9
j£ 8
c
3
z
- • 4 Hz
8 Hz 16 Hz
j _ I j
8 Hz
16 Hz
1 2 3 4 5 Blocks of 10 stimuli
Fig. 11. Frequency limitation of spike conduction in a single optic nerve fibre. Action potentials were recorded in a receptor soma. Series of 50 shocks (o-i msec, biphasic) were delivered to the optic nerve. The nerve was rested between each series until spontaneous activity was renewed (5-10 min.) (A) Stimulus just-suprathreshold. (B) Stimulus 166 % of threshold voltage.
by a small depolarizing potential that was not interpreted as an active response for the following reasons: (1) it persisted at stimulation frequencies as high as 200 Hz; (2) amplitude was linearly related to stimulus voltage over a wide range; and (3) amplitude was not affected by soma membrane potential. Thus the slow potential is an artifact created by the passive conduction of the stimulus depolarization into the soma. It is masked by the spike when the spike occurs. Response failure in this experiment could have been due either to failure of initiation or to conduction block between the stimulation site and the soma. However, failure cannot be attributed to a unique site of low safety in or proximal to the eye, since comparable refractoriness has been observed at several positions along the distal optic nerve when threshold voltages were used.
As might be expected from the long refractoriness, the ability of the optic nerve to support repetitively elicited action potentials is severely frequency-limited, especially with weak stimuli. Fig. 11 shows results from a typical experiment in which the responsiveness of a single optic nerve fibre was tested at several frequencies of electrical stimulation. With stimulus voltage just suprathreshold (Fig. 11 A) following was in-complete at 2 Hz, and fell to a 50% response rate at 4 Hz. At most frequencies re-sponsiveness generally declined as the number of stimuli increased, thereby indicating cumulative effects of refractoriness, or fatigue. Again, similar results were obtained for multiple unit responses recorded from distal segments of the optic nerve.
DISCUSSION
with a cerebral ganglion nerve trunk (2-0 mm) and that action potentials are initiated in the axons of the receptors along this length of nerve. These conclusions are similar to those reported earlier for another nudibranch, Hermissenda crassicomis, in which the total length of the optic nerve is only about 100/rai (Alkon & Fuortes, 1972).
In addition to the nudibranchs Tritonia and Hermissenda, DC shifts in response to light have been reported in the optic nerves of several invertebrate groups including the barnacle Balarms eburneus (Shaw, 1972), the fly Calliphora erythrocephala (Zettler & Jarvilehto, 1971) and the gastropods Helix aspersa (Gillary, 1970), Helisoma trivolvis and Planorbis corneus (Patton & Kater, 1972). Recordings from the optic nerves of
Planorbis, Balanus and Calliphora are distinguished by a complete absence of
re-generative spike activity, indicating information transfer to higher-order neurones by graded potentials alone, whereas most molluscan optic nerves conduct action potentials. In the nerves which do not conduct spikes, as well as in Hermissenda and Helisoma which do, the DC potential has been recorded at or close to the optic nerve terminals. It has been suggested for Helisoma that the presence of both a graded potential and spike activity at the terminals may indicate information transfer by both signals (Patton & Kater, 1972). However, in the present study DC shifts were not detected in the Tritonia optic nerve at locations more than 2 0 mm from the eye; and in Hermissenda, although the generator potential is carried to the axon terminals, post-synaptic cells respond to optic nerve spikes and not to graded potentials (Alkon, 1973). Thus, these studies do not support the hypothesis of dual transmission in Helisoma, but rather suggest that whenever spikes are present in the optic nerve (regardless of the site of initiation) they are the sole means of information transfer. Nevertheless, the prevalence of graded potentials in the optic nerves of many invertebrate groups probably signifies retention of the more primitive and more general means of nervous communication (Bishop, 1956), and optic nerves of some of the species discussed above may represent cases of transition to active conduction where there exist func-tional reasons for the change. If so, the optic nerve of Tritonia should be included as such an example, particularly in view of the marginality of spike conduction in this nerve.
favours spike initiation in this region when the eye is illuminated.
Several characteristics of optic nerve behaviour indicate that the nerve accommo-dates readily: (i) dark discharge is silenced following strong illumination (Text-fig. 9 in preceding paper); (2) under some conditions, particularly with very intense illumina-tion, responses are phasic; (3) spike amplitudes sometimes decline during the course of the response to a sustained light stimulus (Fig. 8); and (4) spike initiation gradually moves away from the zone of greatest depolarization during a light response (Figs. 2, 3, 6). Although the procedures used in these experiments were designed to maximize dark-adaptation, the animals, from the time of capture to the time of recording, were unavoidably exposed to illumination many times more intense than that available in their natural environment. Tritonia is found at depths ranging from 20 to 120 m, and at 100 m from the ocean surface the illumination is approximately io-^/AV/cm2, compared to typical room illumination of about o-i mW/cm2 (Clarke & Denton, 1962). Considering the sensitivity of the Tritonia eye, the ability of the receptors to maintain steady levels of depolarization (Chase, 1974), and the degree of accommodation observed during the experiments, it might be expected that the effects of prolonged light exposure on optic nerve function would be severe and long-lasting. Indeed, it was found that the activity level of optic nerves did correlate with the animal's exposure to light while maintained in the laboratory prior to the experiment. And since physical damage to the dissected nerves was unlikely, it may therefore be assumed that not only was the proximal nerve accommodated in all of the preparations to the extent that discharge in the dark originated only in distal segments, but probably the completely silent preparations can also be accounted for by apparently irreversible effects of sustained depolarization. Either specimens must vary with respect to susceptibility in this regard or factors other than light exposure are also involved, because on several occasions highly active recordings were obtained from animals that had been subject to normal room lighting for weeks prior to the experiment.
and although membrane properties were not directly determined for the Tritonia optic nerve, large time and space constants might be expected because of the nerve's demonstrated capacity for passive conduction.
The marginality of spike conduction in the Tritonia optic nerve suggests that it is transitional between nerves which transfer information by graded potentials and those which use action potentials. As it may therefore be representative of a class of nerves with special interest for the evolution of active conduction, it would be valuable to have comparative data on accommodation and excitability in other nerves which also combine substantial electrotonic conduction with propagation of action potentials.
SUMMARY
1. The optic nerve of Tritonia contains axons of the five primary sensory cells. It joins a cerebral nerve about 2-0 mm from the eye and then travels another 2-5 mm to
the central ganglia.
2. Large DC responses of positive polarity were recorded with suction electrodes in the presence of light. These graded responses are generator potentials passively conducted from a site of origin in or near the receptor somata. DC responses to light were not recorded at points central to the junction of the optic nerve with the cerebral nerve.
3. The shape of extracellular spike waveforms and the temporal relationship be-tween soma and nerve spikes support the conclusion that action potentials are initiated in the optic nerve. In the.dark, spikes originate in portions of the nerve distant from the eye. When the eye is illuminated, the trigger zone shifts about 700 fim more proximal to the eye.
4. The shift in the spike trigger zone during illumination probably reflects an habitual accommodation of proximal portions of the nerve under the conditions of these experiments, and the prevalence of partially or completely silent optic nerves is probably due to more severe consequences of sustained depolarization. The sensi-tivity of the receptors, in combination with the passive properties of the nerve, makes the nerve susceptible to debilitating effects of maintained illumination.
5. The excitability of optic nerve fibres is extremely low. Absolute refractory periods are 25 msec, and relative refractory periods are as long as several hundred msec. When stimulated with just-suprathreshold voltages the nerve cannot support action potentials at frequencies greater than 1 Hz.
6. The Tritonia optic nerve appears to be transitional between transmission by graded responses and transmission by action potentials.
ALKON, D. L. & FUORTES, M. G. F. (1972). Responses of photoreceptors in Hermittenda. J. gen. Pkysiol. 60, 631-49.
ALKON, D. L. (1973). Neural organization of a molluscan visual system. J. gen. Pkytiol. 61, 444-61. BISHOP, G. H. (1956). Natural history of the nerve impulse. Phytiol Rev. 36, 376-99.
BULLOCK, T. H. & HORRIDCE, G. A. (1965). Structure and Function in the Nervous System of
Inverte-brates. W. H. Freeman and Co.
CHASE, R. (1974) The electrophysiology of photoreceptors in the eye of the nudibranch mollusc,
Tritonia diomedia. J. exp. Biol. 60, 707-19.
CLARKE, G. L. & DENTON, E. J. (1962). Light and animal life. In 77K Sea; Ideas and Observations on
Progress in the Study of the Seas (ed. M. N. Hill) vol. I, pp. 456—68. Interscience Publishers.
EDWAHDS, C. & OTTOSON, D. (1958). The site of impulse initiation in a nerve cell of a crustacean stretch receptor. J. Physiol. 143, 138-48.
GILLARY, H. L. (1970). Electrical responses from the eye of Helix to photic stimulation and simultaneous electrical stimulation of the optic nerve. Vision. Res. 10, 977—91.
HoDCKm, A. & HUXLEY, A. (1952). The dual effect of membrane potential on sodium conductance in the giant axon of Loligo. J. Physiol. 166, 497-506.
MELLON, D. JR. & KENNEDY, D. (1964). Impulse origin and propagation in a bipolar sensory neuron.
J. gen. Pkysiol. 47, 487-99.
PATTON, M. L. & KATER, S. B. (1972). Electrotonic conduction in the optic nerves of planorbid snails.
J. exp. Biol. 56, 695-702.
SHAW, S. R. (1972). Decremental conduction of the visual signal in barnacle lateral eye. J. Physiol. 220,
145-75-STEPHENS, C. L. (1973). Progressive decrements in the activity of Aplysia neurones following repeated intracellular stimulation: Implications for habituation. J. exp. Biol. 58, 411—21.
TAUC, L. (1963). Identification of active membrane areas in the giant neuron of Aplysia. J. gen. Physiol.
45. 1090-115.