Calorimeter fast simulation based on hit libraries in the
LHCb Gauss framework
MatteoRama1,∗and GiacomoVitali2,∗∗on behalf of the LHCb collaboration
1Istituto Nazionale di Fisica Nucleare sezione di Pisa, Italy 2Dipartimento di Fisica, Università di Pisa, Italy
Abstract. In HEP experiments the CPU resources required by Monte Carlo simulations are taking up an ever larger fraction of the total computing power (greater than 75%). At the same time the pace of performance improvements given by technology is slowing down, so the only solution is a more efficient
use of resources. In this context we present the ongoing development of a fast simulation of the LHCb calorimeter based on apointlibrary, which has signif-icant advantages in terms of library size and output accuracy compared to the cell hit library. Preliminary performance studies are presented.
1 Introduction
During Run 2 the simulation of physics events at LHCb has taken about 80% of the distributed computing resources available to the experiment [1]. Nonetheless, for some measurements, the number of events that was possible to simulate has not been sufficient to make the system-atic uncertainty associated to Monte Carlo statistics small compared to the main systemsystem-atic uncertainties [2]. The increase in number of events that will need to be simulated in Run 3 to match the higher luminosity and trigger rate will place an additional burden on the computing resources. To face this situation, it is necessary to develop new ways to significantly increase the speed of the simulation.
A number of fast simulation options are available or under development in LHCb to complement the standard simulation based on Geant4 [3]. They include simulating only par-ticles from signal decays, reducing the detector geometry, re-using many times the simulated particles not originating from the signal decay under study [4] or using a fully parametric simulation of the detector [5]. All these options are integrated in the existing framework de-veloped for the standard simulation and described in Sec. 2. In this document the ongoing development of a faster calorimeter simulation based on hit libraries is presented.
2 The LHCb simulation framework
Two applications, Gauss and Boole, are used to simulate physics events in LHCb. Gauss handles the generation of events and the simulation of particle transport through the detector volume by making use of external generators such as Pythia [6] and the Geant4 toolkit. Boole
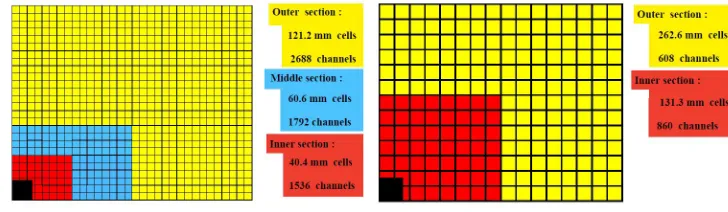
Figure 1.Lateral segmentation (not to scale) of the SPD/PRS and ECAL (left) and the HCAL (right).
One quarter of the detector front face is shown. In the left figure the cell dimensions are given for the ECAL.
emulates the detector response (digitisation). Like all other LHCb applications, both are based on the Gaudi software framework [7]. Since the average CPU time spent in the event generation and digitisation phases is an order of magnitude smaller than the time spent by Geant4 for the particle transport, the effort to make the detector simulation faster must start from the latter.
In a typical minimum bias event about 55% of the CPU time used by Geant4 to simu-late particle transportation is spent in the calorimeter system, followed by the ring imaging Cherenkov detectors with about 25%. Depending on the Gauss and Geant4 versions used, 5% variations of these fractions are possible. Given these numbers, in the effort of developing a faster detector simulation it is natural to start from the calorimeter.
3 The LHCb calorimeter
The LHCb detector [8] is equipped with a scintillator pad detector (SPD), a pre-shower de-tector (PRS), an electromagnetic calorimeter (ECAL) and a hadronic calorimeter (HCAL). The SPD and PRS consist of scintillating pads with a thickness of 15 mm, interspaced with a 2.5X0lead converter. The electromagnetic calorimeter employs a "shashlik" technology of alternating 4 mm thick scintillators tiles and 2 mm thick lead plates arranged perpendicular to the beam pipe. The hadron calorimeter is structured in 4 mm thick scintillator tiles sand-wiched between 16 mm iron sheets arranged parallel to the beam pipe. The four detectors are not longitudinally segmented but adopt a variable lateral segmentation (shown in figure 1) because the hit density varies by two orders of magnitude over the calorimeter surface. A segmentation into three different sections has been chosen for the ECAL and the SPD/PRS, with square cell sizes of approximately 40, 60 and 120 mm in the inner, middle and outer regions, respectively. The HCAL is segmented into an inner and outer region with square cell sizes of approximately 131 and 262 mm, respectively.
4 Development of a calorimeter fast simulation based on hit
libraries
4.1 Nature and energy distribution of particles reaching the calorimeter
To develop the calorimeter fast simulation it is useful to know the properties of the particles from the signal decays of interest and also the approximate nature and energy distribution of
particles belonging to the rest of the event at the calorimeter entrance. The latter has been studied by simulating a large number of minimum bias events [9] with Gauss and recording all particles reaching the SPD front face. On average about 400 particles per event reach the calorimeter. The distribution of the particle species is summarised in table 1: about 70% are photons and 15% are electrons and positrons. The typical energy spectrum is very soft, as it can be seen in table 2 where the fraction of photons below a given energy threshold is shown. For instance, 44% of photons entering the SPD front face have energies below 8 MeV. On the other hand, the energy spectrum of particles from typical decays of interest extends up to about 100 GeV so that the relevant energy range extends over five orders of magnitude.
Table 1.Population at the calorimeter entrance in minimum bias events.
Particle Fraction (%)
γ 69.6
e± 14.9
π± 6.5
n 5.4
p/p¯ 1.9
µ± 0.6
K± 0.4
Table 2.Fraction of photons at the calorimeter entrance with energy below the given value in minimum bias events.
Max energy (MeV) Fraction (%)
10000 99.7 1000 92.9 100 75.9 32 64.3 16 55.2 8 44.1 4 16.0
4.2 The single-hit generator for very low energy particles
Most photons with energy below 40 MeV produce one or zero cell hits in the calorimeter. Therefore, the current idea is to use a simple single-hit generator for particles below a given energy threshold and a more sophisticated generator based on hit libraries for higher energy particles. The single-hit generator takes as input a number of pre-built maps, as a function of the energy and the angle of incidence of the particle on the calorimeter front face, parameter-ising the hit efficiency and the amount of deposited energy in the cell.
4.3 The cell hit library and its limitations
front surface. This constitutes a 6-dimensional cell hit library for each particle type, with the additional complication occurring when a shower is spread over two calorimeter sectors. In this scenario it is not possible to achieve a good performance of the cell hit library output while keeping the library size down to a manageable level.
4.4 The point library
The limitations of the cell hit library outlined in the previous section are solved by adopting a solution that we callpoint library, where collections of almost-point-like energy deposits, as opposed to cell hits, are stored and subsequently translated and rotated according to the incident particle trajectory. The procedure to build the point library is summarised below. • The transverse area of the cells is divided into small subregions, or "points". A library of
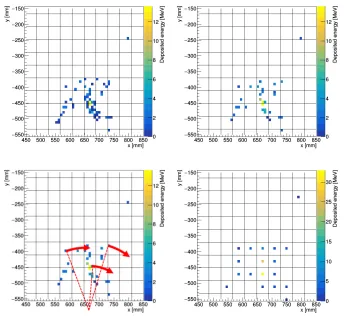
deposited energies in the subregions is built by simulating with Geant4 a number of par-ticles entering the calorimeter with a fixed azimuthal angleφ0(for instance,φ0 =90 deg) and fixed entrance position (x0, y0). Hence, for a given particle species, only the binnings in the particle energy E and incident angleθremain. An example of point collection in
the ECAL produced by an incident photon with energy O(1) GeV is shown in figure 2, top-left plot, where each square of the grid represents the transverse area of an ECAL cell and the colour scale indicates the deposited energy in MeV. In this example the cell has been divided into 25 points.
• Two or more points belonging to the same cell area and with associated energy below a given threshold may be merged locally (energy-weighted barycenter) to simplify the col-lection, i.e. to reduce the number of points stored in the library. This is exemplified in figure 2, top-right plot.
Once the point library is built, it can be used to simulate the cell hit collection of a particle entering the calorimeter using the following procedure.
• Let us consider a particle entering the calorimeter through the point (x, y) with azimuthal
angle φ. A collection of points, among the ones associated to the particle (E,θ) bin, is
randomly selected from the library. Next, the selected points are rotated byφ−φ0 and translated by (x−x0, y−y0). This is a key aspect of the point library: the rotated and translated point collection gives a good description of the shower produced by a rotated and translated incident particle. The rotation of the points is exemplified in figure 2, bottom-left plot.
• Finally, the actual calorimeter hits are created by summing the energies of those trans-formed points which fall into the same cell area. This is shown in figure 2, bottom-right plot, where the colour in the central region of the cell indicates the total deposited energy, in MeV.
This procedure has the additional advantage that a library created from particles entering, for instance, the inner sector of the calorimeter allows to generate cell hits in all sectors, including the inner-middle and middle-outer transition regions. To summarise, for a given particle type, the point library depends only on the energy and angle of incidence of the particle and therefore the number of required parameters is reduced from six to two. The use of a point library, as opposed to a more standard cell hit library, allows to significantly improve the output accuracy for the same size of the library.
4.5 Preliminary performance studies
front surface. This constitutes a 6-dimensional cell hit library for each particle type, with the additional complication occurring when a shower is spread over two calorimeter sectors. In this scenario it is not possible to achieve a good performance of the cell hit library output while keeping the library size down to a manageable level.
4.4 The point library
The limitations of the cell hit library outlined in the previous section are solved by adopting a solution that we callpoint library, where collections of almost-point-like energy deposits, as opposed to cell hits, are stored and subsequently translated and rotated according to the incident particle trajectory. The procedure to build the point library is summarised below. • The transverse area of the cells is divided into small subregions, or "points". A library of
deposited energies in the subregions is built by simulating with Geant4 a number of par-ticles entering the calorimeter with a fixed azimuthal angleφ0(for instance,φ0 =90 deg) and fixed entrance position (x0, y0). Hence, for a given particle species, only the binnings in the particle energyE and incident angleθremain. An example of point collection in
the ECAL produced by an incident photon with energyO(1) GeV is shown in figure 2, top-left plot, where each square of the grid represents the transverse area of an ECAL cell and the colour scale indicates the deposited energy in MeV. In this example the cell has been divided into 25 points.
• Two or more points belonging to the same cell area and with associated energy below a given threshold may be merged locally (energy-weighted barycenter) to simplify the col-lection, i.e. to reduce the number of points stored in the library. This is exemplified in figure 2, top-right plot.
Once the point library is built, it can be used to simulate the cell hit collection of a particle entering the calorimeter using the following procedure.
• Let us consider a particle entering the calorimeter through the point (x, y) with azimuthal
angleφ. A collection of points, among the ones associated to the particle (E,θ) bin, is
randomly selected from the library. Next, the selected points are rotated byφ−φ0 and translated by (x−x0, y−y0). This is a key aspect of the point library: the rotated and translated point collection gives a good description of the shower produced by a rotated and translated incident particle. The rotation of the points is exemplified in figure 2, bottom-left plot.
• Finally, the actual calorimeter hits are created by summing the energies of those trans-formed points which fall into the same cell area. This is shown in figure 2, bottom-right plot, where the colour in the central region of the cell indicates the total deposited energy, in MeV.
This procedure has the additional advantage that a library created from particles entering, for instance, the inner sector of the calorimeter allows to generate cell hits in all sectors, including the inner-middle and middle-outer transition regions. To summarise, for a given particle type, the point library depends only on the energy and angle of incidence of the particle and therefore the number of required parameters is reduced from six to two. The use of a point library, as opposed to a more standard cell hit library, allows to significantly improve the output accuracy for the same size of the library.
4.5 Preliminary performance studies
The accuracy of the calorimeter simulation based on point libraries has been tested through the comparison with detailed simulation using photons generated at the calorimeter entrance
Figure 2.Schematic illustration of the point library operating principle. Each square of the grid repre-sents the transverse area of an ECAL cell and the colour scale indicates the deposited energy in MeV by an incident 1 GeV photon. More details are given in section 4.4.
with various energies and angles of incidence. Three variables relevant for the comparison are the coordinates of the hit cluster centrexclus,yclusand the energy ratioEmeas/Etot, defined
as
xclus =
iEixi
iEi , yclus=
iEiyi
iEi ,
Emeas
Etot =
i
Ei/Eγ, (1)
wherexi,yiare thex,ypositions of theithcell centre,Eiis the deposited energy andEγis the
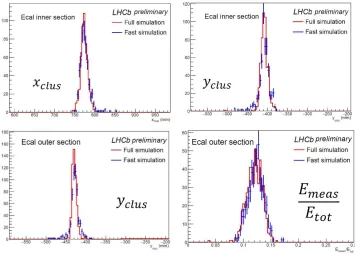
total energy of the incident particle. In the comparisons shown in figure 3 the fully simulated photons are generated withEγ =2.75 GeV,θ=0.26 rad andφ=45 deg. The point library
is created from photons entering the calorimeter inner region with the same value of energy andθbut a different value ofφ(90 deg) to test the mechanism of the point azimuthal rotation. The top plots compare thexclusandyclusdistributions in the case where the entrance point of
the fully simulated photons coincides with the one used to build the library. In other words, the points of the library have to be rotated by 45 deg but not translated. The bottom plots compare theyclusandEmeas/Etot distributions in the case where the fully simulated photons
agreement with the full simulation does not worsen, proving that the idea behind the point library works.
The hits for particles with values of Eandθnot coinciding with a library node can be
obtained by correcting the points belonging to the closest node. This will be part of the next development steps. Preliminary tests indicate a gain of about 20 in the computing time required to simulateO(1) GeV photons in the calorimeter using the point library, compared to the Geant4-based simulation.
Figure 3.Comparison of photons simulated with Geant4 ("Full simulation") and with the point libraries ("Fast simulation"). Details are given in section 4.5.
5 Conclusions
In LHCb there is an ongoing effort to develop fast simulation alternatives to the nominal detector simulation to face the current and future limitations of CPU resources with respect to the size of the necessary simulated samples. In the detailed simulation based on Geant4 more than 50% of the CPU time is spent in the calorimeter system. The development of a faster simulation of the calorimeter based on "point" libraries is underway and the preliminary results in terms of time gain and simulation accuracy are encouraging.
References
agreement with the full simulation does not worsen, proving that the idea behind the point library works.
The hits for particles with values ofE andθnot coinciding with a library node can be
obtained by correcting the points belonging to the closest node. This will be part of the next development steps. Preliminary tests indicate a gain of about 20 in the computing time required to simulateO(1) GeV photons in the calorimeter using the point library, compared to the Geant4-based simulation.
Figure 3.Comparison of photons simulated with Geant4 ("Full simulation") and with the point libraries ("Fast simulation"). Details are given in section 4.5.
5 Conclusions
In LHCb there is an ongoing effort to develop fast simulation alternatives to the nominal detector simulation to face the current and future limitations of CPU resources with respect to the size of the necessary simulated samples. In the detailed simulation based on Geant4 more than 50% of the CPU time is spent in the calorimeter system. The development of a faster simulation of the calorimeter based on "point" libraries is underway and the preliminary results in terms of time gain and simulation accuracy are encouraging.
References
[1] LHCb collaboration, LHCb Upgrade Software and Computing Technical Design Report, CERN-LHCC-2018-007, LHCb-TDR-017.
[2] LHCb collaboration, R. Aaij et al., Measurement of the ratio of theBF(B0 → D∗−τ+ν
τ)
and BF(B0 → D∗−µ+ν
µ) branching fractions using three-prongτ-lepton decays, Phys.
Rev. Lett. 120 (2018) 171802.
[3] S. Agostinelli et al., (Geant4 Collaboration), Geant4: A simulation toolkit, Nucl. Instrum. Methods Phys. Res., Sect. A 506, 250 (2003); J. Allisonet al., (Geant4 Collaboration), IEEE Trans. Nucl. Sci. 53, 270 (2006).
[4] D. Mulleret al., ReDecay: A novel approach to speed up the simulation at LHCb, Eur. Phys. J. C 78, 1009 (2018).
[5] B. Siddi, A fully parametric option in the LHCb simulation framework, these proceed-ings.
[6] T. Sjöstrand, S. Mrenna, P. Skands, A brief introduction to PYTHIA 8.1, Comput. Phys. Commun. 178, 852 (2008).
[7] G. Barrandet al.GAUDI - A software architecture and framework for building HEP data processing applications, Comput. Phys. Commun. 140, 45 (2001).
[8] LHCb collaboration, A. A. Alves Jr.et al., The LHCb detector at the LHC, JINST 3 S08005 (2008).