Basis to develop a platform for multiple-scale
complex systems modeling and visualization:
MoNet
Gerardo L. Febres
*,
[email protected]
* Departamento de Procesos y Sistemas, Universidad Simón Bolívar, Baruta, Edo. Miranda, 01086 Venezuela.
Abstract
This work presents some characteristics of MoNet, a computerized platform for the modeling and visualization of complex systems. Emphasis is on the ideas that allowed the successful progressive development of this modeling platform, which goes along with the implementation of applications to the modeling of several studied systems. The platform has the capacity to represent different aspects of systems modeled at different observation scales. This tool offers advantages in the sense of favoring the perception of the phenomenon of the emergence of information, associated with changes of scale. Some criteria used for the construction of this modeling platform are included. The power of current computers has made practical representing graphic resources such as shapes, line thickness, overlaying-text tags, colors and transparencies, in the graphical modeling of systems made up of many elements. By visualizing diagrams conveniently designed to highlight contrasts, these modeling platforms allow the recognition of patterns that drive our understanding of systems and their structure. Graphs that reflect the benefits of the tool regarding the visualization of systems at different scales of observation are presented to illustrate the application of the platform.
Key Words: Complex systems modeling, systems architecture, system’s model complexity, visualization, agent-based systems, system’s model evolution.
1. Introduction
The increasing capacity of computers has enabled the numerical modeling of systems that a few decades ago was beyond our practical reach. The explosion of forms and styles to undertake the analysis of these systems has led to the emergence of new ways of organizing research around names such as the Science of Complexity and Data Science. Whether or not they are really 'new' Sciences, they reflect important differences in the way we do things today.
Some decades ago, when computers were still humble calculating machines, we used to prefer to understand phenomena by locating their key aspects; the dominant factors of their behavior. To this end, science endeavored to synthesize the description of systems and reduce it to simple mathematical expressions. Thus, our understanding of the world was limited by what it was possible to understand at the level or scale that we were able to represent with a paper and a pencil. By the end of the 80’s, when computers became a commonly used research tool, their use was almost limited to the repetitions of deterministic calculations, leaving aside, considering the phenomena of information-emergence which frequently occurs when the representation of a system changes from one scale to another. Despite the initially algorithmic-centered, and afterwards object-oriented programming techniques, it was already recognized that multiple scale systems modeling required more flexible paradigms of programming. Heylighen [1], for example, foresaw in 1991 the need for computerized systems with the ability to select different ways of viewing the object-system, evaluate some properties and thus,
modeling emergence. Nevertheless, there were not fully capable computers to develop in practice Heylighen’s emergence-modeling ideas.
The development of a set of best practices and programming paradigms has been a matter of discussion for the last three decades. Since 1987 Geoffrion [2][3] presented a series of papers defining the so called Structural Modeling Language (SML). The SML relied on a modular structure to somehow organize the model's entities and deal, up to some degree, with its complexity. This approach, however, needed to fix a priori the broadest and finest detail levels of the model, with its obvious disadvantages regarding the adaptation possibilities. In this line of development the Computer Aided Software Engineering (CASE) appeared in the early 90’s as a formal methodology to establish the limits of the model, the internal entity relationships and to recognize the system model major modules. With the increasing diversity of situations where models were needed, more flexible conceptions of computerized systems and their design process, appeared. In 2004, for example, Makowsky [4] offered the Structural Modeling Technology (SMT); a set of paradigms directed to cope with the defies imposed by complex systems. However, those technologies appeared and grew up around the concept of data-base. Then, the traditional structures used to represent the vast volumes of data we now have access to, are predominantly databases. Databases are structures of regular shapes and great simplicity, probably the simplest imaginable, that being able to organize the data in orthogonal grids, offer great advantages for data rapid location. However, traditional databases represent very different forms from those of the modeled system. Nature is not orthogonal. Perhaps because of the limitations of our 'mental languages', the system models developed through databases adopt orthogonal forms and do not allow the system itself to describe its form by means of the model. Conventional data-bases are too rigid structures.
The discussion about strategies to overcome the burden of analyzing data associated with complex problems with an increasingly detailed perspective, is growing in its intensity. Studies devoted to the Visual Analysis of Texts [5] and Deep Learning [6] deserve to be mentioned.
The objective of this paper is to discuss and spread information about the modeling platform MoNet. According to the experience while building MoNet, five features should be included as part of the internal structure of any program developed for the modeling of complex systems. Within the benefits of applying these ideas is an increase the possibilities for the platform’s adaptation to the changes of the real system, as well as to effectively represent the phenomena of information emergence associated with changes in the scale of observation.
2. Elements of a multiple-scale system modeling platform
Due to their nature, modeling complex systems is an activity difficult to plan. Complexity itself resists being synthesized, and essential or dominant aspects of the system modelled are hard to recognize. In fact, most of the complex systems models are justified as a tool to learn about the behavior and properties of the system. Therefore, the conventional paradigms of computer model design are prone to fail when the subject of the model is complex.
capabilities reside. This section depicts these aspects I consider essential for the success of any complex system analysis platform.
2.1.
Network data and visual structure.
Whereas traditional data structures, made up of tables, leave little freedom to adjust their form to the nature and condition of the modeled system, the data organized in the form of a network offer the capacity to grow in a virtually limitless adjustable form. A typical barrier in systems with data recorded in conventional databases, is the construction of tables in which fields are assigned to the registration of properties of the entities to which each table is destined. This implies the system's design must advance in order to accurately establish the agents' properties which in turn describe the system, thus compromising the possibilities the system itself has to indicate the aspect it is more convenient to grow or to deepen into more detailed levels. In contrast, the structure of the proposed data record is in the form of a network. More specifically, it is a file tree that can be shared among several data storage devices. Such a configuration can be considered as a Scale-Free structure that can grow with virtually no limits.
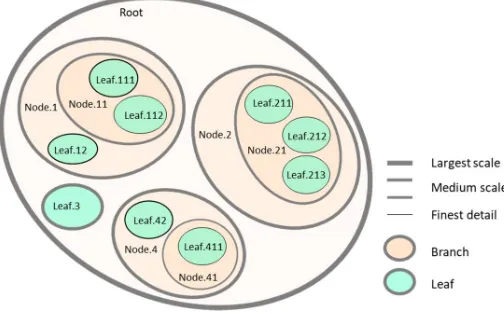
MoNet models any complex system by decomposing the system in the agents (parts) comprising it. While the union of these agents forms or describes the totality of the container-agent, there must not be any overlap of these contained agents. MoNet can model these internal agents by decomposing them into ‘smaller’ agents. Therefore, an increasingly detailed description of the system is possible by adding more decomposing agents into the model’s branch where there is interest for a more detailed description. The resulting agent hierarchy forms a network model structure which shape resembles a tree, with an agent located at each node of the tree. We refer to a node decomposed in further detailed agents as a ‘BRANCH’ node. If the node is at the end of the tree (is not further decomposed), we call it a ‘LEAF’. Figure 1 illustrates a system using this multi-scale logical representation.
Figure 1. Hypothetical multi-scale model of a complex system.
In its general use, MoNet represents an agent by showing the components at the highest scale level. Figure 3, which is consistent with Figures 1 and 2, illustrates the tabular description of agent ‘Root’ by showing its contained agents in each row of a grid. In this case the agents ‘Agent1.Node1’, ‘Agent2.Node2’, ‘Agent3.Node3’ and ‘Agent4.Node4’ are the components of agent ‘Root’. Notice not all attributes apply to all contained agents included in the table. This means that agents of different nature may live together as descriptors of their container agent.
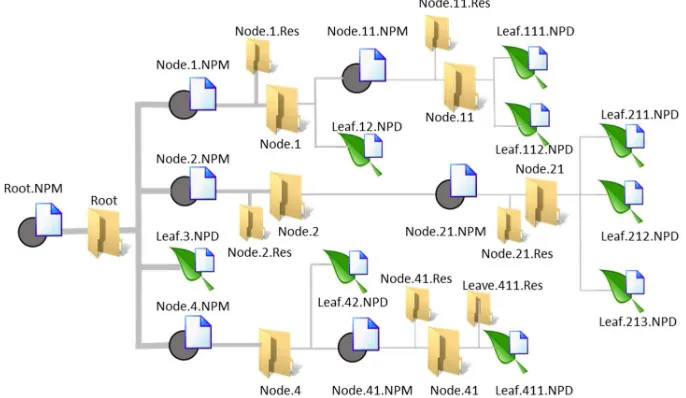
Figure 2. Hypothetical model of file structure showing the relationship between the files and the hierarchical membership relationship.
Figure 3. Decomposition of a higher-scale container agent into the lower-scale (more detailed) agents. The node Root.NPM is the container of all other agents shown in Figure 2. Agents Node1.NPM, Node2.NPM, and Node4.NPM are BRANCH-type, represented with light-blue colored attribute-cells in the grid. Agent3 Node3.NPD is a LEAF-type node represented with cyan colored attribute-cells in the table. Grey shadowed cell indicate a non-applicable attribute for the corresponding agents.
A third type of file is used to record a selection of elements, branches or leaves. Once the elements of a sub-set of the system have been selected, they can be visualized in the same graphical interface and have all the tools of analysis and graphs for their study, that now has the capacity to treat the system from different scales of observation simultaneously. The extension of these files is .NPS.
The replacement of the classical database with independent data files imposes the need to develop strategies for locating files according to criteria and filters. Commands that define the search addresses and other criteria for the location of the required information are essential for the proper functioning of a system with this architecture. There are several forms of these commands, and their number grows as the simulation platform evolves. Specially designed tags can be used to indicate the exact location of a target agent, as well as the name and the value of an attribute to specify any required condition.
A value exiting within the model net is signaled by setting the value of three coordinates: a. COORD. PATH: the agent’s path,
b. COORD.Agent.Name: the agent’s name, and
c. COORD.Agent.AttribName: the agent’s attribute which value is the one being searched.
A general expression pointing to an agent’s attribute-value is complete with a sentence liike:
<~> COORD. PATH </~>COORD.Agent.AttribName<@> COORD.Agent.Name </@>
The delimiter tags ‘<~>‘ and ‘</~>‘, and ‘<@>‘ and ‘</@>‘, indicate the expressions enclosed are the ‘COORD. PATH’ and the ‘COORD.Agent.Name’ respectively. These three coordinates can appear in any order.
The ‘COORD. PATH’ is used to specify the location of the file where the searched value is. The syntax is as follows:
COORD. PATH: <~><PathAttrib.LINK> = Agent’sPath</~>
The ‘COORD.Agent.Name’ is used to specify the agents containing the searched value. The syntax is as follows:
COORD.Agent.Name: <@><Agent’sIDAttribName> = Agent’sIDAttribVal</@>
Finally, the ‘COORD.Agent.AttribName’ specifies the name of the attribute evaluated, and the syntax is as follows:
COORD.Agent.AttribName: <Attrib’sName> A general expression pointing a value looks like:
<Attrib’sName><@><Agent’sIDAttribName> = Agent’sIDAttribVal </@><~><PathAttrib.LINK> = Agent’sPath </~>
When the referred attribute belongs to the agent being focused, the agent’s attribute value can be pointed just by the ‘COORD.Agent.AttribName’.
<Attrib’sName>
There are also ways to indicate agent localization tags within the system net. Thus, for example, the tags <BRANCH> or <LEAF> would indicate that the searched nodes are branches or leaves. If the tags were <BRANCH.SUPRA> or <LEAF.SUB>, then they would be branches in the higher hierarchy nodes, or leaves in nodes somehow contained inside the imaginary tree rooted from the starting node.
The specification of agent subsets within the whole set of agents making up a complex system, must be a capability of the computerized system. The context of this capacity should serve not only to filters used when selecting of information, but also for its use as a parameter that conditions the scope of the equations which describe the interrelationships of the agents of the system.
2.3. A language for data recording and management
For a computerized system operating over unstructured data ―data not organized according to its position in a table in a database―, some intelligence in the capacity of data identification and location is essential. In the absence of a database there are no data- management codes available. The handling of the information depends then on pseudo-languages that must be elaborated by the constructor of the system.
The purpose of this document is not to present complete documentation on the script language developed to serve MoNet. However, I have considered it convenient to include here the description of some of its characteristics. Let's start by saying that we will use the name 'Localizer' to refer to it. Localizer uses delimited tags with the '<' and '>' characters, similar to those used by the html and xml languages, to refer to objects, as agents and attributes, in its file-codes. The file describing an agent consists of statements that, except for special cases, occupy a line in the text file. There are statements to specify the agent's name, the location of the file on the web, the agents directly related, the agents contained and other properties describing the agent the file corresponds to.
A file describing an agent contains the identification and location of the agent, and references to the other agents that are contained or directly related to the agent being described. The ‘<NODE>’ and ‘</NODE>’ tags are used to indicate the start and the end of a contained agent or node. All describing attributes of the node must appear in between those delimiting tags. These attributes with their corresponding values are specified with the syntax:
<Attribute’sName>Attribute’sValue
When the attribute’s value is an expression leading to its actual value, the tag ‘<CurrentVal >’ is used to signal the current computed value of the expression and the syntax becomes:
<Attribute’sName>Attribute’sExpression< CurrentVal >Attribute’sValue
MoNet recognizes an Attribute’s Expression (used to compute the current value of an attribute) when the expression begins with the characters ‘= ‘. The Arithmetic operations are expressed with the syntax and operator’s precedence order typically used by any standard software. When needed, the operator’s precedence order can be specified using parenthesis ( ‘(‘ and ‘)’ ). Transcendental functions can be invoked using its name followed by the applicable function arguments enclosed by parenthesis, as following:
An Argument can be an expression. Therefore, nesting expressions is allowed. A complete list of function names are available within the software Help File and the documentation.
A list of attributes is registered using the character '|' to separate of the sentences referring to each parameter. A whole line describing an agent having N attributes may look as follows:
<NODE><Attribute1’sName>Attribute1’sValue|<Attribute2’sName>Attribute2’sValue| … |<AttributeX’sName>AttributeX’sExpression<CurrentVal> AttributeX’sValue| …
|<AttributeN’sName>AttributeN’sValue </NODE>
Some attributes are present for any agent. These attributes are referred to as ‘inherent attributes’ since they are inherently needed to describe any agent. Examples of this kind of attributes are those with identification purposes and the attributes used to register the path where the agent’s corresponding file is located. The type of node, which can be LEAF or BRANCH, is also an inherent attribute.
The name of the properties or attributes of the agents must include the specification of the data type. Thus, if for example, an attribute is used to register the name of an agent, the attribute must be referred to as 'Name.STRN', which specifies that it is a string type. The data types included, are: .STRN, .INTG, .FLOT, .BOOL, .LINK, .LIST, .STRC and .EXEC, corresponding to string, integer, floating, boolean, file-link, element list, structure of elements, and executable command. Figure 4 shows the code corresponding to the branch-file (,NPM file) corresponding to the agent Root of Figures 1, 2 and 3.
Figure 4. File associated with the description of agent Root in Figure 3 using the MoNet system.
2.4.
The Autonomous Data Representation
the description of that becomes a difficult task. Descriptions are also dependent on the perspective and scale of observation [8].
Most modern languages and programming frameworks offer some structure-types as part of their capabilities to model compound data-types. Python, for example, offers the ‘Tuples’ as a type representing a couple of values. In Python Tuples can be connected to form a list of Tuples. But non-regular structures, like trees or meshes, are very difficult to represent. Another system, the statistical program R, allows different types of operations involving arrays. It allows mathematical operations between matrixes and vectors, but also allows ‘element to element’ operations, which adds some power when array interactions, different from the mathematical arithmetic operations, are needed. Yet, certain pattern configurations of the elements are required, compromising the adaptability of the data to the ‘shape’ of the agent-attribute being modelled.
MoNet features a special syntax with the capability to handle a more general and flexible conception of compound data-types. Since the shape of the data-structure is defined in the data itself, I named this feature the ‘Autonomous Data Representation’. Thus, a compound data-structure written by the Autonomous Data Representations does not need to be declared. The Autonomous Data Representation is a logical syntactic representation which serves to represent two classes of structure topologies. The first class includes regular structures as orthogonal arrays of many dimensions, the second class includes scale-free structures as trees and meshes, which may not be seen as regular topologies; these are the most challenging applications of this technique.
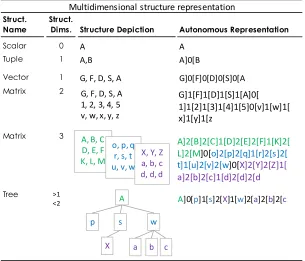
Figure 5. Examples of multidimensional structures according to the Autonomous Data Representation.
Figure 5 shows examples of structures of various dimensional shapes, represented according to the Autonomous Data Representation syntax here proposed. The representation consists of separating the single values of the array by using a special splitter symbol. The splitter symbol itself indicates the
Struct. Name
Struct.
Dims. Structure Depiction Autonomous Representation
Scalar 0 A A
Tuple 1 A,B A]0[B
Vector 1 G, F, D, S, A G]0[F]0[D]0[S]0[A
Matrix 2
Matrix 3
Tree
Multidimensional structure representation
G, F, D, S, A 1, 2, 3, 4, 5 v, w, x, y, z
G]1[F]1[D]1[S]1[A]0[ 1]1[2]1[3]1[4]1[5]0[v]1[w]1[ x]1[y]1[z
A, B, C D, E, F K, L, M
o, p, q r, s, t u, v, w
X, Y, Z a, b, c d, d, d
A]2[B]2[C]1[D]2[E]2[F]1[K]2[ L]2[M]0[o]2[p]2[q]1[r]2[s]2[ t]1[u]2[v]2[w]0[X]2[Y]2[Z]1[ a]2[b]2[c]1[d]2[d]2[d
s
A
p w
X a b c
A]0[p]1[s]2[X]1[w]2[a]2[b]2[c
dimensional substructures it is separating. The splitter symbol presents square brackets pointing outwards in both ends. Hence, if the structure whose components are being separated, is an array of three dimensions, then the splitter symbol ‘]0[‘ defines the 2-dimensional arrays comprising the 3-dimensional structure, the splitter symbol ‘]1[‘ indicates the limits of the 1-dimensional arrays comprising the 2-dimensional arrays and finally, the symbol ‘]2[‘ indicates the 0-2-dimensional, elementary values comprising the 1-dimensional arrays.
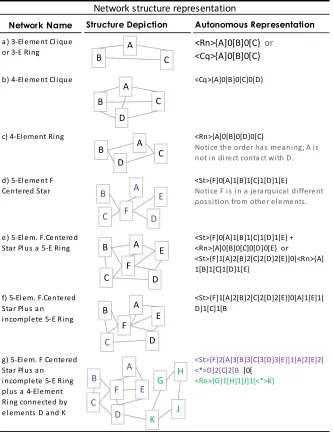
Figure 6. Examples of network synthetic representation with the Autonomous Data Representation.
Figure 6 shows how to represent some examples of meshes. When the network’s shape offers the possibility of being described with a noticeable characteristic, listing the node tags and this characteristic suffice for the description. Thus, the network a) in Figure 6 can be seen as either a 3-element clique or a 3-3-element ring. Therefore, it can be described as <Cq>{A]0[B]0[C} or <Rn>{A]0[B]0[C} where <Cq> and <Rn> are the corresponding net characteristic topology tags and A,
Structure Depiction Autonomous Representation
<Rn>{A]0[B]0[C} or <Cq>{A]0[B]0[C}
<Cq>{A]0[B]0[C]0[D}
<Rn>{A]0[B]0[D]0[C}
Noti ce the order has meani ng; A i s not i n di re ct conta ct wi th D.
<St>{F]0[A]1[B]1[C]1[D]1[E}
Noti ce F i s i n a jerarqui cal di ffere nt poss i ti on from othe r el e me nts .
<St>{F]0[A]1[B]1[C]1[D]1[E} + <Rn>{A]0[B]0[C]0[D]0[E} or <St>{F]1[A]2[B]2[C]2[D]2[E}]0[<Rn>{A] 1[B]1[C]1[D]1[E}
<St>{F]1[A]2[B]2[C]2[D]2[E}]0[A]1[E]1[ D]1[C]1[B
<St>{F]2[A]3[B]3[C]3[D]3[E}]1[A]2[E]2[ <*>D]2[C]2[B ]0[
<Rn>{G]1[H]1[J]1[<*>K}
g) 5-El em. F.Ce nte red Star Pl us a n i ncompl ete 5-E Ri ng pl us a 4-El ement Ri ng connected by e l ements D and K f) 5-El em. F.Centered Star Pl us a n i ncompl ete 5-E Ri ng e ) 5-El e m. F.Ce ntere d Star Pl us a 5-E Ri ng a ) 3-El e me nt Cl i que or 3-E Ri ng
Network structure representation
Network Name
b) 4-El e me nt Cl i que
c) 4-El ement Ri ng
B and C are the values representing some property at each node. Networks c) and d) are a 5-element ring and a 5 element star respectively. Hence their descriptions include the tags <Rn> and <St>. The net shown in e) can be seen as the superposition of the ring and the star of cases c) and d), and its description can be expressed by shifting the dimension indexes and using the dimensional index ‘]0’[ to join them in a unique expression. Similarly, in case g) the dimensional index ‘]0[‘ is used to join two networks thru elements D and K, and forming a description of the whole structure. The linking elements are indicated with the tag <*>.
2.5.
Graphic resource management
Recently, graphical representation of data has become a very active field of research. The capability of representing different perspectives of the studied system is of great attraction for any research and commercial software [9] [10]. At the same time, the construction of abstract graphs to model the behavior of the systems also gets great attention. The capacity of current computers allows the development of techniques to represent two-dimensional graphs, information referring to phenomena that exist in more than two dimensions. Thus, using bubbles, instead of points, with diameters and variable colors, it is possible to go beyond the two dimensions in graphics that in the strict sense, remain 2D.
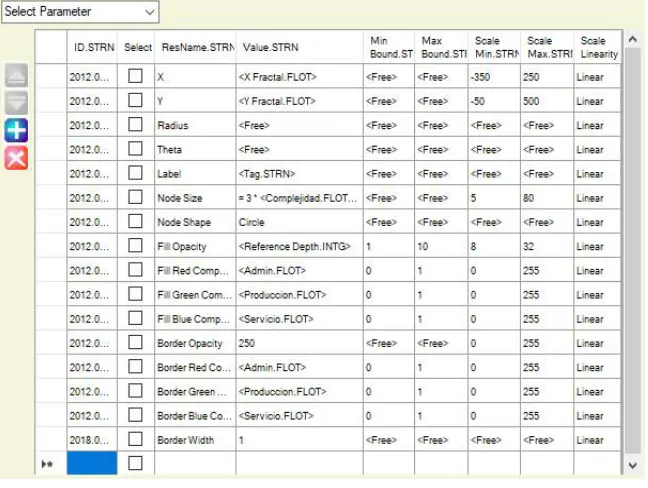
Figure 7. MoNet Graphics Resource Management Panel.
a philosophy that manages those graphical resources. The intensive use of this philosophy allows the representation of many dimensions in 2D chart. The components of each primary color, the shape and thickness of the edge of the bubbles, the degree of fill opacity and the edge are some of the graphic properties that can be associated with the value of the attributes of each agent represented in the graph. Figure 7 shows one of the reticles dedicated to this aspect of the system.
3. Applications and results
The specific needs for a multi-scale system modeler has lead us to develop MoNet: a locally conceived computer system that we have developed to perform our experiments. MoNet has evolved for about six years now. During this period MoNet has been used as the basis to perform several experiments, including the symbolic analysis of languages [12–14], Information-structure analysis [8], musical genres comparison [15], institutions fractal-representation [16]. After conceiving the idea and building an initial software structure, the construction of the system has been guided to respond to those needs that appear thru the development of each experiment, always sticking to some basic rules of programming, such as the use of abstract representations of data to allow for its universal application. Therefore, it is fair to accept these experiments have performed as a crucial role in the development MoNet, establishing a mutual relationship between the modeling platform and the experiments.
3.1. MoNet’s graphic user interface.
MoNet records all agents comprising a system in related, yet independent, files. Each agent is described by its attributes and the contained sub-agents. The agents 'know' its location within the file-structure network as well as how it relates to other agents. This agent-formed system description goes from an upper level agent, which may be considered the root, down to a succession of branches of agents progressively described with finer agents and more detailed attributes, until the formed description tree reaches a level where the agents do not contain deeper agents and are described by attribute values only.
This treelike structure is appropriate to resemble the way system- elements self-organize and function In nature, thus it successfully captures the hierarchical relationship among the system elements. MoNet allows navigating thru the system's structure by showing each agent component in a grid where contained sub-agents are described in a row of cells. The cells in an agent-row may, or may not, show the value of an attribute, organized in columns. There are ways to indicate whether or not the attribute is applied to the specific sub-agent being described. Figure 3 illustrates how different colors are used to indicate the scope of an attribute.
A cell containing an attribute consisting of a link to another agent, can be seen in an inner scale, and the target agent’s description is opened up in another window sharing the same interface anatomy, but applied to another observation scale and may focus a different aspect of the system described. These features enable the interface to represent agents of a variety of natures in the same grid. Its capacity to grow and to extend the boundaries of the system’s description is practically unlimited. MoNet’s interface and file-structure serves to keep organized large sets of systems being modelled, thus allowing for the proper administration of each system’s model at the scale level selected. MoNet has been the basis to accomplish studies of ‘families’ of highly complex descriptions of systems [15,16].
Localizer, the script language developed, together with the autonomous representation of data has allowed the control of the complex data structure that serves each computer model. In order to understand the dimension of the difficulty that the program faces, the requirements of this program can be compared with those of a spreadsheet. In a spreadsheet the models are described by reference to the position of each element in a grid. These reticular structures can grow up to three dimensions, which make up the so-called ‘workbooks’. In the present case, the data structure may have any shape; can be reticular, such as spreadsheets, or trees representing a certain hierarchy between data, or meshes, which due to their low required regularity, have the capacity to represent even more complex situations. Logically, the flexibility of being able to represent any hierarchical structure, or system of relations through the form of the network of data files, will be paid at the time when the system needs to locate a piece of data, which comparatively would be harder in a mesh than when using orthogonal coordinates; as would be the case in the spreadsheets. A language must be available that allows the localization of data in that malleable structure, allowing the natural structure of any system to be appropriately represented by the data structure built at different levels of detail.
3.3. Capabilities for rich visualization tools and multiple scale representation
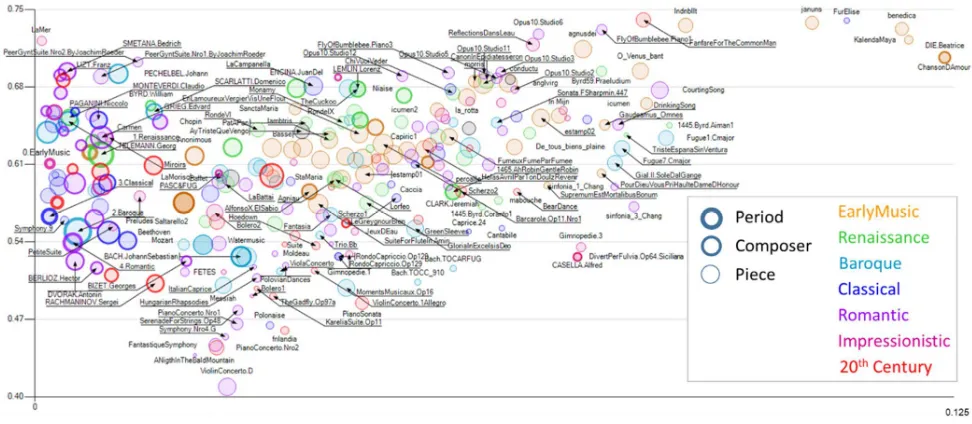
The philosophy of managing graphics resources to increase the readability of two-dimensional graphics has allowed for the representation of seven or even more dimensions in 2D graphics. The graphical resources used include the positions on the X and Y axes (angle and radius for polar coordinates) and various graphical properties of the bubbles that represent each agent within the system such as: diameter, shape, thickness of the edge line, Fill opacity, edge opacity, and component of each primary color. The visualization of model attributes by means of graphical representation properties has been widely used during the last decade. A pioneer in these style of graphing was Hans Rosling et al [11]. What is proposed here is to fully extend this concept to all available graphic properties and to integrate such graphic capabilities to the numerical computer modeler to obtain more than just a visualization tool, but a complex-system modeler that uses visualization as one of its means to fully depict experimental results.
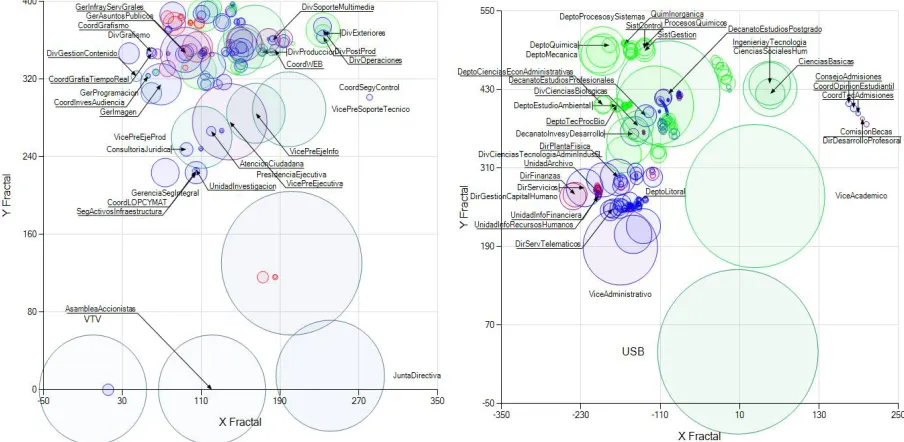
As a sample of the results obtainable with these features, I refer two studies. The first one is the engineering thesis by S. Pizzo [16], where she describes the hierarchical organization of different sized institutions. Figure 8 shows fractals associated to the organizational structures of a Venezuelan TV channel and the Universidad Simón Bolívar, also in Venezuela. A brief explanation of the parameters used to form these fractals is included explained in the Appendix.
(a) (b)
Figure 8. The representation of two organizational structures. Both representations offer fractal views of the structure of two different institutions. These fractal representations include measures of organizational complexity (bubble diameter), and work orientation towards production (green), administrative (red), and service (blue) tasks. Figure 8a shows the structure corresponding to a Venezuelan TV channel and Figure 8b shows the structure of the Universidad Simon Bolivar. Both representations are fractal-like diagrams which allow for a quick visual evaluation of the relative order for both institutions. Presented here with permission of Stefhani Pizzo.[16].
3.4. MoNet’s data structure and its capacity for evolution
The organization of data in a hierarchical way in a tree-shaped structure offers advantages over its orthogonal counterpart such as tables in conventional databases. The tree structure organizes the agents, each formed by a data file, into nested directories according to the hierarchical order considered with a dominant nature in the modeled system. It happens that in most recognizable systems, this hierarchical organization leads to the recognition of subclasses of agents that populate the model with numbers distributed in an approximated logarithmic way (or exponential, depending on the point of view).
This feature gives the data structure the capability of growing into further detail for those selected entities for which this data-complexity increase is justified. On the contrary, for conventional databases, increasing the description detail of an entity, would require an additional table, where space for all instances of the entity must be reserved, in spite of the real need for the detailed description of only some of the instances. This difference provides the tree-data structure with the advantage of being more efficient in terms of reducing data redundancy, and more importantly the tree-data structure offers a much more flexible structure allowing for a faster and limited risk experimentation when expanding the details represented in the data register.
4. Discussions
4.1.
Flexibility vs. Data Structure
The construction of computer programs based on structured data has long been the commonly accepted way of approaching the problem of designing systems. The use of tables to represent object properties has become an effective vehicle for organizing objects represented in the computer model and in the general information system. Techniques to represent relationships between different types of entities have been a major advance in the modeling of complex systems during the 1990s.
Even prior to their splendor time, when CASE Tools dominated the Information Systems project activities, the limitations of this system design technique were already identified. In a study published in 1988, Charles Martin [17] mentioned some limitations of CASE Tools he considered important, as methodology constraints, administration difficulties, documentation inadequacies, and graphic-artist requirement. Leaving this reference without additional comment lacks of fairness with CASE tools. Case Tools were perhaps the single most relevant information system design during the early 90’s. At that time, the still limited computer capacity and the incipient operative network dominance, did not allow a more extensive impact of CASE Tools.
4.2. A better understanding of complexity in a computerized system
It is often attempted to measure the size and power of programs by specifying their number of routines or instructions. These dimensions refer more to the work and the cost of designing and coding a computerized program than to the actual performance of the final result. In fact, if I had to bet on the better of the two programs, I would better regard rely the lighter than the heavier. There are more appropriate measures to evaluate the quality of software segments. Some of these measures are well known. One of them is the concept of Computational Complexity, which refers to the estimation of the resources required by an algorithm to achieve a result. The evaluated resources are typically time and memory space. The problem is that Computational Complexity evaluates the performance of an algorithm, while today, in most cases, a system consists of many 'coexisting' algorithms in an environment full of other components, and where the effectiveness of the algorithms does not necessarily define the effectiveness of the whole software.
As for the search and read times of the file associated with an agent, conventional databases certainly allow search times much lower than the crawling required for locating an agent in a directory and file network. But the algorithms of search in tables require the implementation of indexes that 'hide' much fragility in the databases and that require important efforts of maintenance.
MoNet’s network-like data store and the pseudo languages needed to control and use the data, were developed independently. Recently I came across with the relatively new NoSQL databases. MoNet’s works with a file-data structure very similar to the NoSQL database structures. Thus, the same weaknesses as the need to develop a query language, difficulty to backup data and low standardization, should be expected. However, it should be mention after these issues are overcome, there is a great deal of independence and adaptability which justify the effort, especially at the initial stages of the developing process. Once the system is working and allowing its application to real use, the system itself, frequently indicates what the good design decisions are.
In an environment of research and productivity where performance is more closely associated with the speed with which the computer platform conforms to the particular requirements of an experiment, it is convenient to adopt a data structure capable of assimilating objects of a novel nature without a major struggle in the process of development. Having an own interpreted script-language, capable of incorporating new requirements, while keeping previously established criteria and syntax elements, or on the contrary incorporating new criteria and making the syntax to evolve, offers important advantages in this regard.
4.3. Complex system scenarios
Perhaps the most highlighting capability resulting from MoNet’s architecture is the possibility for modeling large sets or families of complex systems, and to represent aspects of them to form complete landscapes of systems, and to offer the possibility of visually enhance our empirical sense of the behavior of the complex systems.
5. Conclusion
initiated in 2011. The experience with MoNet as a lasting modeling platform, confirms this systems’ architecture is viable and that it offers effective representations of the phenomenon of emergence of information that occurs with changes on the scale of observation.The development of MoNet has not been absent of difficulties and harsh technical problems. Storing model’s data in a similar way to the NoSQL databases, imposes the need for developing specialized pseudo languages, data structures, searching algorithms and filters, graphic interfaces and even novel strategies for input data and to show results. When considering starting the development of a system, these barriers may bias the decisions in favor of predeveloped tools and make the ‘illusory’ decision to solve problems by incorporating them into the system. Possibly the development conditions of MoNet, an environment where MoNet has served to describe, control and organize scientific simulations that work as experiments, have made feasible to apply the best decision of implementation and not necessarily the fastest. This experience shows the great adaptability that comes along with these developing criteria, is worth.
When the perspective on software design is not dominated by a commercial character, the techniques that should be adopted are those that offer possibilities of growth and adaptation to the increasingly frequent changes of today’s environment. These results suggest that software treatment as a language capable of adapting to the requirements and evolve towards high levels of effectiveness, offers advantages in the medium term, compensating for the costs of the slow start that characterize this style of programming.
Supplementary Materials: Graphs of previous studies using MoNet are included in the Appendix. Full scale and working graphs are available at http://gfebres.net (click on downloads and downloadMonet.4)[18].
Funding: The current version of MoNet has been entirely and exclusively developed by Gerardo Febres, No external funding have been received to support this development or this document.
Conflicts of Interest: The author declares no conflict of interest.
References
1. Heylighen F. Modelling Emergence. World Futur J Gen Evol. 1991;31: 89–104. doi:10.1080/02604027.1991.9972256
2. Geoffrion A. An Introduction ToStructured Modeling. Manage Sci. 1987;33.
3. Geoffrion A. 1992.Geoffrion.SML.StructuredSThe SML. Language for Structured Modeling: Levels1 and 2. Oper Res. 1992;40: 38–57.
4. Makowski M. A structured modeling technology. Eur J Oper Res. 2005;166: 615–648. doi:10.1016/j.ejor.2004.03.037
5. Dou W, Liu S. Topic- and Time-Oriented Visual Text Analysis. IEEE Comput Graph Appl. 2016; 6–9. doi:10.1002/ca.20266
6. Choo J, Liu S. Visual Analytics for Explainable Deep Learning. IEEE Comput Graph Appl. IEEE; 2018;38: 84–92. doi:10.1109/MCG.2018.042731661
7. Patel AD. Language, music, and the brain: a resourche-sharing framework. Lang Music as Cogn Syst. 2012; 204–223. doi:10.1111/j.1756-8765.2009.01080.x
9. Hull CH, Willett W. Data Tectonics: A Framework for Building Physical and Immersive Data Representations. IEEE Comput Graph Appl. IEEE; 2018;38: 11–17.
doi:10.1109/MCG.2018.053491726
10. Zeng W, Ye Y. VitalVizor: A Visual Analytics System for Studying Urban Vitality. IEEE Comput Graph Appl. 2018;38: 38–53. doi:10.1109/MCG.2018.053491730
11. Rosling H, Rosling O, Rosling A. Gapminder [Internet]. [cited 16 Oct 2016]. Available: https://www.gapminder.org/
12. Febres G, Jaffe K, Gershenson C. Complexity measurement of natural and artificial languages. Complexity. 2015;20: 429–453. doi:10.1002/cplx.21529
13. Febres G, Jaffe K. Quantifying structure differences in literature using symbolic diversity and entropy criteria. J Quant Linguist. 2017;24. doi:10.1080/09296174.2016.1169847
14. Febres G, Jaffe K. Calculating entropy at different scales among diverse communication systems. Complexity. 2016;21: 330–353. doi:10.1002/cplx.21746
15. Febres G, Jaffe K. Music viewed by its Entropy content: A novel window for comparative analysis. PLoS One. 2017; doi:10.1371/journal.pone.0185757
16. Pizzo S. MÉTODO DESCRIPTIVO DE ESTRUCTURAS ORGANIZACIONALES BASADO EN
REPRESENTACIONES SIMBÓLICAS DE SISTEMAS COMPLEJOS. Universidad Simón Bolívar. 2018.
17. Martin CF. Second Generation Case Tools: A Challenge to Vendors. IEEE. 1988;5.
18. Febres GL. Gerardo Luis Febres [Internet]. 2019 [cited 9 Mar 2019]. Available: gfebres.net
Appendix
Graphic results from two studies performed with MoNet are included in this Appendix. To see these graphs directly drawn by MoNet, the reader may install a deliverable version developed for this purpose available at http://gfebres.net (click on /downloads and downloadMonet.4) [18].
Figure A1. The representation of two organizational structures. Both representations offer fractal views of the structure of the structure corresponding to a Venezuelan TV channel (Figure 8 Left) and the structure of the Universidad Simon Bolivar (Figure 8 right). The tags show subdivisions of each organization.