Effect of Soft Storey on Structural Response of
High Rise Building
Vipin V Halde
1, Aditi H. Deshmukh
21 PG Student, Dept. of Civil Engg., Shiwaji College of Engineering & Technology, Akola, Maharashtra, India
2 Assistant Professor, Dept. of Civil Engg, Shiwaji College of Engineering & Technology, Akola, Maharashtra, India
ABSTRACT: In high rise building or multi storey building, soft storey construction is a typical and unavoidable feature because of urbanization and the space occupancy considerations. These provisions reduce the stiffness of the lateral load resisting system and a progressive collapse becomes unavoidable in a severe earthquake for such buildings due to soft storey. This storey level is unable to provide adequate resistance, hence damage and collapse.
In the current study the focus is to investigate the effect of a soft storey for multi-storeyed high rise building with different models having identical building plan. Equivalent diagonal struts are provided as suggested in FEMA-273 in the place of masonry to generate infill effect. Soft storey level is altered at different floors in different models & equivalent static analysis is carried out using SAP 2000 analysis package.
KEYWORDS:Soft Storey, SAP 2000, Equivalent Strut, High Rise Building
I. INTRODUCTION
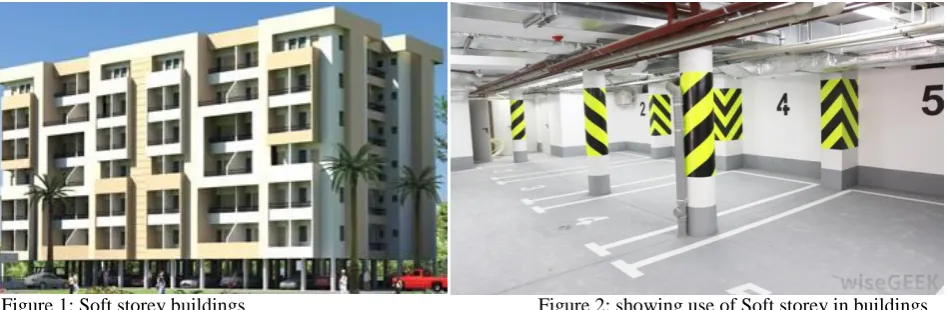
Many urban multi storey buildings in India today have open ground story as an unavoidable aspect, basically to generate parking or reception lobbies as shown in figure 1 & figure 2. The upper storeys have brick infilled wall panels with various opening percentage in them. These types of buildings are not desirable in seismically active areas because various vertical irregularities are induced in such buildings which have performed consistently poor during past earthquakes. It has been known since long time that masonry infill walls affect the strength and stiffness of infilled framed structures. Infill walls are generally seen as a non structural element and their effect is neglected by ignoring the stiffness of the infill wall during the modelling phase of the structure (analysed as a „linear bare frame‟) leading to substantial inaccuracy in obtaining the actual seismic response of framed structures.
Figure 1: Soft storey buildings Figure 2: showing use of Soft storey in buildings
important information about the structural behavior of the system. Therefore dynamic analysis procedure is required in many of the actual codes for accurate distribution of the earthquake forces along the building height, determining modal effects and local ductility demands efficiently. The upper stories moves as single block as there is presence of infill masonary which makes it stiffer. Hence displacment is more in soft storey
Again During an earthquake, bending moment and shear strength increses on the columns and beams in the soft floors than the one in the upper storeys. As the walls do not exist in the soft storey floor, columns are stressed more. If the columns are not capable to resist shear they may be damaged or lead to collapse which is shown below in figure 3.
Figure.3 Damages in columns during earthquake
II. HIGH RISE BUILDINGS
III. METHODOLOGY
MODELLING OF EQUIVALENT STRUT
For an infill wall located in a lateral load-resisting frame, the stiffness and strength contribution of the infill has to be considered. Non-integral infill walls subjected to lateral load behave like diagonal struts. Thus an infill wall can be modelled as an equivalent compression only strut in the building model. Rigid joints connect the beams and columns, but pin joints connect the equivalent struts to the beam-to-column junctions. This section explains the procedure to calculate the modelling parameters (effective width, elastic modulus and strength) of an equivalent strut. The geometric characteristics of infilled frame follows are as shown in figure 4.
Figure 4..Geometric Characteristics of Infilled Frame
Equivalent area of strut,
A
e
W t
eWidth of strut,
0.4
0.175(
)
e
W
h
d
4
sin(2 )
4
'
i
f c
E t
E I h
Where,
Ei - The modules of elasticity of the infill material, N/mm2
T - Thickness of the brick infill,
θ - tan-1 (h/ℓ),
Ef - The modules of elasticity of the frame material, N/mm
2
Ic - The moment of inertia of column, mm
4
h' - Height of brick infill,
ℓ‟ - Length of brick infill,
h & ℓ - The height & length of the frame, measured between the centerlines of the
beams & columns respectively,
d - Diagonal length of the brick infill,
We - Width of diagonal strut and
DESCRIPTION OF STRUCTURAL MODEL
In this work G+12 three dimensional models are selected for which the soft storey behavior is modelled. For this a typical rectangular building is taken having 5 bays in X-direction each is of 6 m span, and the 3 bays in Y-direction each of 4.5 m span each. Height of each story is taken as 3.0 m. Models are generated to get displacement, storey drift, base shear and story shear are discussed here in this work.
The common practice of building design considers infill as non structural elements and building is designed as framed structures without regard to structural action of masonry infill walls. The soft storey effect and presence of infill in any building changes the behavior of frame action due to the relative changes of stiffness of the frame by a factor of three to four times and lateral load distribution. Such buildings are required to be analyzed by the dynamic analysis and designed carefully. As the dynamic ductility demand during probable earthquake gets concentrated in the soft storey and the upper storey tends to remain elastic. Hence the building is totally collapsed due to soft storey effect shown as below in figure 5.
Figure 5. Failure due to large lateral displacement in soft storey
DETAILS OF STRUCTURAL ELEMENTS AND MATERIAL USED
Plan dimensions 30m×13.5m
Total height of building 39 m
Height of each storey 3.0m
Size of beams 300mm×450mm
Size of columns 450mm×450mm
Thickness of slab 120mm
Thickness of Shear Wall 150mm
Thickness of external walls 230mm
Seismic zone III
Soil condition Medium soil (Type II)
Zone factor 0.16
Response reduction factor 5
Importance factor 1
Live load at all floors 3.0 kN/m
Grade of Concrete M25
Grade of Steel Fe415
Concrete:
Density of Concrete 25 kN/m3
Modulus of Elasticity 5000 fck = 25000 N/mm2
Compressive strength 25 N/mm2
Masonry infill:
Density of brick masonry 19 kN/m3
Poisson‟s ratio for brick 0.2
Clay burnt brick, Class A, confined unreinforced masonry
Compressive strength of brick (fm) 10 N/mm2
Modulus of Elasticity 550 fm = 5500 N/mm2
Depth is thickness of wall 230mm
Width of equivalent struts 740 mm in X-direction, 570 mm in Y-direction
IV. MODELLING
ANALYTICAL MODELS CONSIDERED
1) Model 1. Bare Frame (RC frame without considering infill Masonry effect)
2) Model 2. RC frames buildings model with infill of Strut Frame at all storey
3) Model 3. RC frames buildings with soft storey at ground storey and infill at all above storey.
4) Model 4 RC frames buildings with soft storey at Sixth storey and infill at all other storey
5) Model 5 RC frames buildings with soft storey at Twelth storey and infill at all other storey
Figure 6: Model 1 showing extrude plan and 3D view of bare frame
Figure 8: Model 3 showing Elevation and 3D view
Figure 9: Model 4 showing Elevation and 3D view
ASSIGNING LOADS
After having modeled the structural components, load cases are assigned as follows:
Gravity loads
Gravity loads on the structure include the self weight of beams, columns, slabs, walls and other permanent members. The self weight of beams and columns (frame members) and slabs (area sections) is automatically considered by the program itself.
The wall loads have been calculated and assigned as uniformly distributed loads on the beams.
Wall load
Wall load = unit weight of brickwork×thickness of wall×height of wall.
Unit weight of brick work = 19 kN/m3
Thickness of wall = 0.23m
Wall load on floor levels = 19×0.23×3 = 13.11kN/m (wall height = 3m)
Live loads
Live loads have been assigned as uniform area loads on the slab elements as per IS 1893 (Part 1) 2002
Live load on floors = 3.0 kN/m2
Percentage of Imposed load to be considered in Seismic weight calculation, as per IS 1893 (Part 1) 2002, since the live
load class is up to 3 kN/m2 , 25% of the imposed load has been considered.
The seismic weight
The seismic weight of each floor is its full dead load plus appropriate amount of imposed load.
The defined load patterns are as shown below in figure 4.9 having Dead load, live load and horizontal earthquake load in both i.e X direction and Y direction as per IS 1893(Part 1):2002.
V. RESULTS AND DISCUSSIONS
DISPLACEMENTS
The data of displacement is collected for in X & Y direction for seismic loading from that all models and shown below. Table.1.Displacements of Various Models in X direction & Y direction
Floor Model 1 Model 2 Model 3 Model 4 Model 5
No. Ux Uy Ux Uy Ux Uy Ux Uy Ux Uy
GL 0.0000 0.0000 0.0000 0.0000 0.0000 0.0000 0.0000 0.0000 0.0000 0.0000
1 1.6375 1.4916 0.2734 0.3754 1.3219 1.3568 0.2686 0.3687 0.2686 0.3685
2 4.3241 3.8590 0.6349 0.8879 1.7493 1.9397 0.6239 0.8726 0.6236 0.8709
3 7.1828 6.3732 1.0152 1.4583 2.1147 2.4950 0.9978 1.4337 0.9968 1.4292
4 10.0513 8.9199 1.4082 2.0783 2.5028 3.1065 1.3856 2.0449 1.3822 2.0351
5 12.8769 11.4566 1.8080 2.7364 2.8956 3.7546 1.7668 2.6837 1.7737 2.6772
6 15.6215 13.9480 2.2084 3.4208 3.2894 4.4285 2.2581 3.4534 2.1652 3.3436
7 18.2430 16.3549 2.6027 4.1185 3.6771 5.1154 3.9737 5.3815 2.5500 4.0213
8 20.6931 18.6327 2.9834 4.8158 4.0515 5.8019 4.4244 6.1528 2.9202 4.6966
9 22.9166 20.7312 3.3421 5.4981 4.4042 6.4737 4.7712 6.8234 3.2674 5.3548
10 24.8522 22.5949 3.7268 6.1586 4.7740 7.1240 5.1526 7.4804 3.6378 5.9887
11 26.4306 24.1636 3.9567 6.7566 5.0086 7.7130 5.3842 8.0745 3.8534 6.5569
12 27.5847 25.3753 4.1922 7.3012 5.2403 8.2494 5.6185 8.6153 4.0926 7.0887
Comparison of Displacements
For easy comparison of displacements of selected building, plots of the floor level versus displacements in both transverse and longitudinal direction are made for different models and all imposed on same graph.
Graph 1: Displacements in all Models at All Storey Levels in X Direction
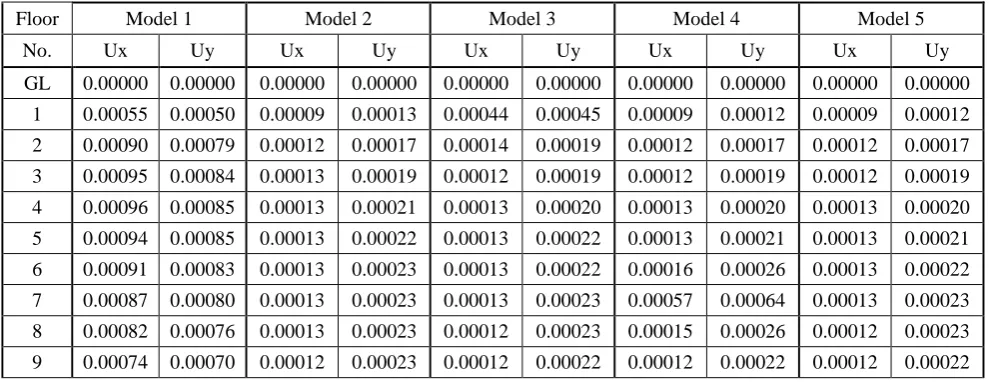
STOREY DRIFT
Lateral drift and inter-storey drift are commonly used damage parameter in structural analysis. In this study, lateral drift of the 3D building frame was analyzed for earthquake load coming from long direction. Inter storey drift was also evaluated and tabulated which is given by
where, Ui – Ui-1 = relative displacement between successive storey, hi = storey height.
From the above Displacements, the table no 8.2 is obtained showing storey drift values of all models in X & Y directions.
Table 2.Storey Drift of Various Models in X direction & Y direction
Floor Model 1 Model 2 Model 3 Model 4 Model 5
No. Ux Uy Ux Uy Ux Uy Ux Uy Ux Uy
GL 0.00000 0.00000 0.00000 0.00000 0.00000 0.00000 0.00000 0.00000 0.00000 0.00000
1 0.00055 0.00050 0.00009 0.00013 0.00044 0.00045 0.00009 0.00012 0.00009 0.00012
2 0.00090 0.00079 0.00012 0.00017 0.00014 0.00019 0.00012 0.00017 0.00012 0.00017
3 0.00095 0.00084 0.00013 0.00019 0.00012 0.00019 0.00012 0.00019 0.00012 0.00019
4 0.00096 0.00085 0.00013 0.00021 0.00013 0.00020 0.00013 0.00020 0.00013 0.00020
5 0.00094 0.00085 0.00013 0.00022 0.00013 0.00022 0.00013 0.00021 0.00013 0.00021
6 0.00091 0.00083 0.00013 0.00023 0.00013 0.00022 0.00016 0.00026 0.00013 0.00022
7 0.00087 0.00080 0.00013 0.00023 0.00013 0.00023 0.00057 0.00064 0.00013 0.00023
8 0.00082 0.00076 0.00013 0.00023 0.00012 0.00023 0.00015 0.00026 0.00012 0.00023
9 0.00074 0.00070 0.00012 0.00023 0.00012 0.00022 0.00012 0.00022 0.00012 0.00022
0.00 5.00 10.00 15.00 20.00 25.00 30.00
0 1 2 3 4 5 6 7 8 9 10 11 12 13
Dis
pla
ce
m
ent
(
m
m
)
Floor Level
Comparison of Displacements in X- Direction (mm)
Model 1
Model 2
Model 3
Model 4
10 0.00065 0.00062 0.00013 0.00022 0.00012 0.00022 0.00013 0.00022 0.00012 0.00021
11 0.00053 0.00052 0.00008 0.00020 0.00008 0.00020 0.00008 0.00020 0.00007 0.00019
12 0.00038 0.00040 0.00008 0.00018 0.00008 0.00018 0.00008 0.00018 0.00008 0.00018
13 0.00023 0.00027 0.00006 0.00016 0.00006 0.00015 0.00006 0.00016 0.00015 0.00023
Comparison of Storey Drift
A graph is plotted taking floor level versus storey drift for different models in both transverse and longitudinal direction.
Graph 2: Storey Drift in all Models at All Storey Levels in X Direction
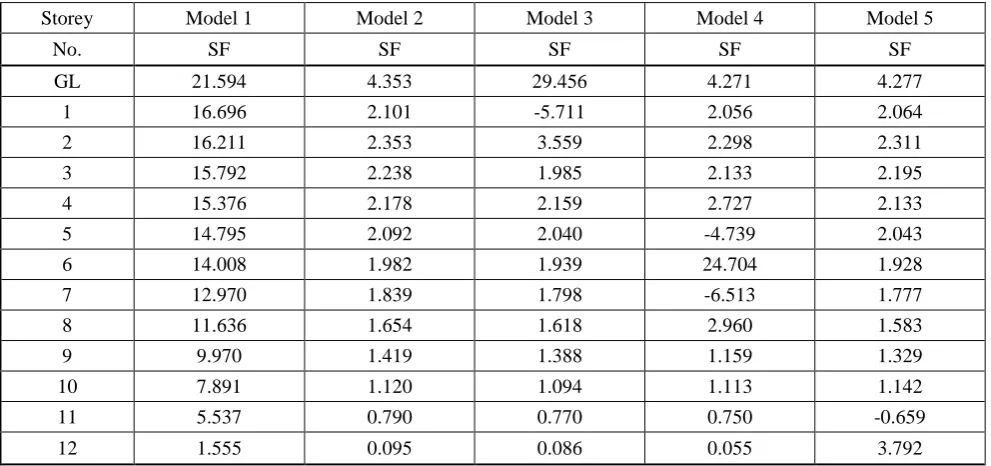
SHEAR FORCES
Table 3.Displacements of Various Models in X direction & Y direction
Storey Model 1 Model 2 Model 3 Model 4 Model 5
No. SF SF SF SF SF
GL 21.594 4.353 29.456 4.271 4.277
1 16.696 2.101 -5.711 2.056 2.064
2 16.211 2.353 3.559 2.298 2.311
3 15.792 2.238 1.985 2.133 2.195
4 15.376 2.178 2.159 2.727 2.133
5 14.795 2.092 2.040 -4.739 2.043
6 14.008 1.982 1.939 24.704 1.928
7 12.970 1.839 1.798 -6.513 1.777
8 11.636 1.654 1.618 2.960 1.583
9 9.970 1.419 1.388 1.159 1.329
10 7.891 1.120 1.094 1.113 1.142
11 5.537 0.790 0.770 0.750 -0.659
12 1.555 0.095 0.086 0.055 3.792
0.00000 0.00020 0.00040 0.00060 0.00080 0.00100 0.00120
0 1 2 3 4 5 6 7 8 9 10 11 12 13
Sto
re
y
Drif
t
Floor Level
Storey Drift in X-Direction
Model 1
Model 2
Model 3
Model 4
Comparison of Shear Force
The maximum shear forces in the columns in longitudinal direction for all models are shown below in graphs.
Graph 3: Shear Forces in all Models at All Storey Levels
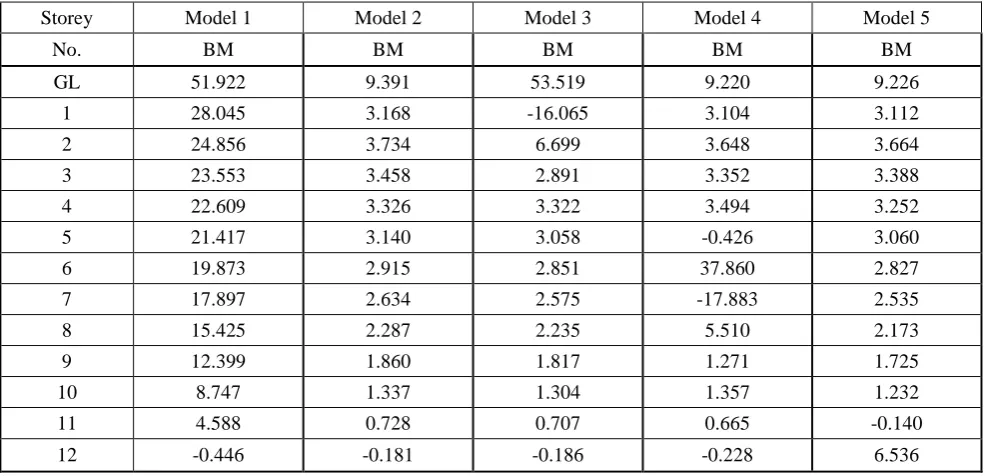
BENDINGMOMENT(KN-M))
The data of shear force is collected for seismic loading from that all the eight models and shown below
Table 4: Bending Moments in the columns in longitudinal direction
Storey Model 1 Model 2 Model 3 Model 4 Model 5
No. BM BM BM BM BM
GL 51.922 9.391 53.519 9.220 9.226
1 28.045 3.168 -16.065 3.104 3.112
2 24.856 3.734 6.699 3.648 3.664
3 23.553 3.458 2.891 3.352 3.388
4 22.609 3.326 3.322 3.494 3.252
5 21.417 3.140 3.058 -0.426 3.060
6 19.873 2.915 2.851 37.860 2.827
7 17.897 2.634 2.575 -17.883 2.535
8 15.425 2.287 2.235 5.510 2.173
9 12.399 1.860 1.817 1.271 1.725
10 8.747 1.337 1.304 1.357 1.232
11 4.588 0.728 0.707 0.665 -0.140
12 -0.446 -0.181 -0.186 -0.228 6.536
-10.000 -5.000 0.000 5.000 10.000 15.000 20.000 25.000 30.000 35.000
0 1 2 3 4 5 6 7 8 9 10 11 12
Sh
ea
r
F
o
rc
e
(k
N)
Storey Level
Shear Force (kN)
Model 1
Model 2
Model 3
Model 4
Comparison of Bending Moment
The maximum bending moments in the columns in longitudinal direction for all models are shown below in graphs.
Graph 4: Bending Moments in all Models at All Storey Levels
VI.CONCLUSION
RC frame buildings with open first storeys are known to perform poorly during in strong earthquake shaking. In
this paper, the seismic vulnerability of buildings with soft first storey is shown through an example building. The drift and the strength demands in the first storey columns are large for buildings with soft ground storeys and hence necessary measures should taken to improve capacities of the columns in the soft first storey.
From the analysis it is seen that, deflection is more in case of bare frame as compare to that of infill frame, because
presence of infill contributes to the stiffness of building. This effect is clear from Model 1.
When we compare the results obtained of Model 5 with Model, we can see that Model 5 gives better results than
Model 4. Thus intermediate soft storey should be avoided and if at all needed should be provided at top storey.
When the position of soft storey moved to higher level then parameters tends to reduced.
Results shows that Moments & Shear forces are always maximum at soft storey level in all Models.
These results will help design engineers in fast & reliable assessment of effects of soft storey.
Thus proper care, expert design, detailing and execution are needed in soft storey buildings.
REFERENCES
[1] Bureau of Indian Standards: IS-875, part 1 (1987), dead loads on buildings and Structures, New Delhi, India. [2] Bureau of Indian Standards: IS-875, part 2 (1987), live loads on buildings and Structures, New Delhi, India.
[3] Bureau of Indian Standards: IS-1893, part 1 (2002), “Criteria for earthquake resistant design of structures: Part 1 General provisions and buildings”, New Delhi, India.
[4] Bureau of indian standards , National building code of india 2005
[5] FEMA-356/November:2000, Federal Emergency Management Agency, Prestandard and Commentary For The Seismic Rehabilitation Of Buildings,.
[6] M.R. Amin, P. Hasan. B.K. and M.A. Islam, Effect of soft storey on multistoried reinforced concrete building frame, 4th Annual Paper Meet and 1st Civil Engineering Congress, December 22-24, 2011, Dhaka, Bangladesh Noor, Amin, Bhuiyan, howdhury and Kakoli (eds)
[7] A.S.Kasnale and Dr. S.S.Jamkar, Study of Seismic performance for soft basement of RC framed Buildings.
[8] Jaswant N. Arlekar, Sudhir K. Jain and C.V.R. Murty, Seismic Response of RC Frame Buildings with Soft First Storeys.
-30.000 -20.000 -10.000 0.000 10.000 20.000 30.000 40.000 50.000 60.000
0 1 2 3 4 5 6 7 8 9 10 11 12
B endin g M o m ent ( k N -m) Storey Level
Bending Moment (kN-m)
Model 1
Model 2
Model 3
Model 4
[9] P.B.Lamb, Dr R.S. Londhe, Department of Civil Engineering, I.I.T.Kanpur, Kanpur 208016, Seismic Behavior of Soft First Storey IOSR Journal of Mechanical and Civil Engineering (IOSR-JMCE) ISSN: 2278-1684 Volume 4, Issue 5 (Nov. - Dec. 2012), PP 28-33
[10] Prof. Patil S.S. and Mr. Sagare S.D., Dynamic Analysis of Soft Storey-High Rise Building with Shear Wall, International Journal of Civil Engineering Research & Applications (IJCERA), Vol. 1 Issue 4, August - 2013
[11] Dr. Saraswati Setia and Vineet Sharma, Seismic Response of R.C.C Building with Soft Storey International Journal of Applied Engineering Research, ISSN 0973-4562 Vol.7 No.11 (2012) © Research India Publications.
[12] Mehmet Alper Altuntop, Analysis of building structures with soft stories, The graduate school of natural and applied sciences of Atilim university, october 2007.
[13] Nikhil Agrawal, Prof. P.B kulkarni, Pooja Raut, Analysis of Masonry Infilled R.C.Frame with & without Opening Including Soft Storey by using “Equivalent Diagonal Strut Method, International Journal of Scientific and Research Publications, Volume 3, Issue 9, September 2013 1 ISSN 2250-3153