The use of the international GPS network as the global detector (GLOBDET)
simultaneously observing sudden ionospheric disturbances
Edward L. Afraimovich, Eugene A. Kosogorov, and Ludmila A. Leonovich
Institute of Solar-Terrestrial Physics SD RAS, p. o. box 4026, Irkutsk 664033, Russia
(Received January 17, 2000; Revised September 2, 2000; Accepted September 5, 2000)
We developed a new technology for global detection of ionospheric disturbances, on the basis of phase measure-ments of the total electron content (TEC) along the line-of-sight (LOS) between the receiver on the ground and transmitters on the GPS satellites using an international GPS networks. Temporal dependencies of TEC with the time resolution of 30 s are obtained for a set of spaced receivers of the GPS network simultaneously for the entire set of visible satellites. These series are subjected to filtering in the selected range of oscillation periods using known algorithms for spatio-temporal analysis of signals. An analysis is made of the possibilities of using the GLOBDET when detecting the ionospheric response of solar flares. In this case it is best to make the coherent summation of the filtered series of TEC. Because of a statistical independence of the background fluctuations, the signal/noise ratio, when the flare effect is detected, is increased due to a coherent processing by at least the√Ntimes, whereNis the number of LOS.
1.
Introduction
The advent and evolution of a Global Positioning System, GPS, and also the creation on its basis of widely branched networks of GPS stations (at least 732 sites at August of 2000, the data from which are placed on the INTERNET) opened up a new era in remote ionospheric sensing (Klobuchar, 1997). Furthermore, there exist also powerful regional networks such as the Geographical Survey Institute network in Japan (Saitoet al., 1998) consisting of up to 1000 receivers. High-precision measurements of the group and phase delay along the line-of-sight (LOS) between the receiver on the ground and transmitters on the GPS system satellites covering the reception zone are made using two-frequency multichannel receivers of the GPS system at almost any point of the globe and at any time simultaneously at two coherently coupled frequencies f1=1575.42 MHz and f2=1227.60 MHz.
The sensitivity of phase measurements in the GPS system is sufficient for detecting irregularities with an amplitude of up to 10−3–10−4of the diurnal total electron content (TEC) variation. This makes it possible to formulate the problem of detecting ionospheric disturbances from different sources of artificial and natural origins. Anthropogenic sources of iono-spheric disturbances include nuclear events, chemical explo-sions, and rocket launches. Among natural sources are solar eclipses, solar flares, earthquakes, volcanoes, heavy thun-derstorms, and auroral heating. Studies of these phenomena are of great importance both for a scientific understanding of their genesis and propagation in the atmosphere and as a tool for detecting such sources in remote regions.
Recently a number of authors (for example, Mannucci
Copy right cThe Society of Geomagnetism and Earth, Planetary and Space Sciences (SGEPSS); The Seismological Society of Japan; The Volcanological Society of Japan; The Geodetic Society of Japan; The Japanese Society for Planetary Sciences.
et al., 1998 and others) have developed a new technology for constructing global maps of absolute ‘vertical’ values of TEC using data from the GPS network (Global Ionospheric Maps—GIM technology). Coupled with the possibility of obtaining these maps in the standard IONEX format on the INTERNET, the GIM technology may be used for the global detection of the large-scale ionospheric disturbances (Hoet al., 1998), but with low time resolution of the maps. Hoet al.(1998) have TEC maps with time steps of 15 min at their disposal. Now two-hour resolution data are available on the INTERNET. At the same time, TEC measurements at each particular point of the GPS systems are made with 30-second intervals.
Thus the GIM technology cannot be used in detecting short-lasting processes with a duration of about 1–10 min, much less in detecting virtually simultaneous disturbances on a global scale. A most dramatic example of such dis-turbances is the ionospheric response to a solar flare (Mitra, 1974). Research has also been done into ionospheric irreg-ularities on global-scales (Piet al., 1997) or regional-scales (Aaronset al., 1997), based on estimating the rate of TEC change. However, the recordings of this parameter in the cited references were not used in detecting simultaneous dis-turbances such as solar flares.
The objective of this paper is to develop the concept of a global detector (GLOBDET) of “simultaneous” ionospheric disturbances on global-scale, based on phase measurements of the TEC in the ionosphere using the international network of two-frequency multichannel receivers of the GPS system with the time resolution of 30 s—Section 2. Section 3 dis-cusses the possibilities of using the GLOBDET method in detecting ionospheric effects of solar flares. Basic charac-teristics of such a detector (sensitivity and time resolution) are examined in Section 4. The practical implementation of
the method is illustrated by analyzing a global ionospheric response to a powerful solarflare of July 29, 1999 (Section 5).
2.
Using the Data from a Global GPS Network in
the Context of the Ideology of a Phased Antenna
Array
Phased antenna arrays (PAA) are extensively used in radi-olocation, sonar systems, and in processing seismic signals as systems featuring high sensitivity in signal detection and high spatial selectivity which is necessary for localizing sig-nal sources. There exist quite varied schemes for hardware and software realization of PAA (Collin, 1985). In general case the treatment of signals imply multiplying a complex signalA˜(t)iof each of thei-spaced PAA elements by a com-plex factor K˜i with the subsequent coherent summation of
the resulting products
whereS˜is the result of the coherent summation;iis the PAA element number; andi =1,2, . . . ,N.
By specifying different values ofK˜i, which in each
par-ticular case depend on the conditions of the problem being solved, it is possible to specify parameters determining the sensitivity and selectivity of PAA.
We suggest the concept of a global detector (GLOBDET) of ionospheric disturbances of natural and technogenic ori-gins, based on processing the GPS data in the PAA configu-ration. This concept implies that time dependencies of TEC are obtained for a set of spaced receivers of the GPS network simultaneously for all GPS satellites“visible”during a given time interval. These series are subjected tofiltering over a se-lected range of oscillation periods in order to eliminate slow variations caused by the orbital motion of the satellites and by the diurnal variation of TEC in the ionosphere. Next, these series are processed in the nonequidistant PAA configuration using them in (1) or in other algorithms of PAA as complex signalsA˜(t)i. It is also assumed that equivalent partial anten-nas of such an array are located at subionospheric points. The coordinates of these points are determined for the selected heighthsby means of standard (in the GPS system)
calcula-tions of the azimuthαand elevationθof the LOS between the receiver and the satellite.αandθare reckoned from the northward direction and from the ground, respectively.
The GPS technology provides the means of estimating TEC variations on the basis of phase measurements of TEC
I in each of the spaced two-frequency GPS receivers using the formula (Afraimovichet al., 1998):
I = 1 signal, caused by the phase delay in the ionosphere (m);L1, L2is the number of full phase rotations, andλ1, andλ2, are the wavelengths (m) for the frequencies f1and f2, respectively; constis some unknown initial phase path (m); andn Lis the error in determination of the phase path (m).
The TEC unit,T ECU, which is equal to 1016m−2and is commonly accepted in the literature, will be used throughout the text.
3.
Using the GLOBDET Technology in Detecting
the Ionospheric Response to Solar Flares
The enhancement of X-ray and ultraviolet radiation in-tensity that is observed during chromospheric flares on the Sun immediately causes an increase in electron density in the ionosphere. These density variations are different for differ-ent altitudes and are collectively called Sudden Ionospheric Disturbances (SID). SID observations provide a key means for ground-based detection of solar flares along with opti-cal observations offlares and solar radio burst observations (Mitra, 1974).
SID data for theF-region acquired by different radio prob-ing methods were used repeatedly to estimate time variations in the X-ray and extreme ultraviolet (EUV) spectral regions and in relative measurements of fluxes in different wave-length ranges (Mitra, 1974). The main body of SID data for the Earth’s upper atmosphere was obtained in earlier de-tections of Sudden Frequency Deviations (SFD) of the F -region-reflected radio signal in the HF range (Davies, 1969; Liuet al., 1996).
SFD are caused by an almost time-coincident increase in
E- andF-region electron densities at over 100 km altitudes covering an area with the size comparable to or exceding that of the region monitored by the system of HF radio paths. A limitation of this method is the uncertainty in the spatial and altitude localization of the UV flux effect, the inade-quate number of paths, and the need to use special-purpose equipment.
A further, highly informative, technique is the method of incoherent scatter (IS)—Thome and Wagner (1971). How-ever, the practical implementation of the IS method requires very sophisticated, expensive equipment. An added limita-tion is inadequate time resolulimita-tion. Since the relaxalimita-tion time of electron density in theE- andF1-regions is also less than 5–10 min, most IS measurements lack time resolution needed for the study of inospheric effects offlares.
The effect of solarflares on the ionosphericF-region is also manifested as a Sudden Increase of TEC (SITEC) which was measured previously using continuously operating radio beacons on geostationary satellites (Mendilloet al., 1974). A serious limitation of methods based on analyzing VHF signals from geostationary satellites is their small and ever increasing with the time number and the nonuniform distri-bution in longitude.
Consequently, none of the above-mentioned existing methods can serve as an effective basis for the radio detec-tion system to provide a continuous, global SID monitoring with adequate space-time resolution. Furthermore, the cre-ation of these facilities requires developing special-purpose equipment, including powerful radio transmitters contami-nating the radio environment. It is also significant that when using the existing methods, the inadequate spatial aperture gives no way of deducing the possible spatial inhomogeneity of the X-ray and EUVflux.
Essentially, the method implies using appropriatefiltering and a coherent processing of TEC variations in the iono-sphere simultaneously for the entire set of“visible”(during a given time interval) GPS satellites (as many as 5–10 satel-lites) at all global GPS network stations used in the analysis. In detecting solarflares, the ionospheric response is virtu-ally simultaneous for all stations on the dayside of the globe within the time resolution range of the GPS receivers (from 30 s to 0.1 s). Therefore, the coherent addition of individual realizations A˜(t)i does not require a partial phase shift (the complex part of the termK˜iis zero), and the entire procedure
reduces to a simple addition
˜ S=
N
i=1
˜
A(t)iKi (3)
whereA˜(t)irepresentsfiltered TEC variations, andKiis the
amplitude weighting factor determined by the geometry of thei-beam (LOS) to the satellite. To afirst approximation, this factor is (Klobuchar, 1986).
Ki=cos
arcsin
Rz Rz+hs
cosθi
(4)
where Rz is the Earth’s radius;hs = 300 km is the height
for the subionospheric point where the conversion is taken place. Thehs can be chosen at other altitudes, such as 350
km, 400 km, or 450 km.
Reconstructing the absolute value of the ionospheric re-sponse to the solarflare requires a more accurate (than used in this paper) conversion of the“oblique” TEC value to a “vertical”one, especially at low values of elevations of the beam to the satellite. To do this, it is necessary not only to eliminate, for this beam to the satellite, the ambiguity of the determination of the absolute TEC value which arises when only phase measurements are used in the GPS system. The response can only be estimated reliable, with the inclusion the spatially inhomogeneous ionosphere, by using all beams to the satellite, and by applying adequate methods of spatial interpolation. This problem is considered in a series of pub-lications (for example, Mannucciet al., 1998) and is beyond the scope of this paper.
4.
Characteristics of a Global Detector
It is impossible to give a detailed account of the charac-teristics of the proposed global detector for reasons of space. This is beyond the scope of this study and will be reported elsewhere. We limit our attention to discussing only some general parameters of such a detector such as sensitivity and time resolution.
The detection sensitivity is determined by the ability to detect typical signals of the ionospheric response to a solar flare (leading edge duration, period, form, length) at the level of TEC backgroundfluctuations. Ionospheric irregularities are characterized by a power spectrum, so that background fluctuations will always be distinguished in the frequency range of interest. However, backgroundfluctuations are not correlated in the case of beams to the satellite spaced by an amount exceeding the typical irregularity size.
With a typical length of X-ray bursts and EUV emission of solarflares of about 5–10 min, the corresponding ionization
irregularity size does normally not exceed 30–50 km; hence the condition of a statistical independence of TEC fluctua-tions at spaced beams is almost always satisfied. Therefore, coherent summation of responses to aflare on a set of beams spaced thoughout the dayside of the globe permits the solar flare effect to be detected even when the response amplitude on partial beams is markedly smaller than the noise level (backgroundfluctuations). The proposed procedure of co-herent accumulation is essentially equivalent to the operation of coincidence schemes which are extensively used in X-ray and gamma-ray telescopes.
If the SID response and backgroundfluctuations, respec-tively, are considered to be the signal and noise, then as a consequence of a statistical independence of background fluctuations the signal/noise ratio when detecting theflare effect is increased through a coherent processing by at least a factor of√N, whereN is the number of LOS.
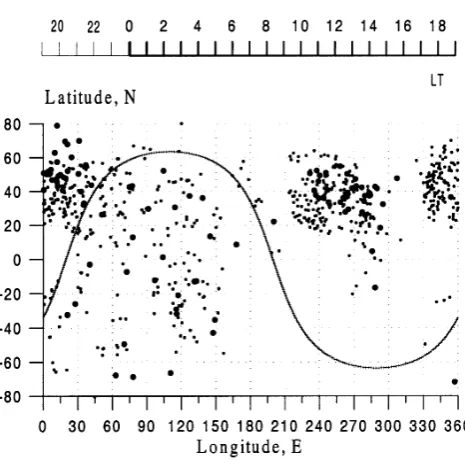
The solarflare of July 29, 1999 was used to illustrate the performance of the proposed method. Figure 1 presents the geometry of a global GPS array used in this paper to analyze the effects of thisflare (105 stations). The coordinates of the stations are not given here for reasons of space.
As is evident from Fig. 1, the set of stations which we chose out of the global GPS network available to us, cov-ers rather densely North America and Europe, but provides much worse coverage of the Asian part of the territory used in the analysis. The number of GPS stations in the Pacific and Atlantic regions is even fewer. However, coverage of the
ritory with partial beams to the satellite for the limitation on elevationsθs >10◦, which we have selected, is substantially wider. Dots in Fig. 1 mark the coordinates of subinospheric points for the heighths = 300 km for all visible satellites
at 19:30 UT for each GPS station. A total number of beams (and subionospheric points) used in this paper to analyze the July 29, 1999flare is 622.
Such coverage of the terrestrial surface makes it possi-ble to solve the propossi-blem of detecting time-coincident events with spatial resolution (coherent accumulation) two orders of magnitude higher, as a minimum, than could be achieved in SFD detection on oblique HF paths (Davies, 1969; Liuet al., 1996). For simultaneous events in the western hemisphere, the corresponding today’s number of stations and beams can be as many as 400 and 2000–3000, respectively.
It should be noted that because of the relatively low satellite orbit inclinations, the GPS network (and to a lesser degree GLONASS) provides poor coverage of the Earth’s surface near the poles. However, TEC measurements in the polar regions are ineffective with respect to the detection of the ionospheric response to a solarflare because the amplitude of backgroundfluctuations in this case is much higher when compared with the mid-latitude ionosphere. This is particu-larly true of geomagnetic disturbance periods. For the same reason, equatorial stations should also be excluded from a coherent processing.
If the Earth’s ionosphere is regarded as thefilling of some global detector of X-ray and EUV emissions, then it is possi-ble to estimate a huge volumeVdetof the potential sensitivity region of such a detector. This volume is equal to one-half the difference of the volumes of spheres with the radiiRz+Hmax andRz+Hmin
Vdet=2π[(Rz+Hmax)3−(Rz+Hmin)3]/3 (5)
where Hmin and Hmax are the upper and lower boundaries of the absorbing layer for a given part of theflare emission spectrum; andRz is the Earth’s radius. For the EUV range, Hmin =100 km, and Hmax =200 km (Mitra, 1974), which gives the volumeVdet of order 2.65×10¹⁹m3. For the X-ray part of the spectrum, Hmin = 60 km, and Hmax = 80 km (Mitra, 1974), and the corresponding volume is 0.523× 10¹⁹m3.
The actual sensitivity is in fact determined by the num-ber of beams penetrating the region of potential sensitivity. Furthermore, solarflare-induced TEC perturbations consti-tute but a small part of TEC including the height range up to 1000 km. There are methods to estimate the height in the ionosphere, but they do not come within the province of this paper.
On the one hand, GLOBDET time resolution is limited by technical capabilities of the GPS system. Essentially, data with a time resolution of about 30 s are currently available on the INTERNET, which is insufficient for a detailed analysis of thefine structure of the SID time dependence. Yet this limitations seems to be transient since current multichannel two-frequency GPS receivers can operate with a time reso-lution of up to 0.1 s.
On the other hand, time resolution is determined by time constants of ionization and recombination processes in the ionosphere at a given height (Mitra, 1974); these parameters
can be taken into acount when processing the data.
5.
Ionospheric Response to the Solar Flare of July
29, 1999
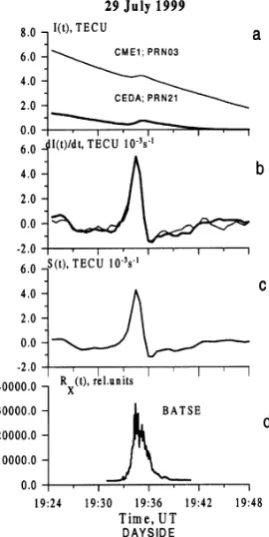
A powerful impulsiveflare of July 29, 1999 was chosen to illustrate the practical implementation of the proposed method. Figure 2d (and Fig. 3d) shows the time depen-dence of the X-ray emission intensity RX(t)of thisflare as
measured by the X-telescope BATSE on satellite CGRO in 25–50 keV range. The envelope of the dependence RX(t)
represents a bell-shaped pulse of about 3-min duration with a maximum corresponding to 19:34 UT, or to about 12:00 LT in the U.S. West (Fig. 1). This time interval is characterized by a low level of geomagnetic disturbance (within−10 nT), which simplified greatly the SID detection problem.
We now describe briefly the sequence of GPS data process-ing procedures. Primary data include series of “oblique” values of TEC I(t), as well as the corresponding series of elevations θs(t) and azimuths αs(t) along LOS to the satellite calculated using our developed CONVTEC program which converts the GPS system standard RINEX-files on the INTERNET (Gurtner, 1993). The determination of SID char-acteristics involves selecting continuous series of I(t) mea-surements of at least a one-hour interval in length, which includes the time of theflare. Series of elevationsθs(t)and azimuthsαs(t)of the beam to the satellite are used to deter-mine the coordinates of subionospheric points. In the case
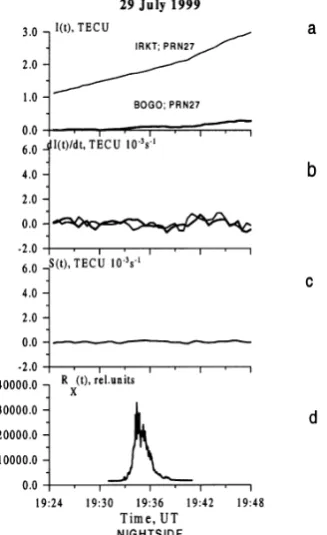
Fig. 3. Same as in Fig. 2, but for the nightside. Selected data for sites IRKT (PRN27) and BOGO (PRN27) are presented in panels a and b.
under consideration, all results were obtained for elevations
θs(t)larger than 10◦.
Figure 2a presents typical time dependencies of an “ver-tical”TEC I(t)for the PRN03 satellite at the CME1 sta-tion (40.4◦N; 235.6◦E) on July 29, 1999 (thick line) and for PRN21 at the CEDA station (40.7◦N; 247.1◦E—thin line). It is apparent from Fig. 2a that in the presence of slow TEC variations, the SID-induced short-lasting sudden increase in TEC is clearly distinguished in the form of a“step”as large as 0.4T ECU.
For the same series, similar lines in panel b show varia-tions of the time derivative of TECd I(t)/dtwith the linear trend removed and with a smoothing with the 5-min time window. The d I(t)/dt variations for different beams are well correlated over the time interval from 19:30 to 19:39 UT. The TEC time derivative is invoked because it reflects electron density variations which are proportional to the X-ray or EUVflux (Mitra, 1974; Liuet al., 1996). The time intervaldtford I/dtcomputation is 30 s.
The coherent summation of d I(t)/dti realizations was
made by the formula (3). The (normalized toN) result of a coherent summation of theS(t)-series for all beams and GPS stations located mainly on the dayside is presented in panel c. A comparison of the resulting coherent sum ofS(t)with the time dependenced I(t)/dtfor individual beams presented in panels b confirms the effect of a substantial increase of the signal/noise ratio caused by a coherent processing.
It is interesting to compare, for the same time interval, the data on individual beams and results from a coherent summation for the dayside and nightside. Figure 3a presents typical time dependencies of an“oblique”TECI(t)for the
PRN27 satellite at the IRKT station (52.2◦N; 104.3◦E—thick line) and for PRN27 at the BOGO station (52.5◦N; 20.0◦E— thin line). Using theI(t)data it is impossible to identify any SID-induced short-lasting sudden increase in TEC. This is also true for the time derivativesd I(t)/dtplotted in panels b. As a result, the r.m.s. of the coherent sum of S(t)in panel c for the nightside is of the same order of magnitude as that of backgroundfluctuations outside the SID response interval on the dayside, which is an order of magnitude (as a minimum) smaller than the SID response amplitude (Fig. 2c).
A comparison of the coherent sum of S(t)with the time dependence of the X-ray emission intensity RX(t) of the
July 29, 1999flare, based on the data from the X-telescope BATSE on satellite CGRO data in 25–50 keV range, shows their high correlation and an almost total coincidence of the form ofS(t)with the RX(t)pulse envelope at 19:33–19:38
UT time interval (Fig. 2d). The same time dependence of X-rays is shown in Fig. 3d in order to demonstrate the lack of TEC response during the solarflare on the nightside.
Unfortunately, the lack of data on UV emission of the flares under investigation, the most probable ionizing factor at ionospheric heights above 100 km, gives no way of making absolute estimates of the TEC increment and comparing them with measured values. It is pointed out in Mitra (1974) that although UV emission is essentially responsible for SID in the F-region, TEC variations are also correlated quite well with X-ray flares. This is also confirmed by simultaneous measurements of X-ray and EUVflare emission characteris-tics by the Solar Maximum Mission satellite (Vanderveenet al., 1988).
6.
Conclusions
This paper has offered a brief outline of the concept of a global detector (GLOBDET) of ionospheric disturbances, based on phase measurements of a TEC in the ionosphere which were made using the international network of two-frequency multichannel GPS receivers. We have discussed the possibilities of using GLOBDET method in detecting ionospheric effects of solarflares. A case study of a global ionospheric response to a powerful solar flare of July 29, 1999 illustrates the new experimental potential.
For powerful solarflares like the one examined in this re-port, it is not necessary to invoke a coherent summation, and the SID response can be investigated for each beam. This opens the way to a detailed study of the SID dependence on a great variety of parameters (latitude, longitude, solar zenith angle, spectral characteristics of the emission flux, etc.). With current increasing solar activity, such studies be-come highly challenging. In addition to solving traditional problems of estimating parameters of ionization processes in the ionosphere and problems of reconstructing emission parameters (Mitra, 1974; Liuet al., 1996), the data obtained through the use of GLOBDET can be used to estimate the spa-tial inhomogeneity of emissionfluxes at scales of the Earth’s radius.
Acknowledgments. Authors are grateful to A. T. Altyntsev for his encouraging interest in this study and active participations in discus-sions. Authors are also indebted to O. S. Lesuta, V. V. Grechnev, and K. S. Palamarchouk for preparing the input data. Thanks are also due V. G. Mikhalkovsky for his assistance in preparing the English version of the TEX-manuscript. Finally, the authors wish to thank the referees for valuable suggestions which greatly improved the presentation of this paper. This work was done with support under RFBR grant of leading scientific schools of the Russian Federation No. 00-15-98509 and Russian Foundation for Basic Research (grant 99-05-64753).
References
Aarons, J., M. Mendillo, and R. Yantosca, GPS phasefluctuations in the equatorial region during sunspot minimum,Radio Sci.,32, 1535–1550, 1997.
Afraimovich, E. L., K. S. Palamartchouk, and N. P. Perevalova, GPS radio interferometry of traveling ionospheric disturbances,J. Atmos. Solar-Terr. Phys.,60, 1205–1223, 1998.
Collin, R. E.,Antennas and Radiowave Propagation, McGraw-Hill, New York, 1985.
Davies, K.,Ionospheric Radio Waves, Blaisdell Publishing Company, A Di-vision of Ginn and Company, Waltham, Massachusetts-Totonto-London, 1969.
Gurtner, W., RINEX: The Receiver Independent Exchange Format Ver-sion 2, http://igscb.jpl.nasa.gov/igscb/data/format/ rinex2.txt, 1993.
Ho, C. M., B. A. Iijima, X. P. Lindqwister, A. J. Mannucci, L. Sparks, M. J. Reyes, and B. D. Wilson, Ionospheric total electron content perturbations monitored by the GPS global network during two northern hemisphere winter storms,J. Geophys. Res.,103, 26409–26420, 1998.
Klobuchar, J. A., Real-time ionospheric science: The new reality,Radio
Sci.,32, 1943–1952, 1997.
Klobuchar, J. A., Ionospheric time-delay algorithm for single-frequency GPS users,IEEE Transactions on Aerospace and Electronics System, AES 23(3), 325–331, 1986.
Liu, J. Y., C. S. Chiu, and C. H. Lin, The solarflare radiation responsible for sudden frequency deviation and geomagneticfluctuation,J. Geophys. Res.,101, 10855–10862, 1996.
Mannucci, A. J., C. M. Ho, U. J. Lindqwister, T. F. Runge, B. D. Wilson, and D. N. Yuan, A global mapping technique for GPS-drived ionospheric TEC measurements,Radio Sci.,33, 565–575, 1998.
Mendillo, M., J. A. Klobuchar, R. B. Fritz, A. V. da Rosa, L. Kersley, K. C. Yeh, B. J. Flaherty, S. Rangaswamy, P. E. Schmid, J. V. Evans, J. P. Schodel, D. A. Matsoukas, J. R. Koster, A. R. Webster, and P. Chin, Behavior of the ionospheric F region during the great solarflare of August 7, 1972,J. Geophys. Res.,79, 665–672, 1974.
Mitra, A. P.,Ionospheric Effects of Solar Flares, 294 pp., New Delhi-12, India, 1974.
Pi, X., A. J. Mannucci, U. J. Lindgwister, and C. M. Ho, Monitoring of global ionospheric irregularities using the worldwide GPS network,Geophys. Res. Lett.,24, 2283–2286, 1997.
Saito, A., S. Fukao, and S. Miyazaki, High resolution mapping of TEC perturbations with the GSI GPS network over Japan,Geophys. Res. Lett., 25, 3079–3082, 1998.
Thome, G. D. and L. S. Wagner, Electron density enhancements in the E and F regions of the ionosphere during solarflares,J. Geophys. Res.,76, 6883–6895, 1971.
Vanderveen, K., L. E. Orwig, and E. Tandberg-Hanssen, Temporal correla-tions between impulsive ultraviolet and hard X-ray busts in solarflares observed with high time resolution,Astrophys. J.,330, 480–492, 1988.